| Param | Original file | Final file |
|---|---|---|
| Filename | modeM0/AS1C07_001T02_9000006452_51057cztM0_level2.fits | modeM0/AS1C07_001T02_9000006452_51057cztM0_level2_quad_clean.evt |
| Size (bytes) | 963,149,760 | 77,074,560 |
| Size | 918.5 MB | 73.5 MB |
| Events in quadrant A | 7,341,187 | 599,932 |
| Events in quadrant B | 4,211,906 | 667,163 |
| Events in quadrant C | 8,330,241 | 503,813 |
| Events in quadrant D | 15,242,629 | 87,294 |
| Mode SS | |||
|---|---|---|---|
| Quadrant | BADHDUFLAG | Total packets | Discarded packets |
| A | 0 | 140 | 0 |
| B | 0 | 140 | 0 |
| C | 0 | 140 | 0 |
| D | 0 | 140 | 0 |
| Mode M9 | |||
|---|---|---|---|
| Quadrant | BADHDUFLAG | Total packets | Discarded packets |
| A | 0 | 16 | 0 |
| B | 0 | 16 | 0 |
| C | 0 | 16 | 0 |
| D | 0 | 17 | 0 |
| Mode M0 | |||
|---|---|---|---|
| Quadrant | BADHDUFLAG | Total packets | Discarded packets |
| A | 0 | 26681 | 2 |
| B | 0 | 17392 | 2 |
| C | 0 | 29455 | 2 |
| D | 0 | 49964 | 6 |
| Quadrant | Total seconds | Saturated seconds | Saturation percentage |
|---|---|---|---|
| A | 6813 | 558 | 8.190225% |
| B | 6813 | 347 | 5.093204% |
| C | 6813 | 1477 | 21.679143% |
| D | 6812 | 5920 | 86.905461% |
Noise dominated data is calculated using 1-second bins in cleaned event files. If a bin has >2000 counts, and if more than 50% of those come from <1% of pixels, then it is considered to be noise-dominated and hence unusable.
| Quadrant | # 1 sec bins | Bins with >0 counts | Bins with >2000 counts | High rate bins dominated by noise | Noise dominated (total time) | Noise dominated (detector-on time) | Marked lightcurve |
|---|---|---|---|---|---|---|---|
| A | 7858 | 6814 | 478 | 478 | 6.08% | 7.01% | 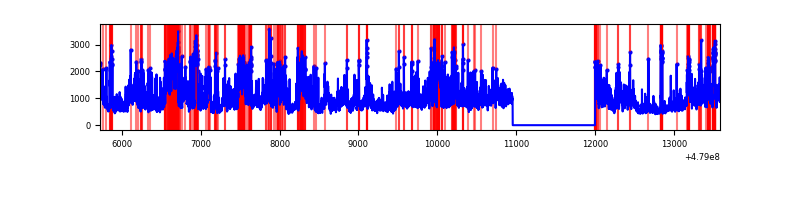 |
| B | 7858 | 6814 | 222 | 222 | 2.83% | 3.26% | 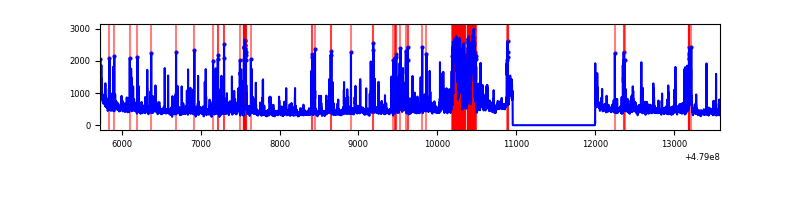 |
| C | 7858 | 6814 | 1534 | 1534 | 19.52% | 22.51% | 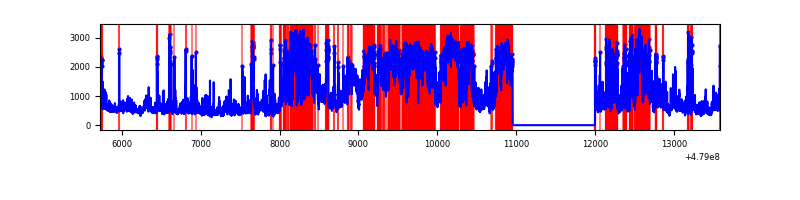 |
| D | 7857 | 6813 | 4759 | 4759 | 60.57% | 69.85% | 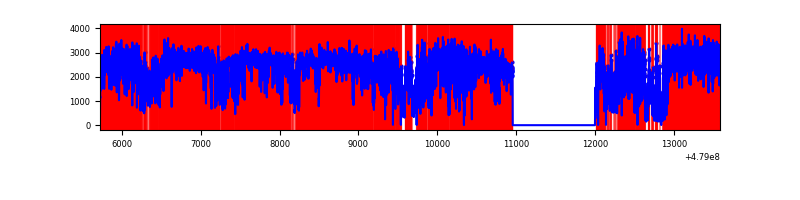 |
Top three noisy pixels from each quadrant. If the there are fewer than three noisy pixels in the level2.evt file, extra rows are filled as -1
| Pixel properties | Quadrant properties | ||||||
|---|---|---|---|---|---|---|---|
| Quadrant | DetID | PixID | Counts | Sigma | Mean | Median | Sigma |
| A | 12 | 3 | 1413846 | 8351.54 | 682 | 667 | 169.2 |
| A | 10 | 253 | 602867 | 3558.85 | 682 | 667 | 169.2 |
| A | 4 | 249 | 562108 | 3317.98 | 682 | 667 | 169.2 |
| B | 4 | 171 | 582215 | 3945.85 | 691 | 667 | 147.4 |
| B | 4 | 81 | 189410 | 1280.64 | 691 | 667 | 147.4 |
| B | 5 | 185 | 122230 | 824.81 | 691 | 667 | 147.4 |
| C | 4 | 12 | 3685954 | 21114.84 | 626 | 620 | 174.5 |
| C | 12 | 247 | 865707 | 4956.45 | 626 | 620 | 174.5 |
| C | 12 | 2 | 261215 | 1493.06 | 626 | 620 | 174.5 |
| D | 8 | 176 | 13021069 | 184280.73 | 244 | 235 | 70.7 |
| D | 15 | 9 | 475904 | 6732.03 | 244 | 235 | 70.7 |
| D | 10 | 172 | 169418 | 2394.41 | 244 | 235 | 70.7 |
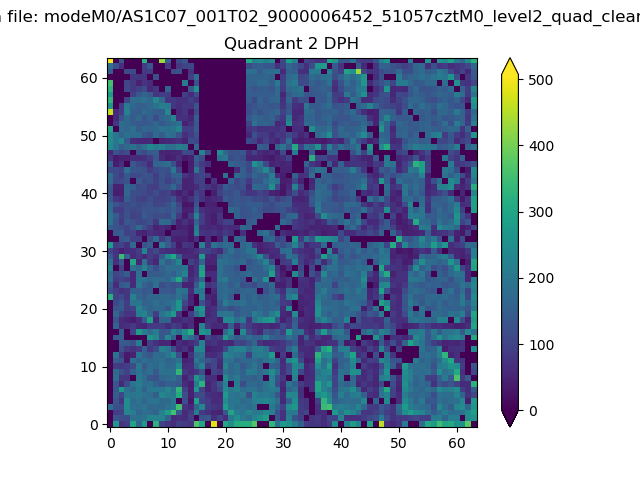
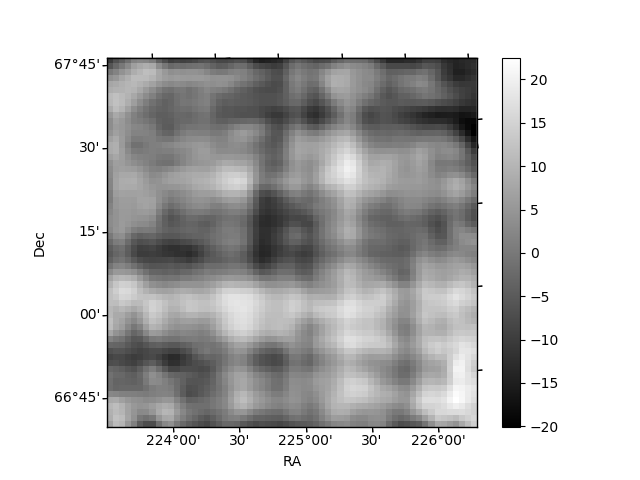
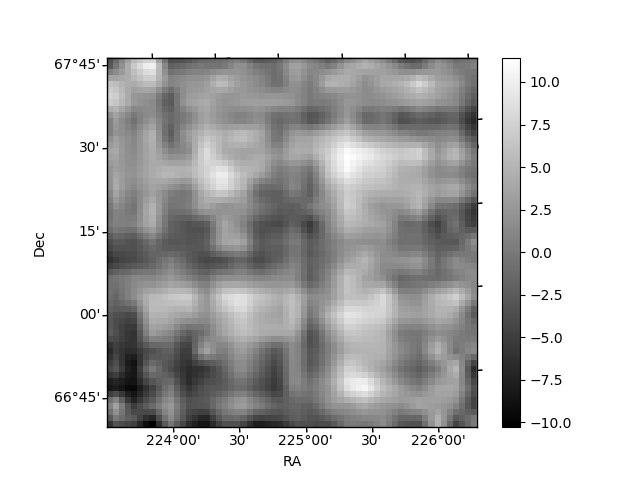
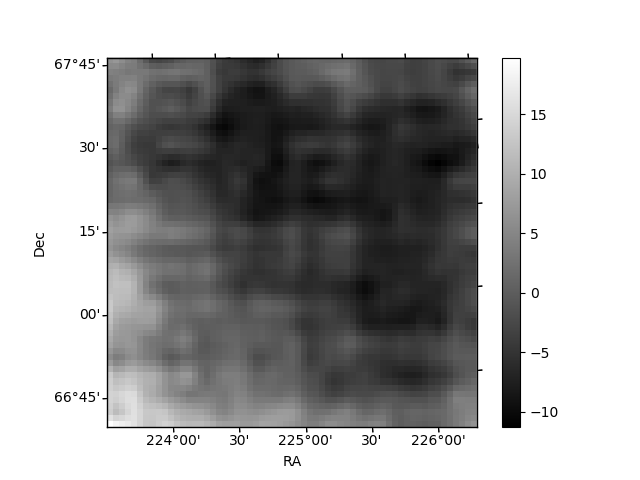
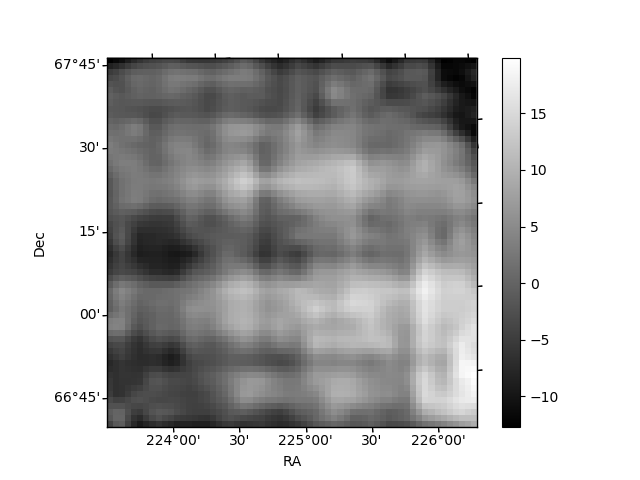
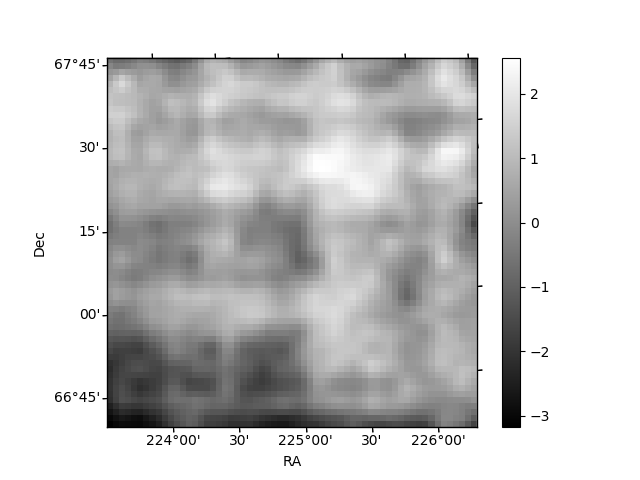
Histogram calculated using DETX and DETY for each event in the final _common_clean file
| Quadrant A | 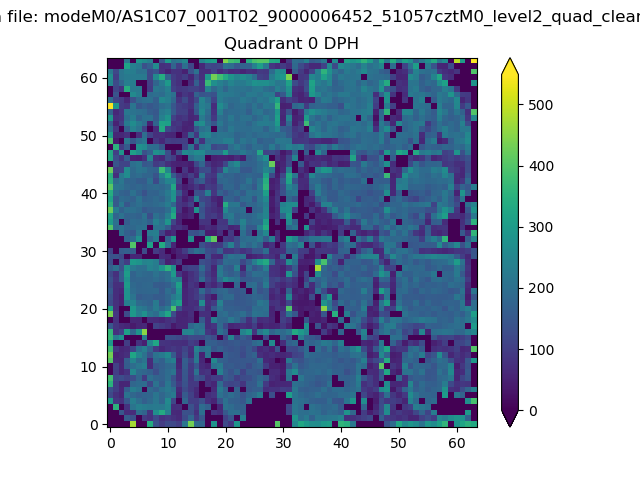 |
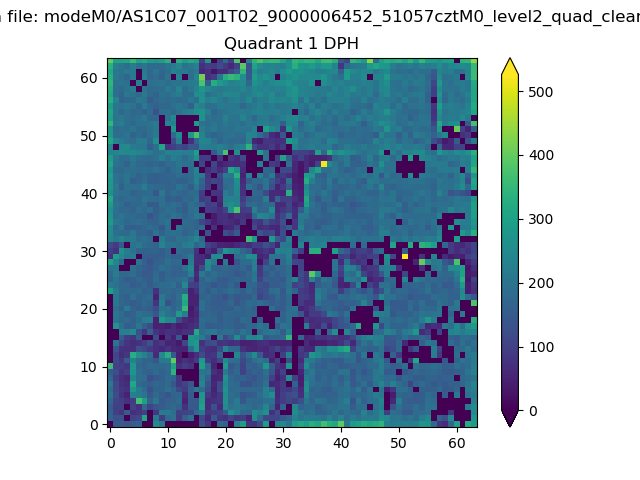 |
Quadrant B |
|---|---|---|---|
| Quadrant D | 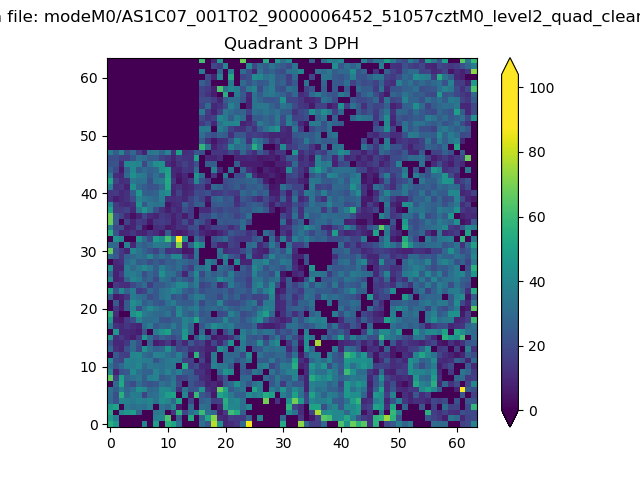 |
 |
Quadrant C |
| Plot type | Count rate plots | Images |
|---|---|---|
| Comparison with Poisson distribution Blue bars denote a histogram of data divided into 1 sec bins. Red curve is a Poisson curve with rate = median count rate of data. |
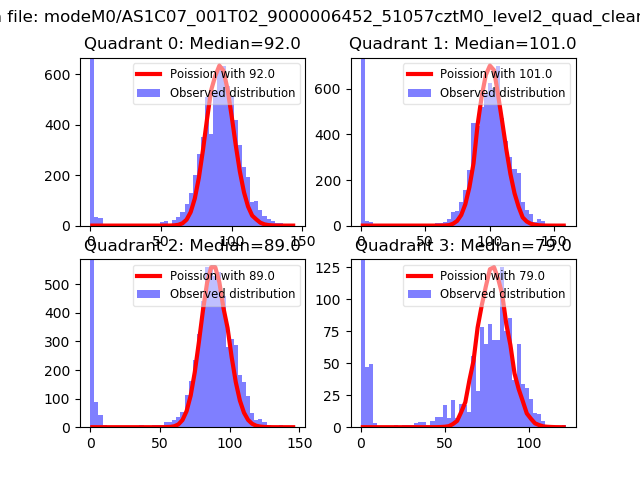 |
 |
| Quadrant-wise count rates Data is divided into 100 sec bins |
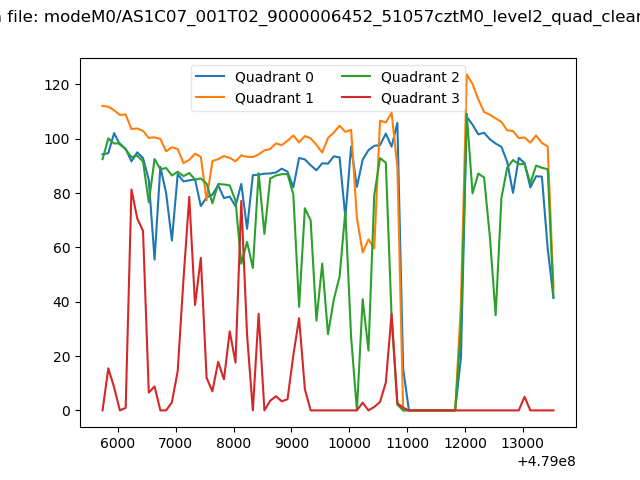 |
|
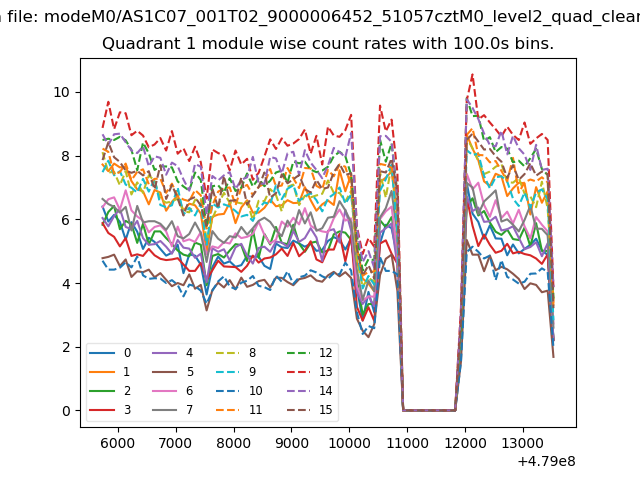
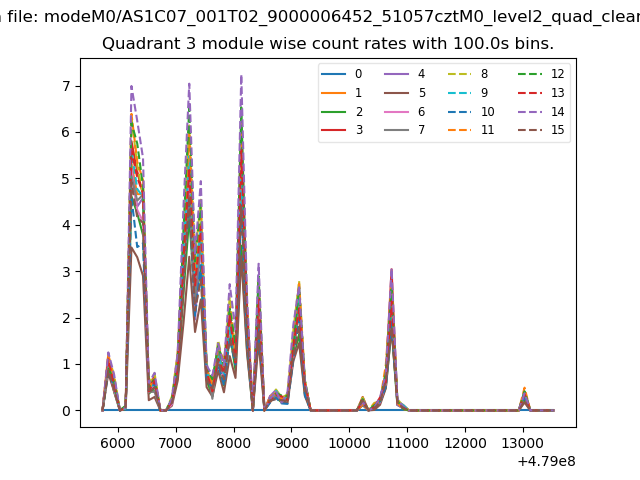
| Module-wise count rates for Quadrant A Data is divided into 100 sec bins |
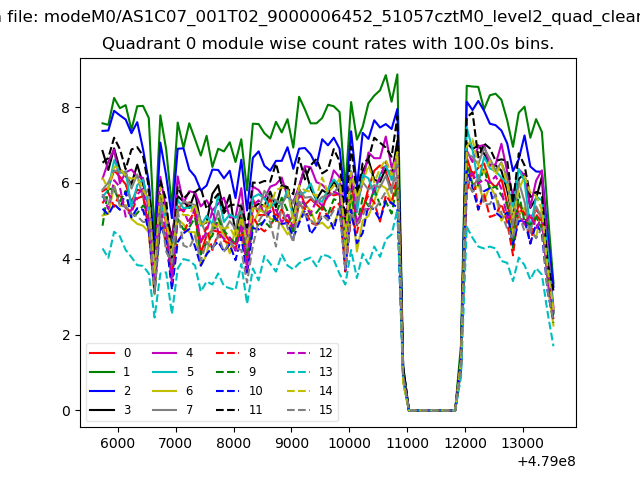 |
 |
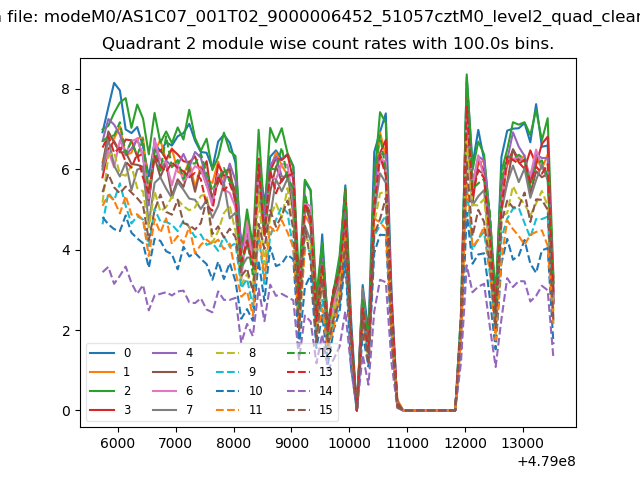
| Module-wise count rates for Quadrant B Data is divided into 100 sec bins |
 |
 |
| Module-wise count rates for Quadrant C Data is divided into 100 sec bins |
 |
 |
| Module-wise count rates for Quadrant D Data is divided into 100 sec bins |
 |
 |
| Parameter | Plot |
|---|---|
| CZT HV Monitor | 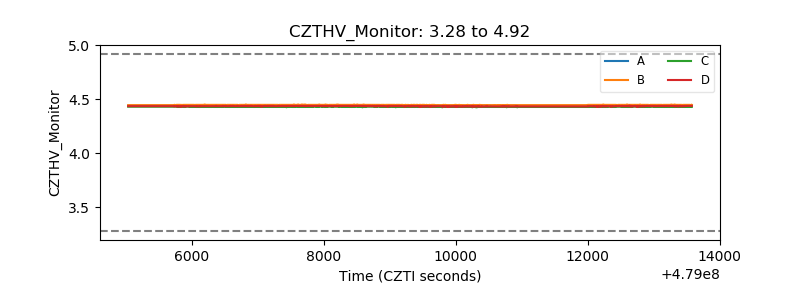 |
| D_VDD | 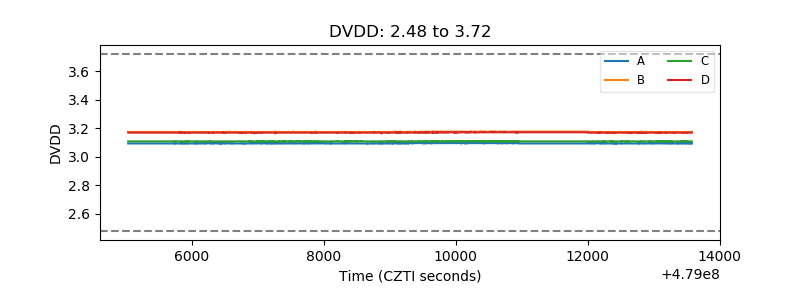 |
| Temperature 1 | 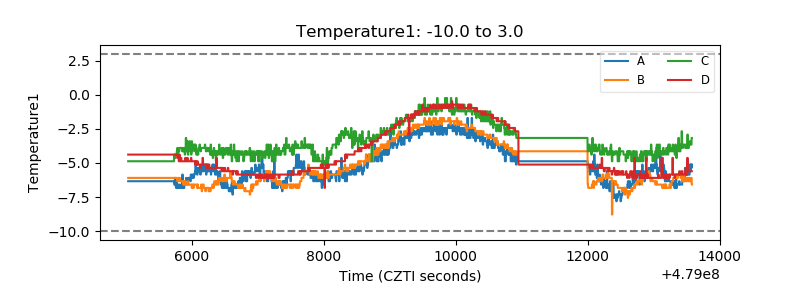 |
| Veto HV Monitor | 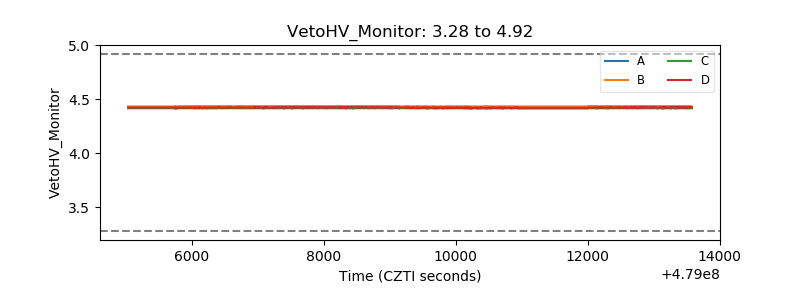 |
| Veto LLD | 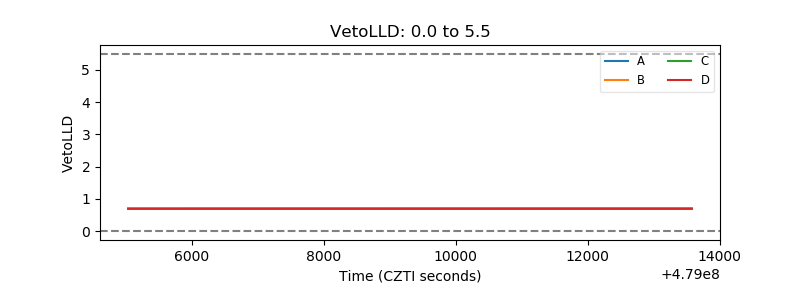 |
| Alpha Counter | 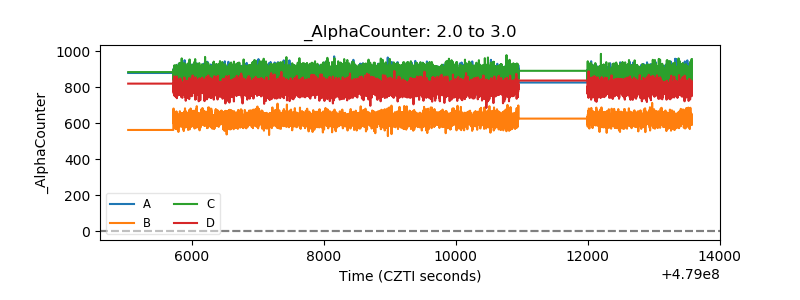 |
| _CPM_Rate | 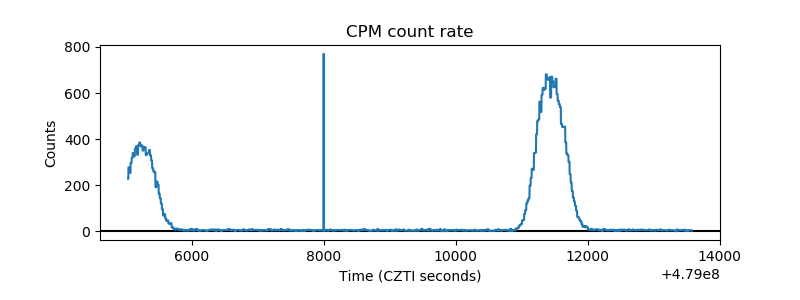 |
| CZT Counter | 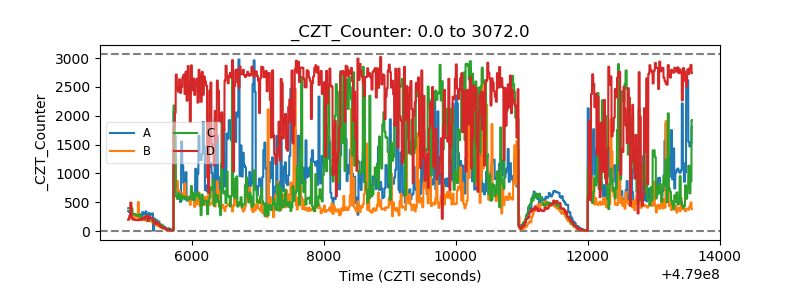 |
| +2.5 Volts monitor | 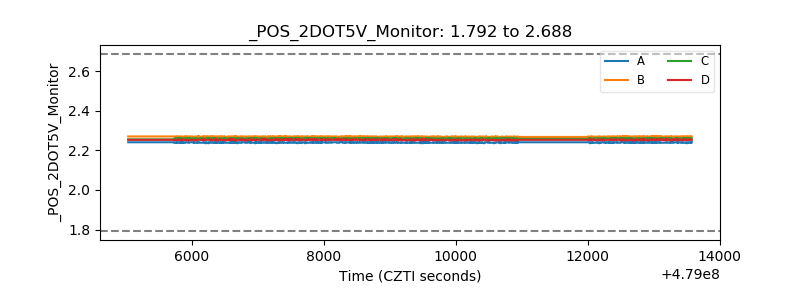 |
| +5 Volts monitor | 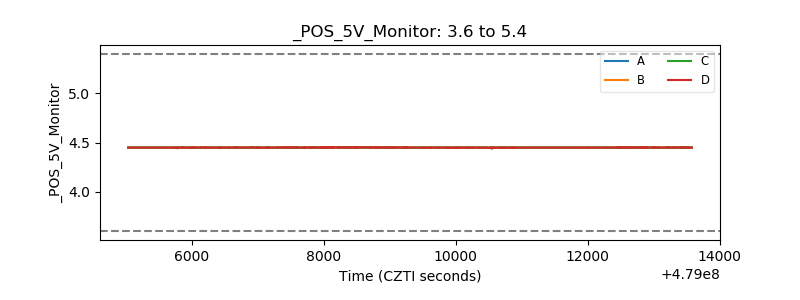 |
| _ROLL_ROT | 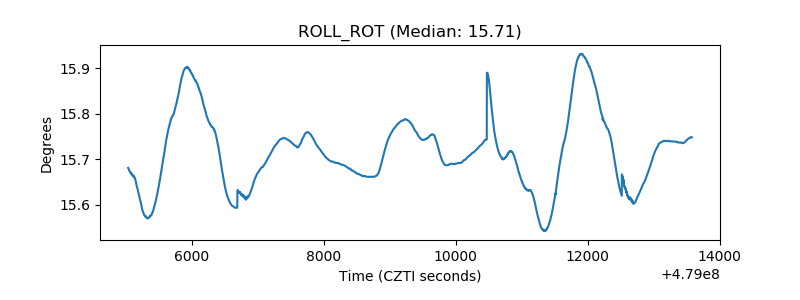 |
| _Roll_DEC | 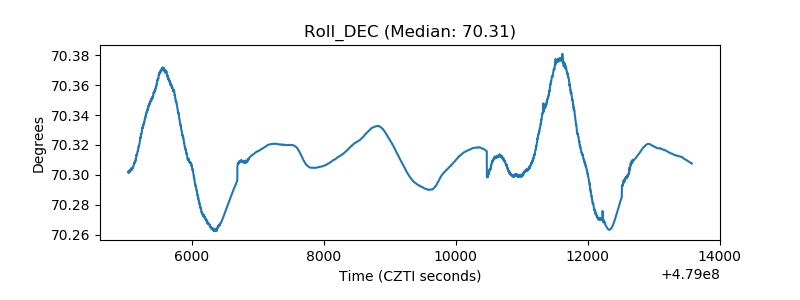 |
| _Roll_RA | 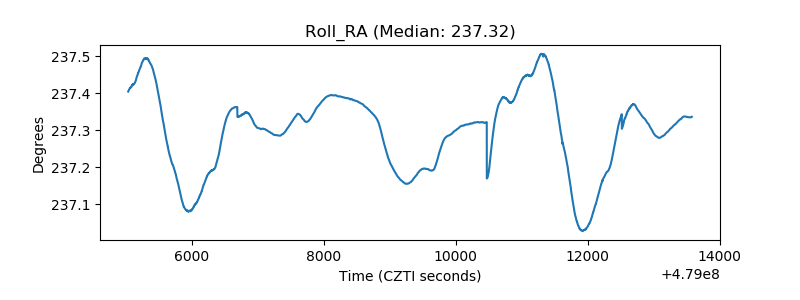 |
| Veto Counter | 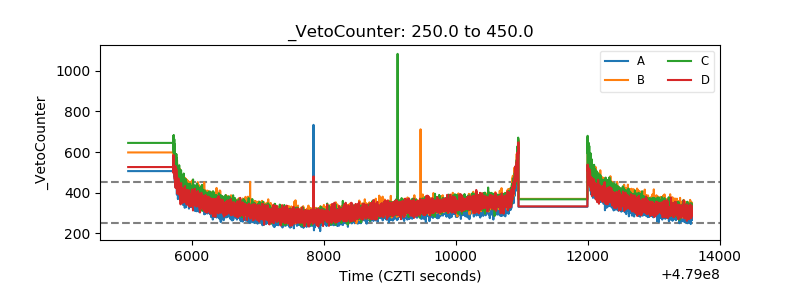 |