| Param | Original file | Final file |
|---|---|---|
| Filename | modeM0/AS1C07_001T02_9000006452_51133cztM0_level2.fits | modeM0/AS1C07_001T02_9000006452_51133cztM0_level2_quad_clean.evt |
| Size (bytes) | 46,684,800 | 7,580,160 |
| Size | 44.5 MB | 7.2 MB |
| Events in quadrant A | 530,352 | 46,400 |
| Events in quadrant B | 320,808 | 51,347 |
| Events in quadrant C | 536,614 | 43,619 |
| Events in quadrant D | 295,636 | 43,893 |
| Mode SS | |||
|---|---|---|---|
| Quadrant | BADHDUFLAG | Total packets | Discarded packets |
| A | 0 | 10 | 0 |
| B | 0 | 10 | 0 |
| C | 0 | 9 | 1 |
| D | 0 | 10 | 0 |
| Mode M0 | |||
|---|---|---|---|
| Quadrant | BADHDUFLAG | Total packets | Discarded packets |
| A | 0 | 1978 | 31 |
| B | 0 | 1325 | 5 |
| C | 0 | 1999 | 16 |
| D | 0 | 1280 | 7 |
| Quadrant | Total seconds | Saturated seconds | Saturation percentage |
|---|---|---|---|
| A | 527 | 12 | 2.277040% |
| B | 534 | 19 | 3.558052% |
| C | 534 | 66 | 12.359551% |
| D | 533 | 4 | 0.750469% |
Noise dominated data is calculated using 1-second bins in cleaned event files. If a bin has >2000 counts, and if more than 50% of those come from <1% of pixels, then it is considered to be noise-dominated and hence unusable.
| Quadrant | # 1 sec bins | Bins with >0 counts | Bins with >2000 counts | High rate bins dominated by noise | Noise dominated (total time) | Noise dominated (detector-on time) | Marked lightcurve |
|---|---|---|---|---|---|---|---|
| A | 537 | 535 | 9 | 9 | 1.68% | 1.68% | 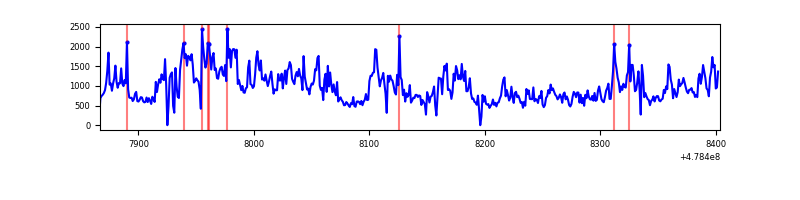 |
| B | 537 | 536 | 16 | 16 | 2.98% | 2.99% | 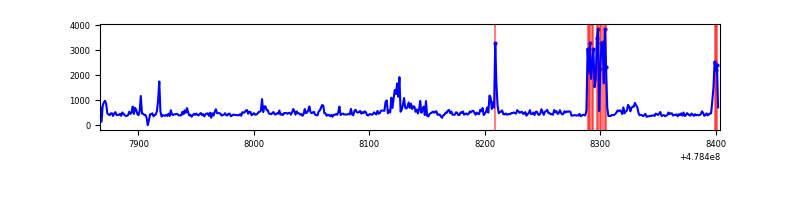 |
| C | 537 | 537 | 70 | 70 | 13.04% | 13.04% | 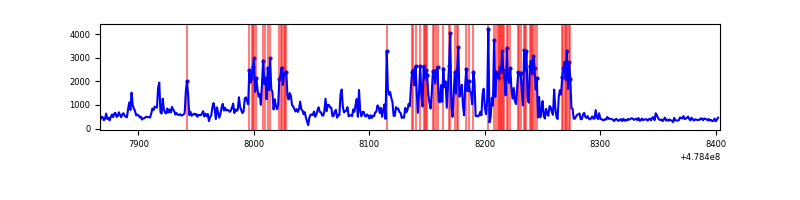 |
| D | 537 | 536 | 4 | 4 | 0.74% | 0.75% | 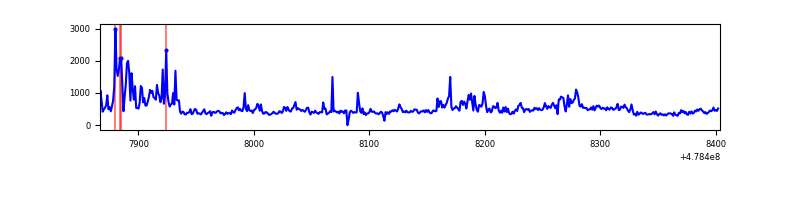 |
Top three noisy pixels from each quadrant. If the there are fewer than three noisy pixels in the level2.evt file, extra rows are filled as -1
| Pixel properties | Quadrant properties | ||||||
|---|---|---|---|---|---|---|---|
| Quadrant | DetID | PixID | Counts | Sigma | Mean | Median | Sigma |
| A | 12 | 3 | 277754 | 19728.63 | 50 | 49 | 14.1 |
| A | 12 | 194 | 30559 | 2167.48 | 50 | 49 | 14.1 |
| A | 4 | 3 | 6578 | 463.83 | 50 | 49 | 14.1 |
| B | 0 | 171 | 48865 | 3855.12 | 50 | 49 | 12.7 |
| B | 4 | 206 | 39399 | 3107.57 | 50 | 49 | 12.7 |
| B | 6 | 51 | 12275 | 965.52 | 50 | 49 | 12.7 |
| C | 4 | 12 | 201394 | 13503.21 | 47 | 46 | 14.9 |
| C | 15 | 230 | 102044 | 6840.4 | 47 | 46 | 14.9 |
| C | 13 | 3 | 11364 | 759.03 | 47 | 46 | 14.9 |
| D | 3 | 12 | 40068 | 2706.46 | 47 | 46 | 14.8 |
| D | 15 | 154 | 24741 | 1669.98 | 47 | 46 | 14.8 |
| D | 6 | 42 | 22265 | 1502.55 | 47 | 46 | 14.8 |
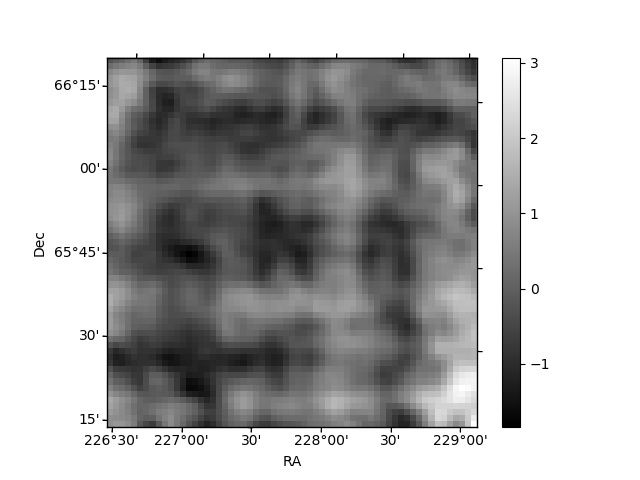
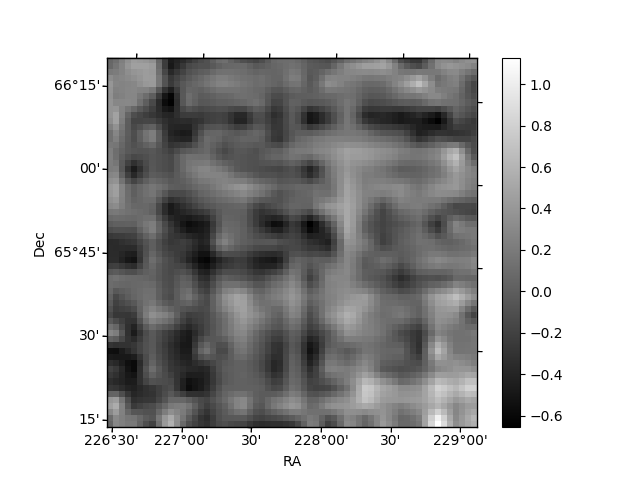
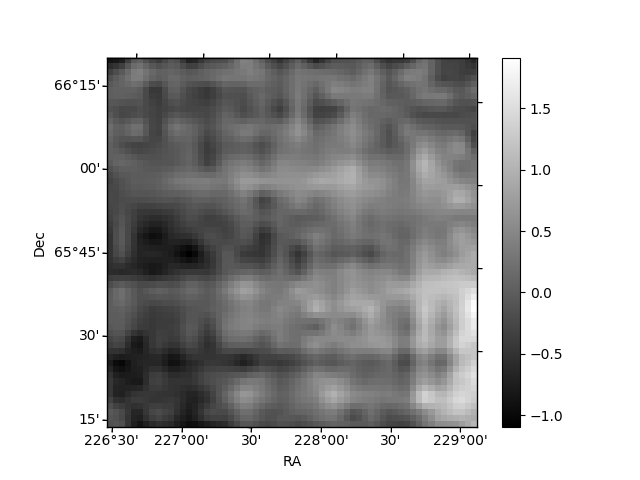
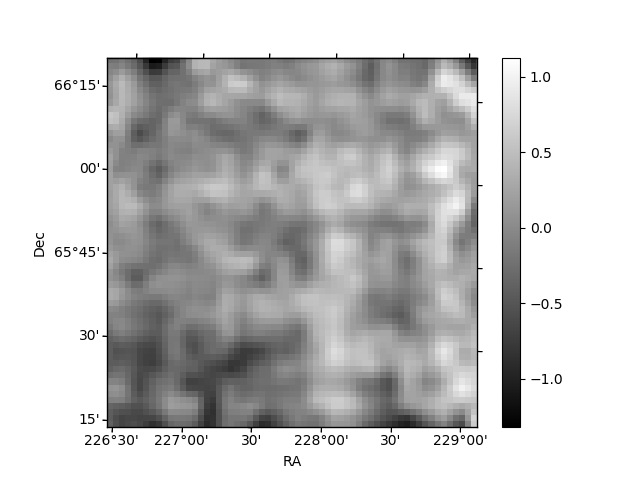
Histogram calculated using DETX and DETY for each event in the final _common_clean file
| Quadrant A | 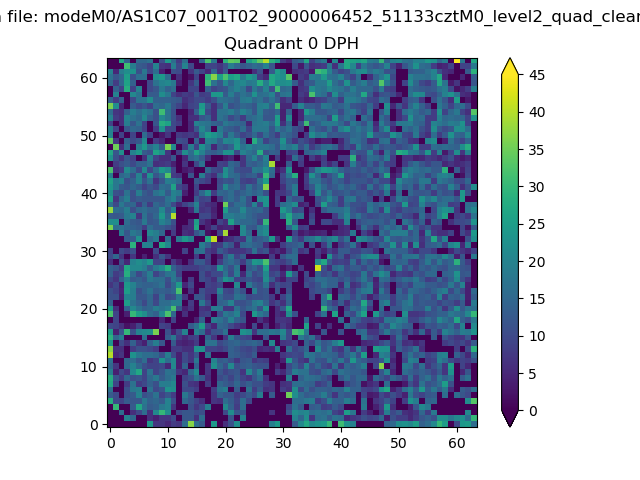 |
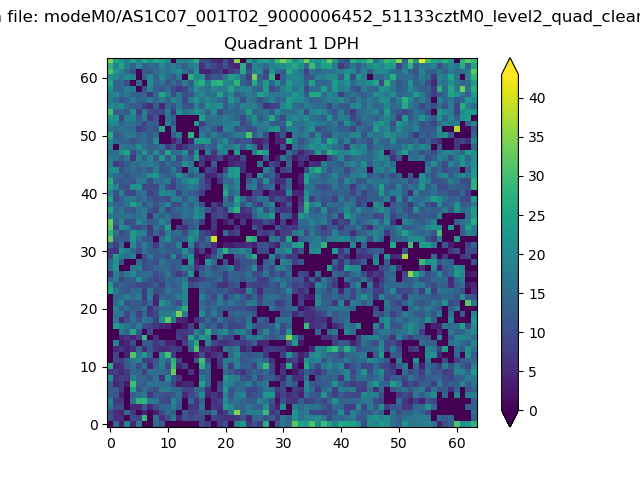 |
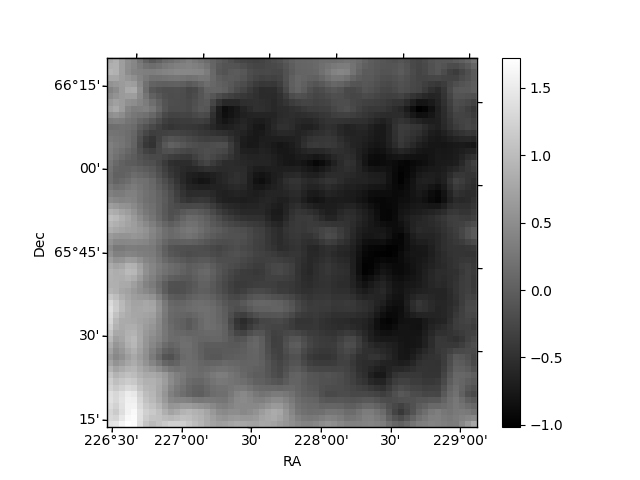
Quadrant B |
|---|---|---|---|
| Quadrant D | 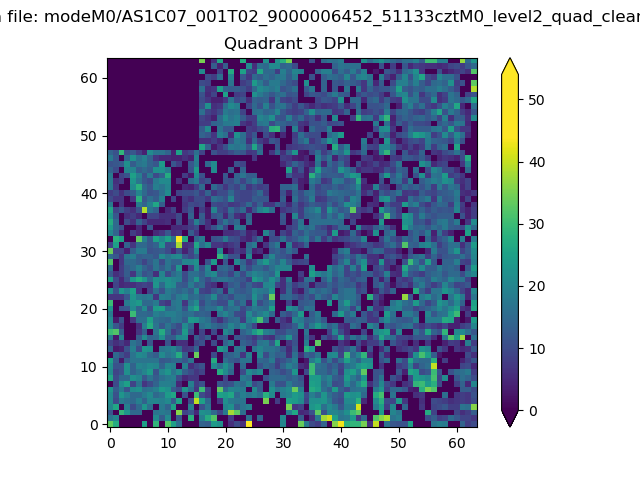 |
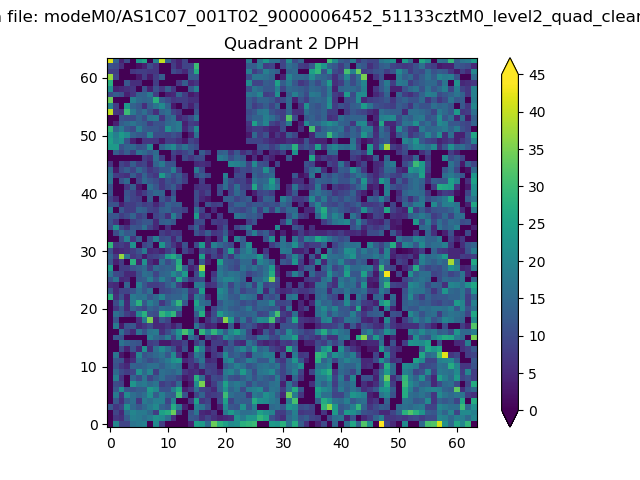 |
Quadrant C |
| Plot type | Count rate plots | Images |
|---|---|---|
| Comparison with Poisson distribution Blue bars denote a histogram of data divided into 1 sec bins. Red curve is a Poisson curve with rate = median count rate of data. |
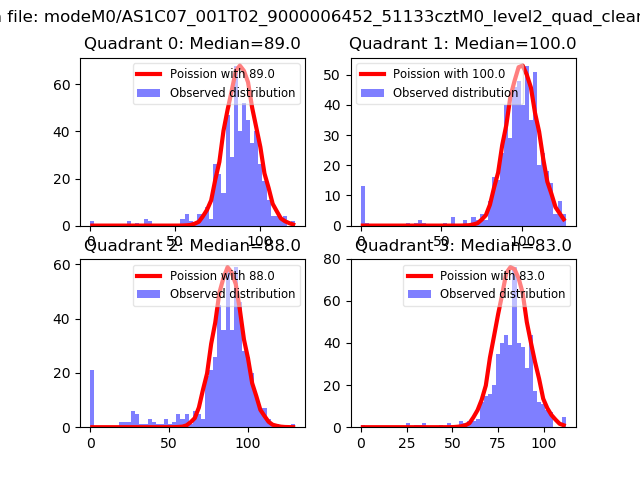 |
 |
| Quadrant-wise count rates Data is divided into 100 sec bins |
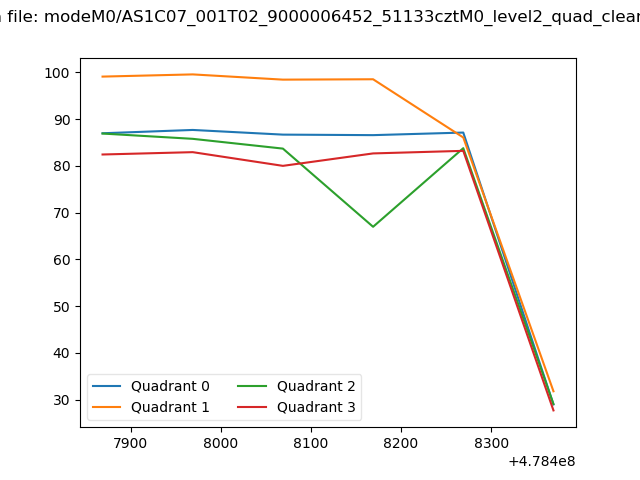 |
|
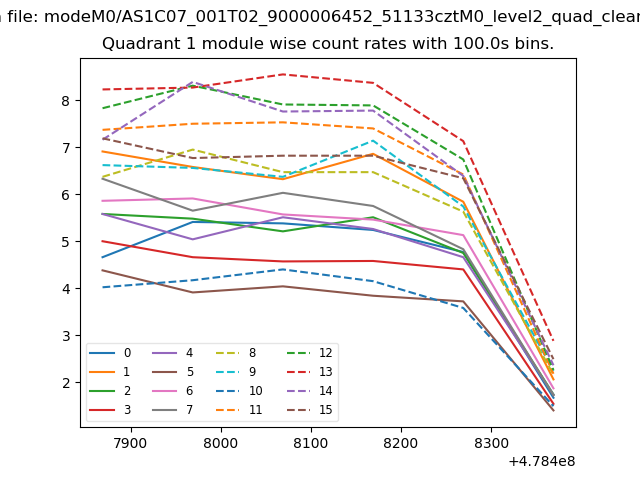
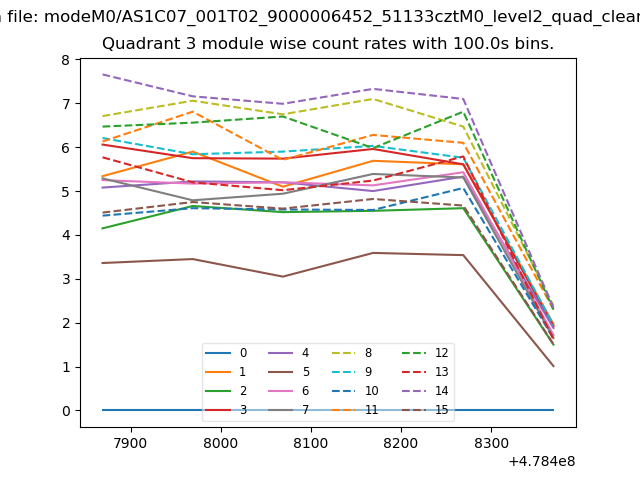
| Module-wise count rates for Quadrant A Data is divided into 100 sec bins |
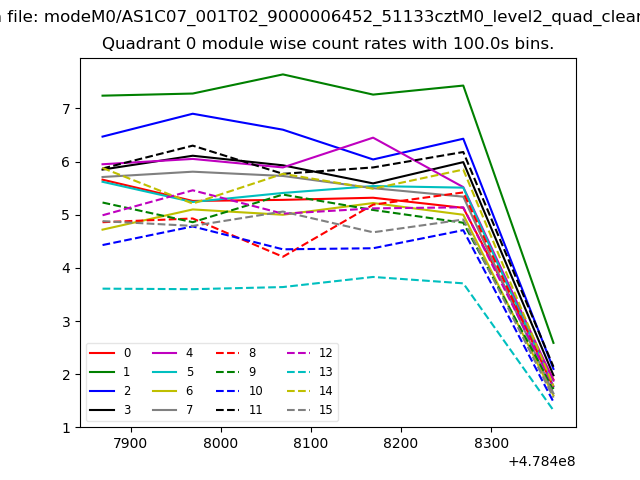 |
 |
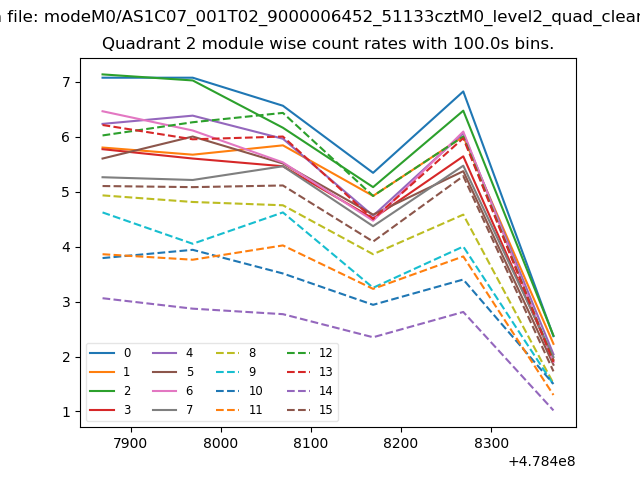
| Module-wise count rates for Quadrant B Data is divided into 100 sec bins |
 |
 |
| Module-wise count rates for Quadrant C Data is divided into 100 sec bins |
 |
 |
| Module-wise count rates for Quadrant D Data is divided into 100 sec bins |
 |
 |
| Parameter | Plot |
|---|---|
| CZT HV Monitor |  |
| D_VDD | 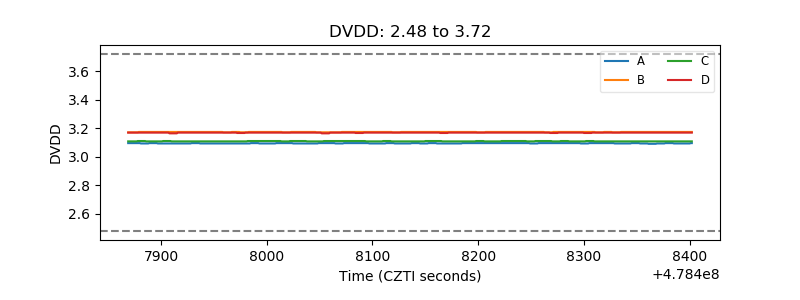 |
| Temperature 1 | 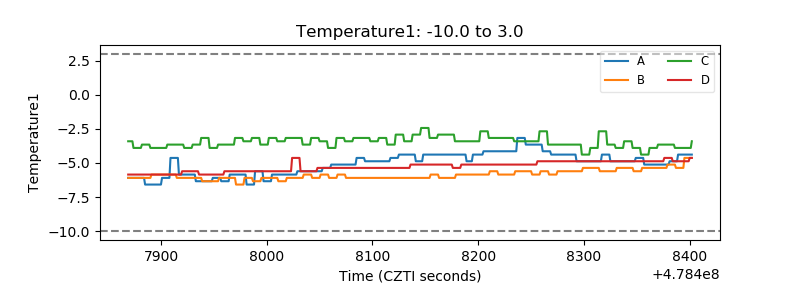 |
| Veto HV Monitor | 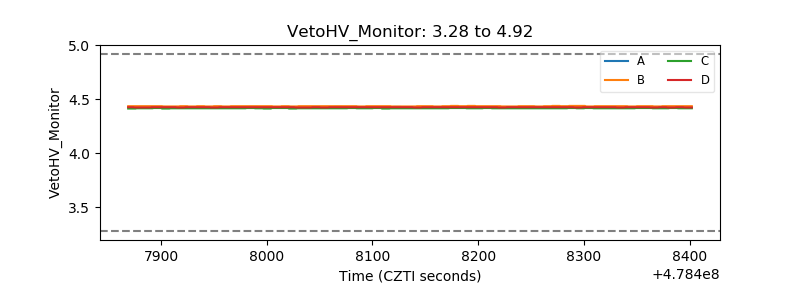 |
| Veto LLD | 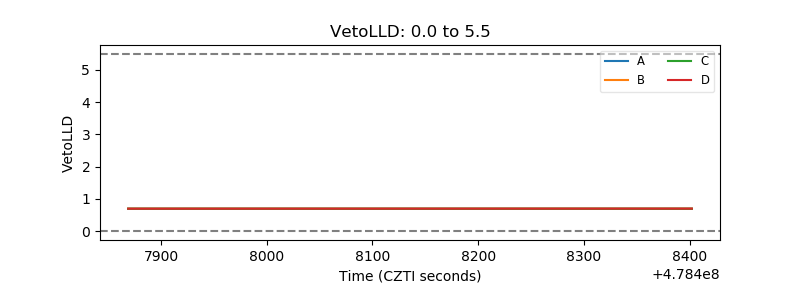 |
| Alpha Counter | 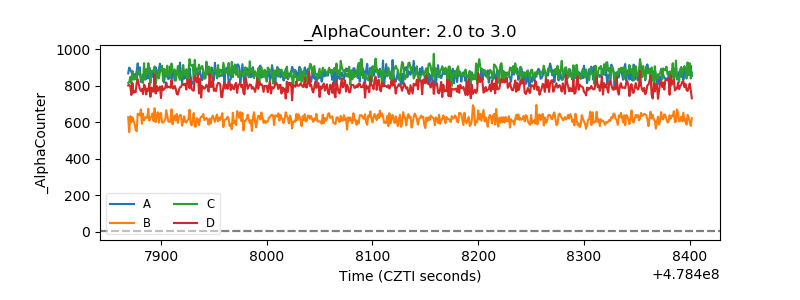 |
| _CPM_Rate | 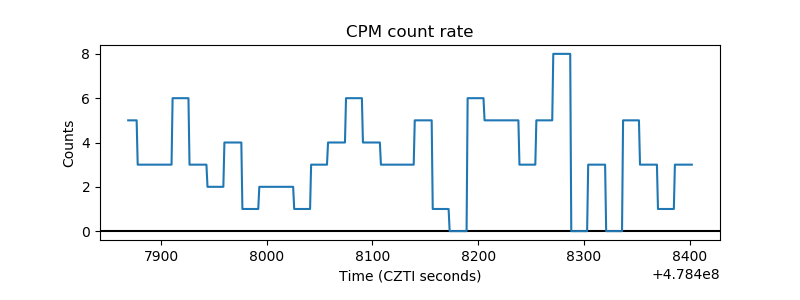 |
| CZT Counter | 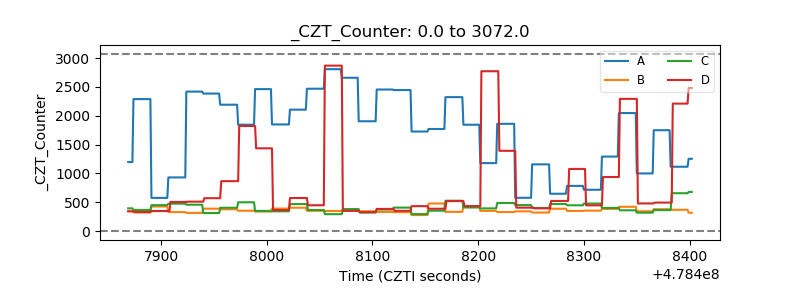 |
| +2.5 Volts monitor | 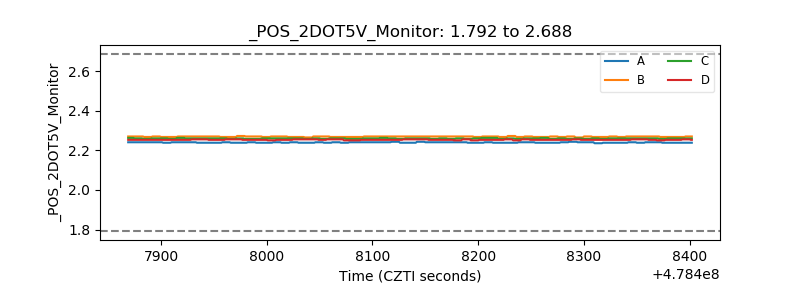 |
| +5 Volts monitor | 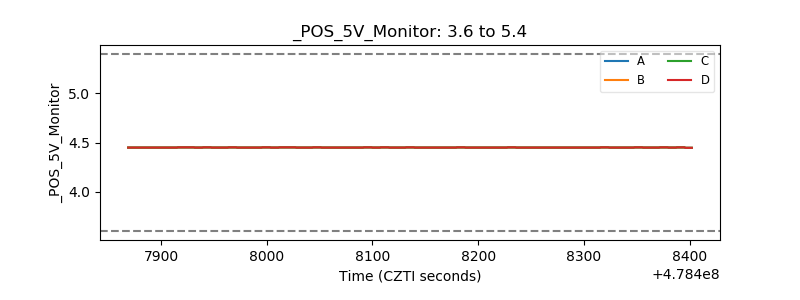 |
| _ROLL_ROT | 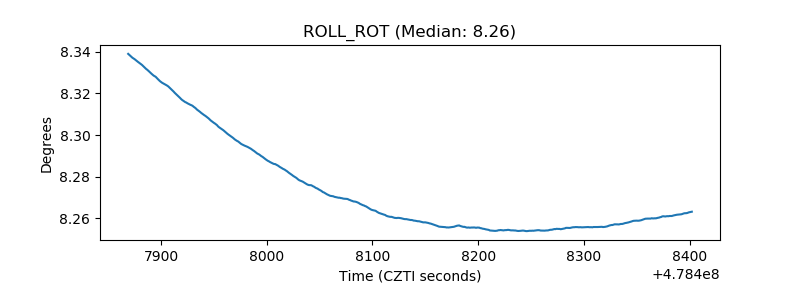 |
| _Roll_DEC | 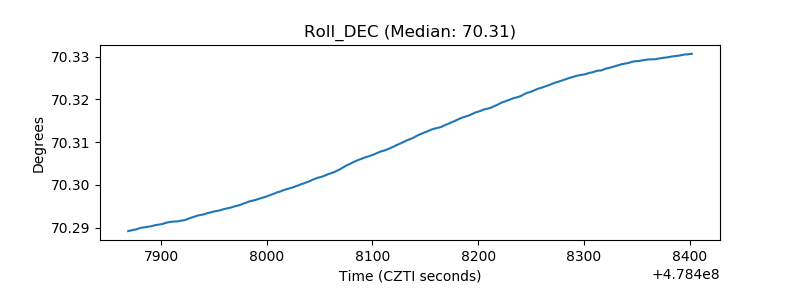 |
| _Roll_RA | 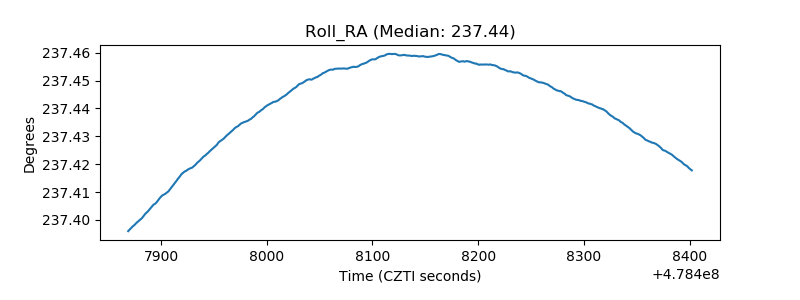 |
| Veto Counter | 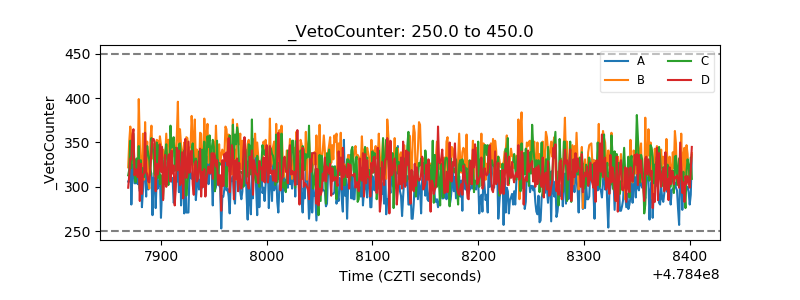 |