| Param | Original file | Final file |
|---|---|---|
| Filename | modeM0/AS1C07_001T02_9000006452_51134cztM0_level2.fits | modeM0/AS1C07_001T02_9000006452_51134cztM0_level2_quad_clean.evt |
| Size (bytes) | 574,093,440 | 82,154,880 |
| Size | 547.5 MB | 78.3 MB |
| Events in quadrant A | 5,764,042 | 540,507 |
| Events in quadrant B | 5,234,200 | 515,828 |
| Events in quadrant C | 5,318,017 | 517,706 |
| Events in quadrant D | 4,464,546 | 489,947 |
| Mode SS | |||
|---|---|---|---|
| Quadrant | BADHDUFLAG | Total packets | Discarded packets |
| A | 0 | 122 | 0 |
| B | 0 | 122 | 0 |
| C | 0 | 122 | 0 |
| D | 0 | 122 | 0 |
| Mode M9 | |||
|---|---|---|---|
| Quadrant | BADHDUFLAG | Total packets | Discarded packets |
| A | 0 | 8 | 0 |
| B | 0 | 8 | 0 |
| C | 0 | 8 | 0 |
| D | 0 | 8 | 0 |
| Mode M0 | |||
|---|---|---|---|
| Quadrant | BADHDUFLAG | Total packets | Discarded packets |
| A | 0 | 21407 | 1 |
| B | 0 | 19803 | 1 |
| C | 0 | 20105 | 1 |
| D | 0 | 17628 | 2 |
| Quadrant | Total seconds | Saturated seconds | Saturation percentage |
|---|---|---|---|
| A | 6069 | 323 | 5.322129% |
| B | 6069 | 1071 | 17.647059% |
| C | 6069 | 492 | 8.106772% |
| D | 6068 | 331 | 5.454845% |
Noise dominated data is calculated using 1-second bins in cleaned event files. If a bin has >2000 counts, and if more than 50% of those come from <1% of pixels, then it is considered to be noise-dominated and hence unusable.
| Quadrant | # 1 sec bins | Bins with >0 counts | Bins with >2000 counts | High rate bins dominated by noise | Noise dominated (total time) | Noise dominated (detector-on time) | Marked lightcurve |
|---|---|---|---|---|---|---|---|
| A | 6884 | 6070 | 173 | 173 | 2.51% | 2.85% | 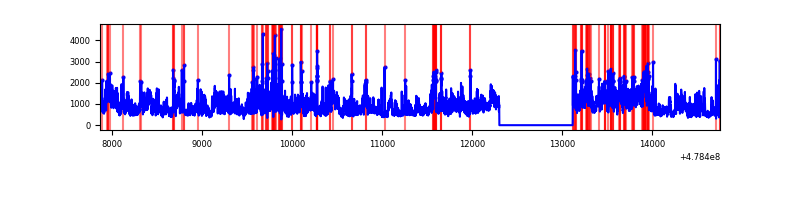 |
| B | 6884 | 6070 | 509 | 509 | 7.39% | 8.39% | 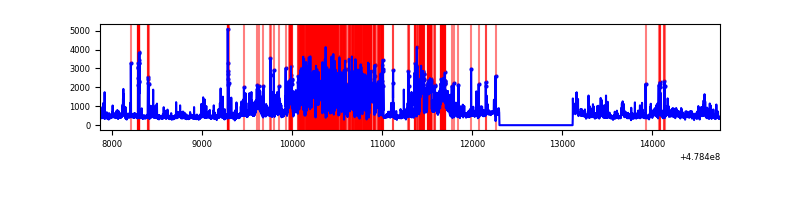 |
| C | 6884 | 6070 | 358 | 358 | 5.20% | 5.90% | 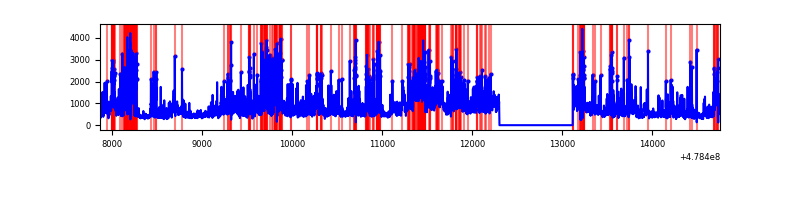 |
| D | 6883 | 6069 | 262 | 262 | 3.81% | 4.32% | 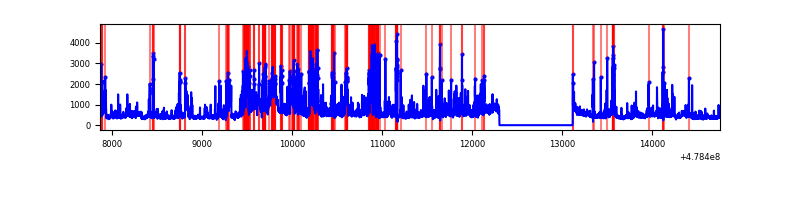 |
Top three noisy pixels from each quadrant. If the there are fewer than three noisy pixels in the level2.evt file, extra rows are filled as -1
| Pixel properties | Quadrant properties | ||||||
|---|---|---|---|---|---|---|---|
| Quadrant | DetID | PixID | Counts | Sigma | Mean | Median | Sigma |
| A | 12 | 3 | 2208447 | 14614.01 | 616 | 599 | 151.1 |
| A | 4 | 249 | 274842 | 1815.25 | 616 | 599 | 151.1 |
| A | 12 | 194 | 250740 | 1655.71 | 616 | 599 | 151.1 |
| B | 12 | 32 | 1567528 | 12991.16 | 571 | 552 | 120.6 |
| B | 5 | 185 | 362180 | 2998.11 | 571 | 552 | 120.6 |
| B | 0 | 171 | 293927 | 2432.25 | 571 | 552 | 120.6 |
| C | 4 | 12 | 893102 | 5524.8 | 590 | 584 | 161.5 |
| C | 15 | 230 | 415706 | 2569.66 | 590 | 584 | 161.5 |
| C | 3 | 242 | 376558 | 2327.33 | 590 | 584 | 161.5 |
| D | 7 | 80 | 428392 | 2541.73 | 592 | 570 | 168.3 |
| D | 8 | 176 | 270387 | 1603.01 | 592 | 570 | 168.3 |
| D | 10 | 172 | 258444 | 1532.06 | 592 | 570 | 168.3 |
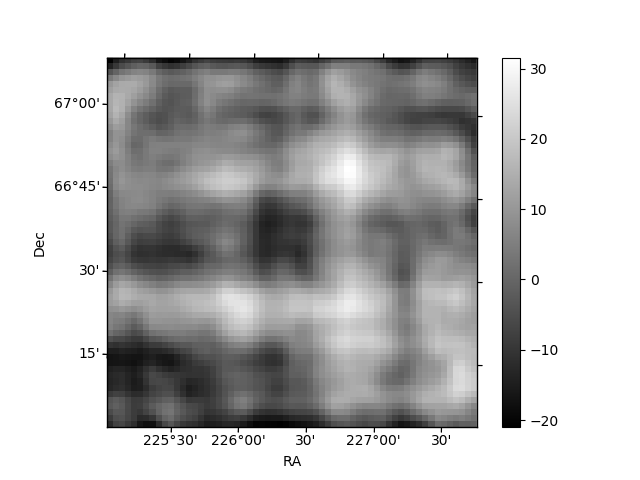
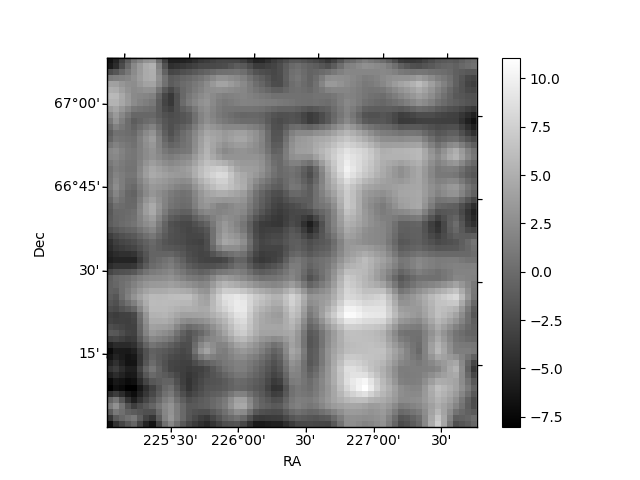
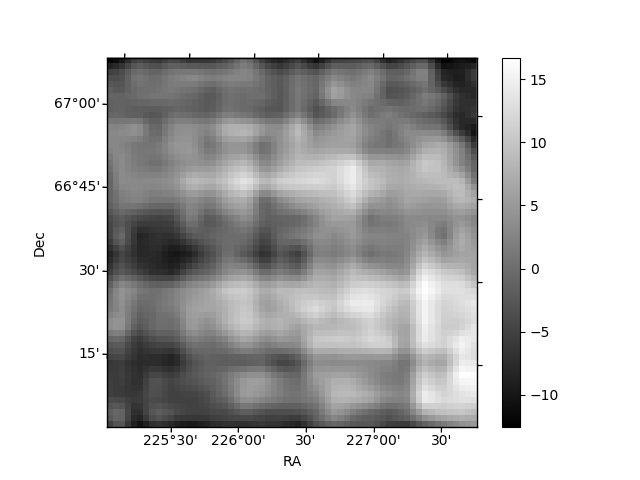
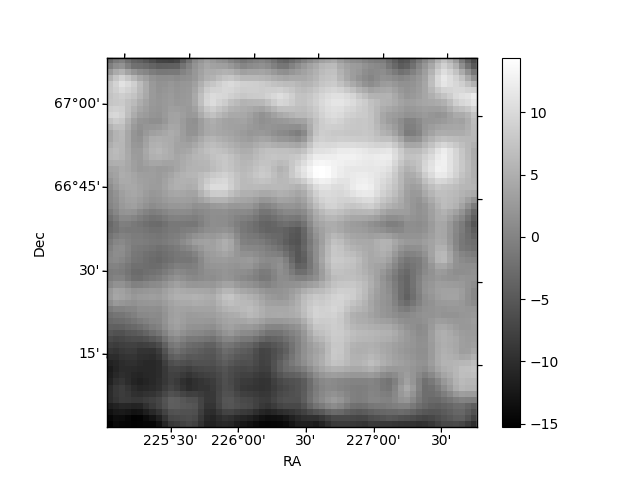
Histogram calculated using DETX and DETY for each event in the final _common_clean file
| Quadrant A | 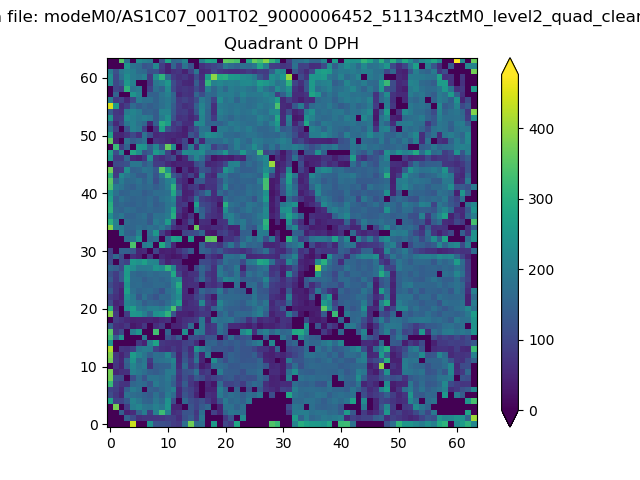 |
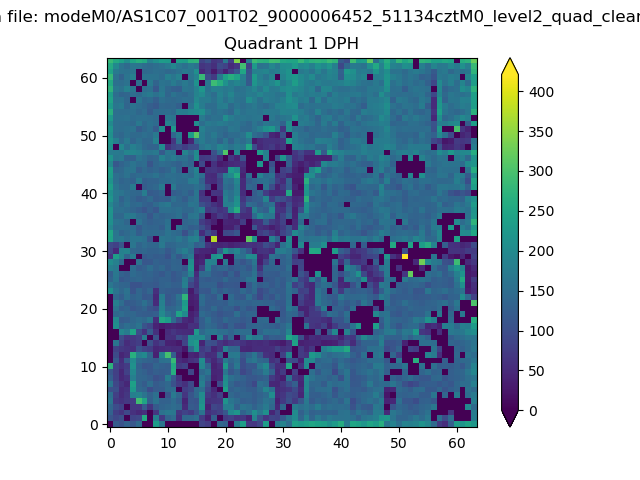 |
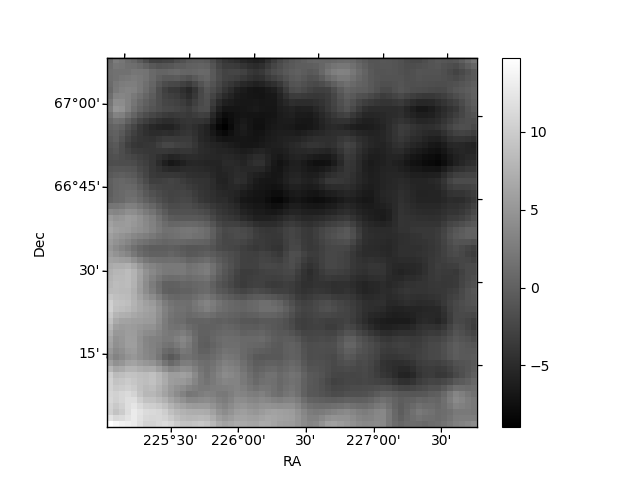
Quadrant B |
|---|---|---|---|
| Quadrant D | 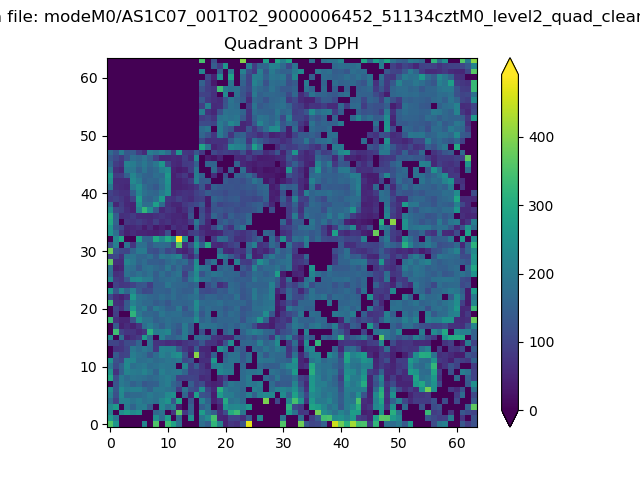 |
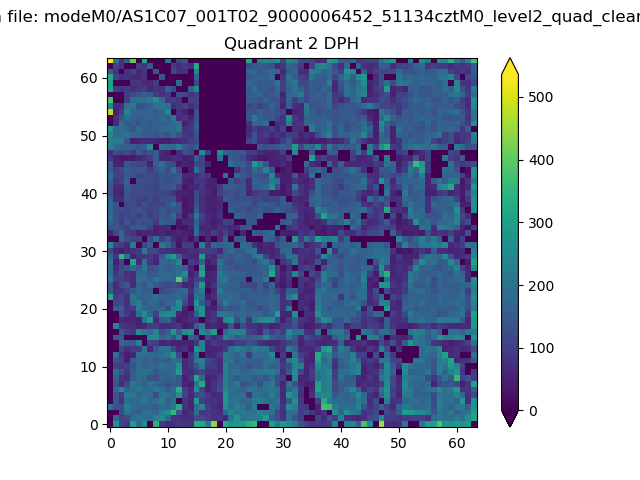 |
Quadrant C |
| Plot type | Count rate plots | Images |
|---|---|---|
| Comparison with Poisson distribution Blue bars denote a histogram of data divided into 1 sec bins. Red curve is a Poisson curve with rate = median count rate of data. |
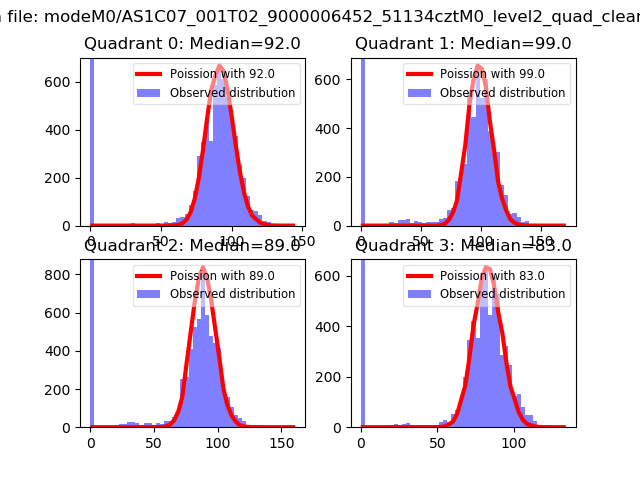 |
 |
| Quadrant-wise count rates Data is divided into 100 sec bins |
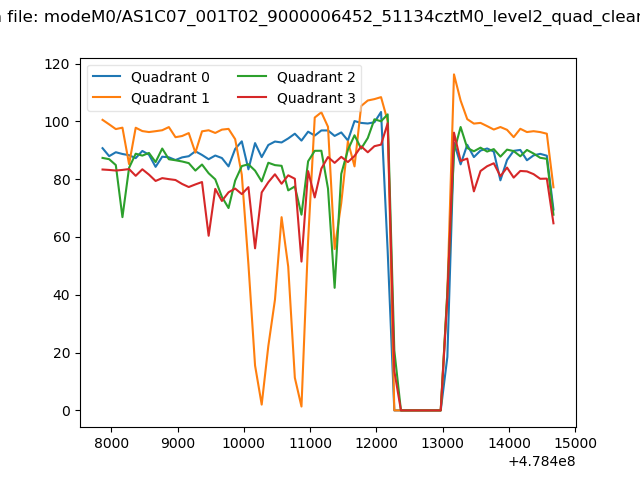 |
|
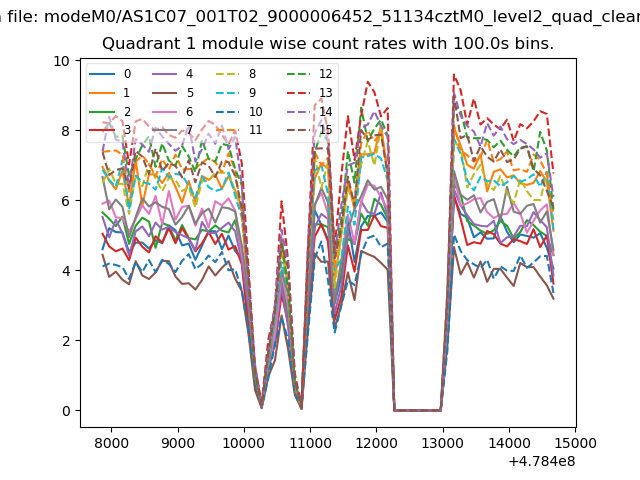
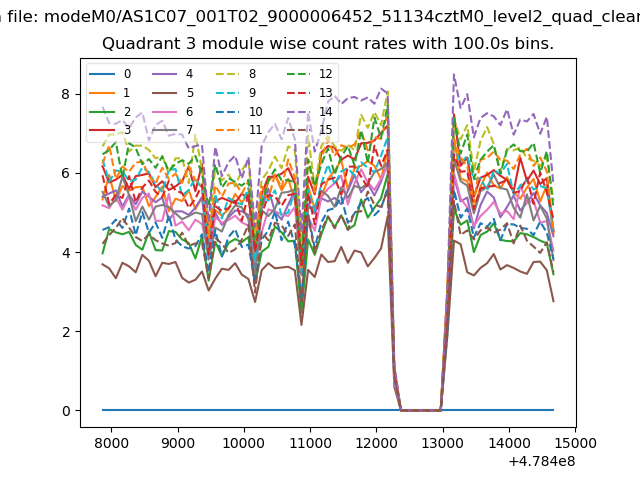
| Module-wise count rates for Quadrant A Data is divided into 100 sec bins |
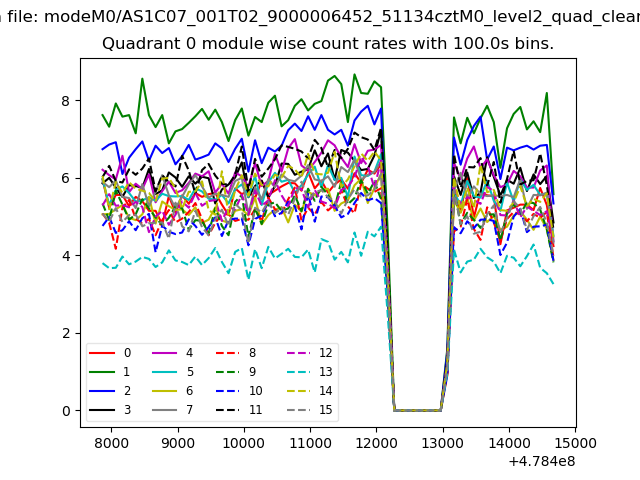 |
 |
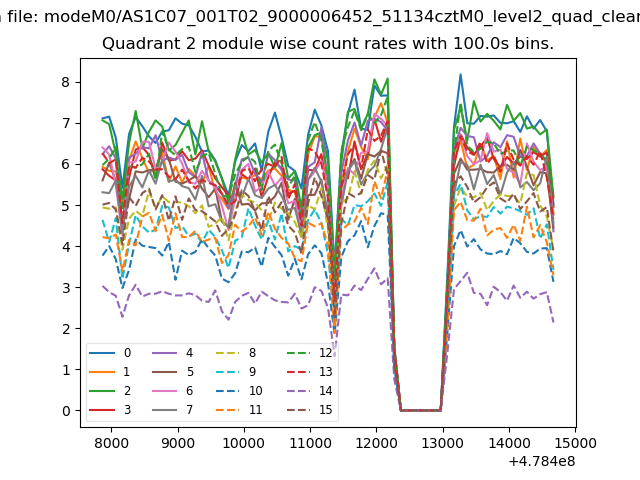
| Module-wise count rates for Quadrant B Data is divided into 100 sec bins |
 |
 |
| Module-wise count rates for Quadrant C Data is divided into 100 sec bins |
 |
 |
| Module-wise count rates for Quadrant D Data is divided into 100 sec bins |
 |
 |
| Parameter | Plot |
|---|---|
| CZT HV Monitor |  |
| D_VDD | 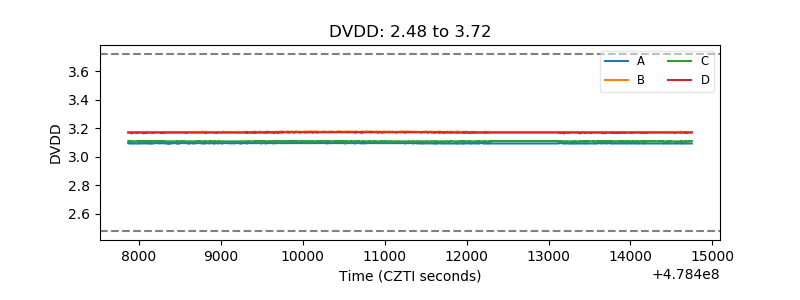 |
| Temperature 1 | 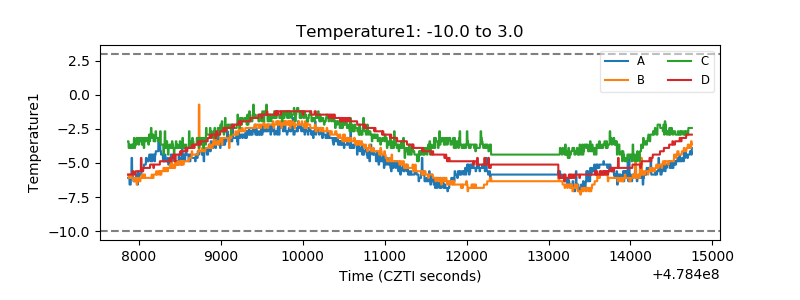 |
| Veto HV Monitor | 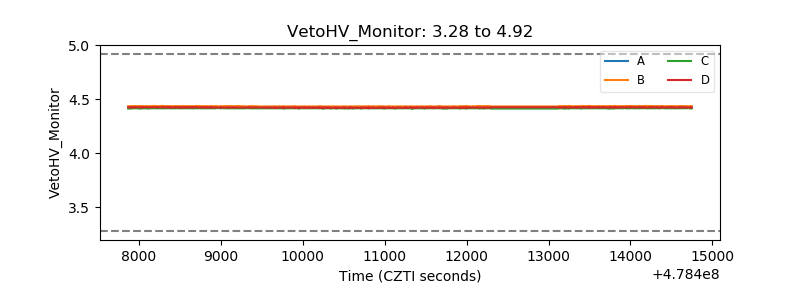 |
| Veto LLD | 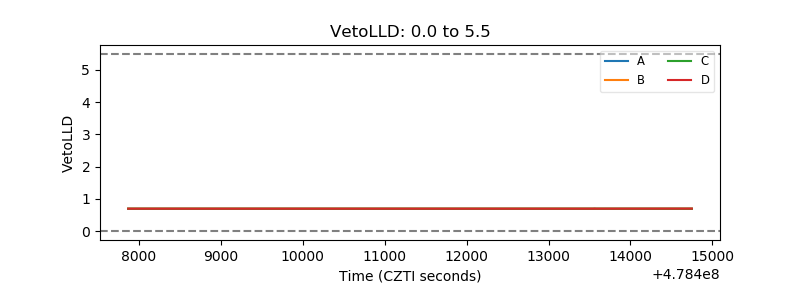 |
| Alpha Counter | 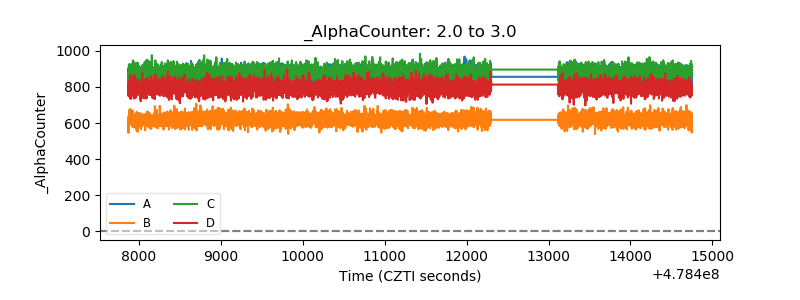 |
| _CPM_Rate | 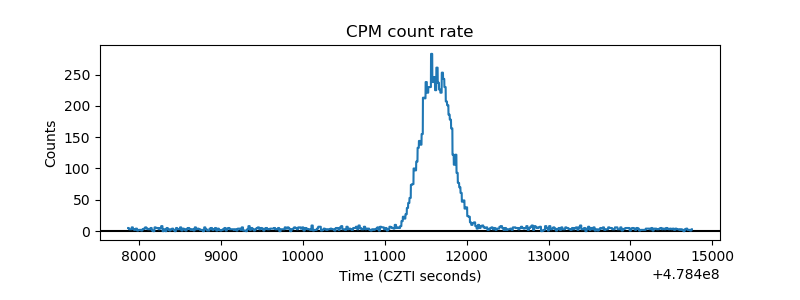 |
| CZT Counter | 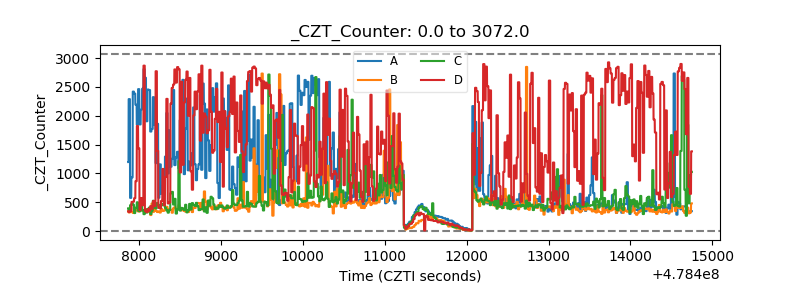 |
| +2.5 Volts monitor | 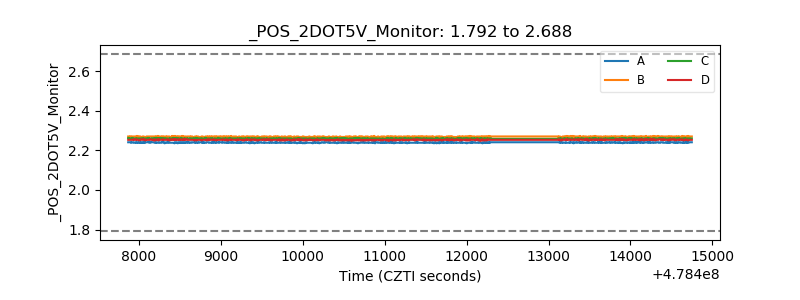 |
| +5 Volts monitor | 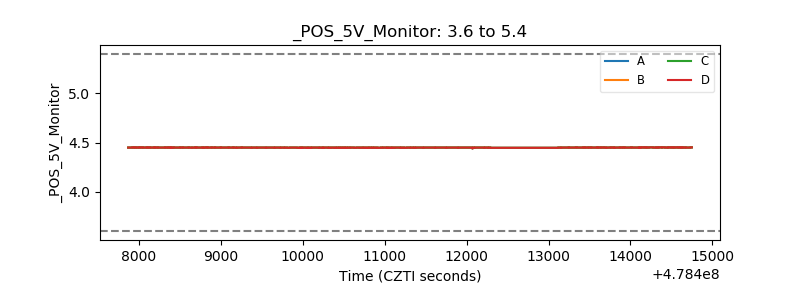 |
| _ROLL_ROT | 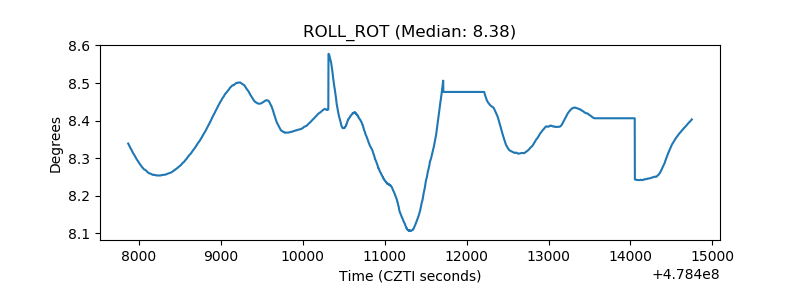 |
| _Roll_DEC | 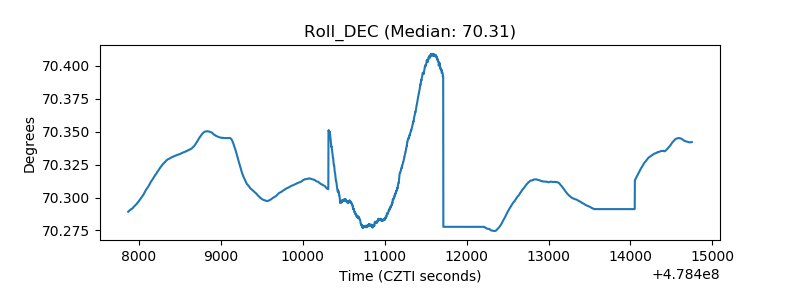 |
| _Roll_RA |  |
| Veto Counter | 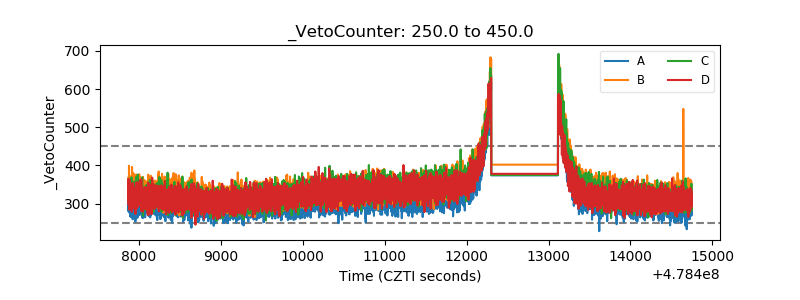 |