| Param | Original file | Final file |
|---|---|---|
| Filename | modeM0/AS1C07_001T02_9000006452_51144cztM0_level2.fits | modeM0/AS1C07_001T02_9000006452_51144cztM0_level2_quad_clean.evt |
| Size (bytes) | 664,200,000 | 92,341,440 |
| Size | 633.4 MB | 88.1 MB |
| Events in quadrant A | 6,316,479 | 605,568 |
| Events in quadrant B | 4,298,610 | 664,496 |
| Events in quadrant C | 7,323,103 | 560,707 |
| Events in quadrant D | 6,132,650 | 500,256 |
| Mode SS | |||
|---|---|---|---|
| Quadrant | BADHDUFLAG | Total packets | Discarded packets |
| A | 0 | 138 | 0 |
| B | 0 | 138 | 0 |
| C | 0 | 138 | 0 |
| D | 0 | 138 | 0 |
| Mode M9 | |||
|---|---|---|---|
| Quadrant | BADHDUFLAG | Total packets | Discarded packets |
| A | 0 | 19 | 0 |
| B | 0 | 19 | 0 |
| C | 0 | 19 | 0 |
| D | 0 | 19 | 0 |
| Mode M0 | |||
|---|---|---|---|
| Quadrant | BADHDUFLAG | Total packets | Discarded packets |
| A | 0 | 23450 | 2 |
| B | 0 | 17518 | 2 |
| C | 0 | 26467 | 2 |
| D | 0 | 23030 | 2 |
| Quadrant | Total seconds | Saturated seconds | Saturation percentage |
|---|---|---|---|
| A | 6664 | 350 | 5.252101% |
| B | 6665 | 335 | 5.026257% |
| C | 6665 | 925 | 13.878470% |
| D | 6665 | 1029 | 15.438860% |
Noise dominated data is calculated using 1-second bins in cleaned event files. If a bin has >2000 counts, and if more than 50% of those come from <1% of pixels, then it is considered to be noise-dominated and hence unusable.
| Quadrant | # 1 sec bins | Bins with >0 counts | Bins with >2000 counts | High rate bins dominated by noise | Noise dominated (total time) | Noise dominated (detector-on time) | Marked lightcurve |
|---|---|---|---|---|---|---|---|
| A | 8584 | 6666 | 356 | 356 | 4.15% | 5.34% | 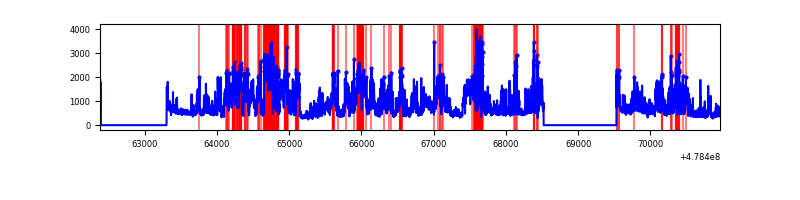 |
| B | 8585 | 6667 | 187 | 187 | 2.18% | 2.80% | 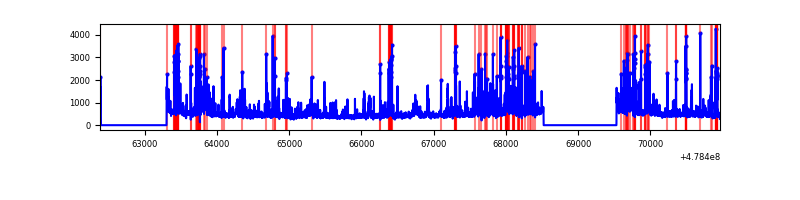 |
| C | 8585 | 6667 | 811 | 811 | 9.45% | 12.16% | 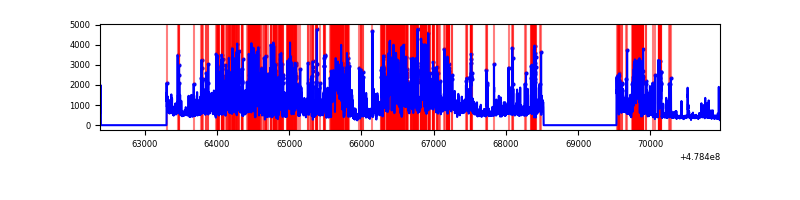 |
| D | 8585 | 6667 | 956 | 956 | 11.14% | 14.34% | 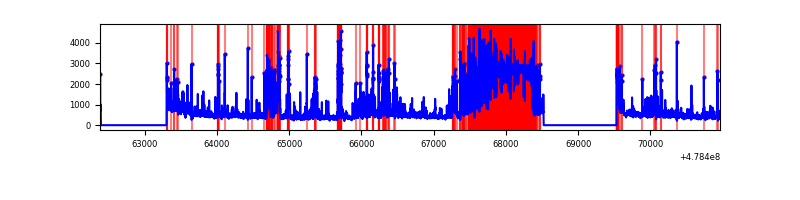 |
Top three noisy pixels from each quadrant. If the there are fewer than three noisy pixels in the level2.evt file, extra rows are filled as -1
| Pixel properties | Quadrant properties | ||||||
|---|---|---|---|---|---|---|---|
| Quadrant | DetID | PixID | Counts | Sigma | Mean | Median | Sigma |
| A | 12 | 80 | 1931984 | 11482.16 | 683 | 665 | 168.2 |
| A | 12 | 3 | 870693 | 5172.52 | 683 | 665 | 168.2 |
| A | 13 | 248 | 176750 | 1046.87 | 683 | 665 | 168.2 |
| B | 5 | 185 | 424004 | 2867.04 | 686 | 662 | 147.7 |
| B | 0 | 213 | 256349 | 1731.61 | 686 | 662 | 147.7 |
| B | 8 | 128 | 239385 | 1616.73 | 686 | 662 | 147.7 |
| C | 10 | 171 | 2152955 | 11941.4 | 654 | 649 | 180.2 |
| C | 15 | 230 | 1380612 | 7656.29 | 654 | 649 | 180.2 |
| C | 4 | 12 | 326954 | 1810.4 | 654 | 649 | 180.2 |
| D | 2 | 62 | 2187110 | 12676.99 | 612 | 591 | 172.5 |
| D | 3 | 12 | 490055 | 2837.81 | 612 | 591 | 172.5 |
| D | 8 | 176 | 371958 | 2153.11 | 612 | 591 | 172.5 |
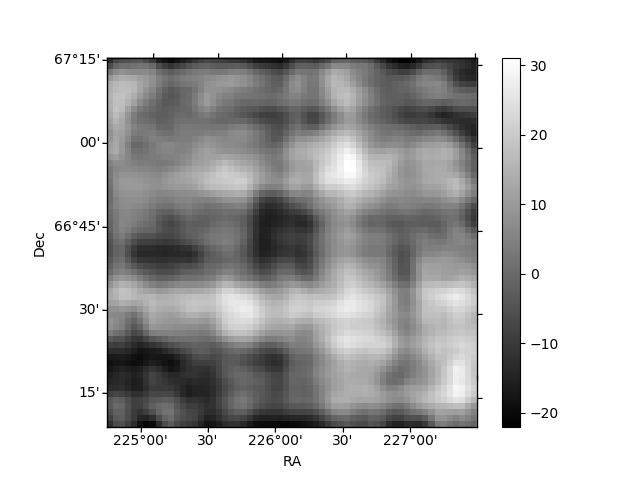
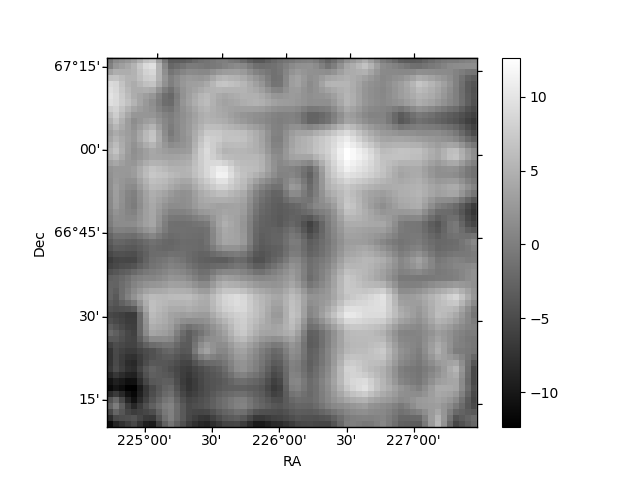
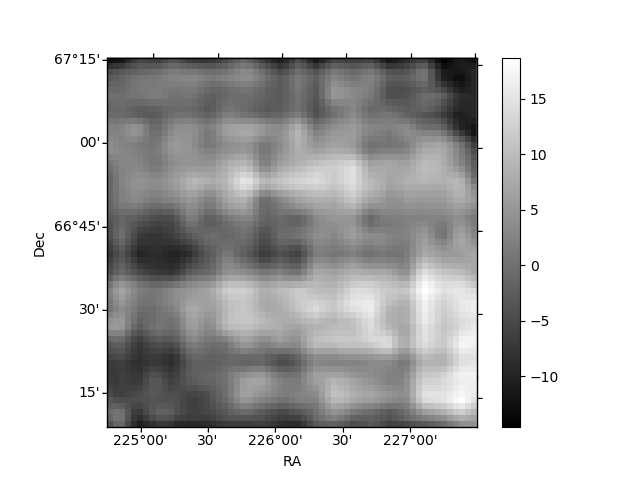
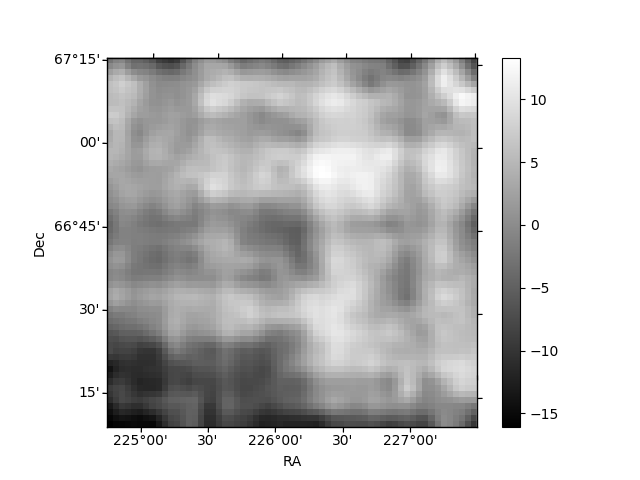
Histogram calculated using DETX and DETY for each event in the final _common_clean file
| Quadrant A | 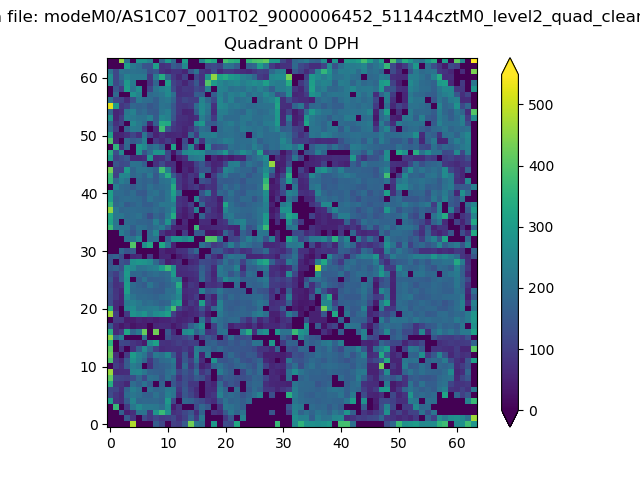 |
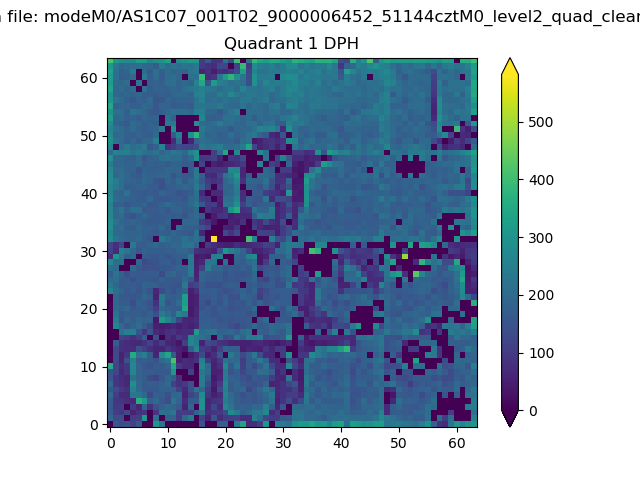 |
Quadrant B |
|---|---|---|---|
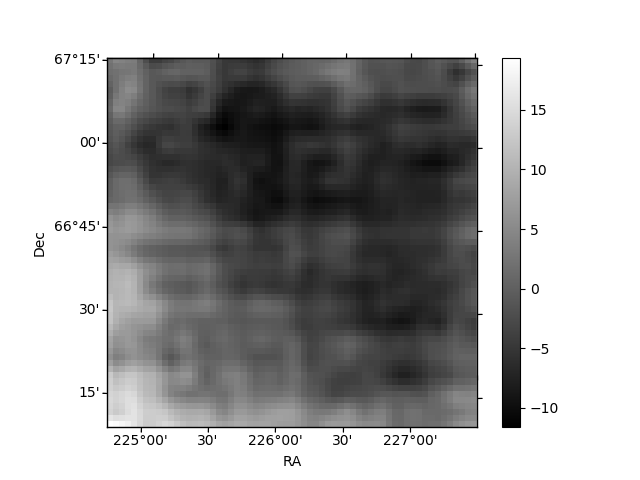
| Quadrant D | 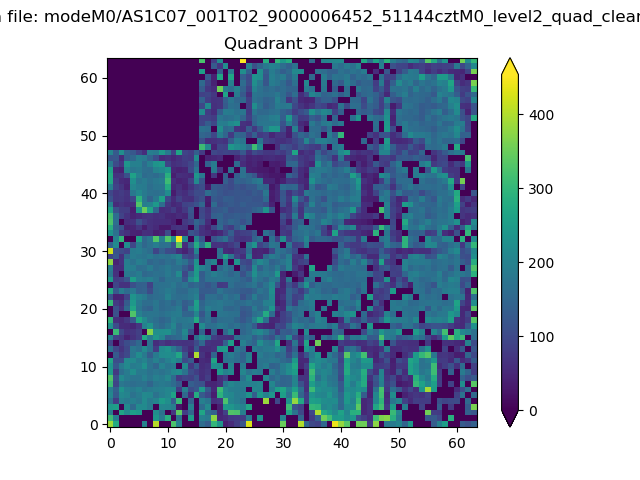 |
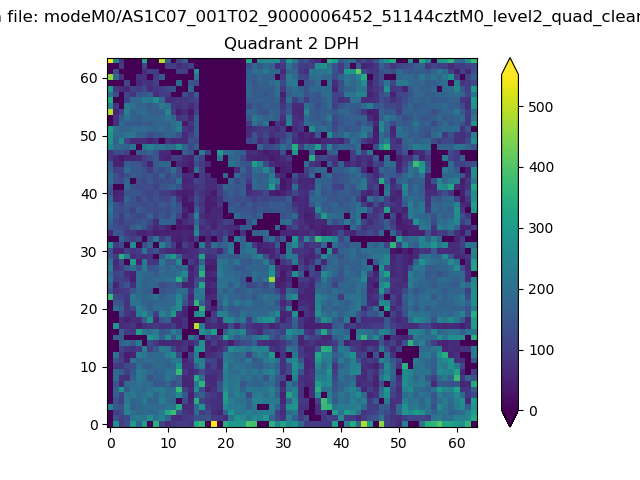 |
Quadrant C |
| Plot type | Count rate plots | Images |
|---|---|---|
| Comparison with Poisson distribution Blue bars denote a histogram of data divided into 1 sec bins. Red curve is a Poisson curve with rate = median count rate of data. |
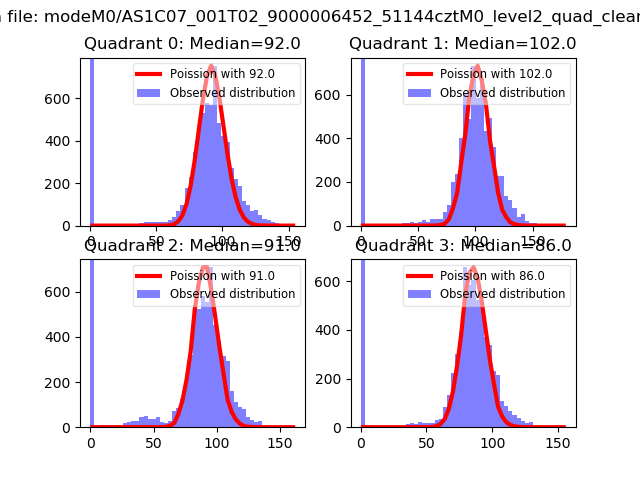 |
 |
| Quadrant-wise count rates Data is divided into 100 sec bins |
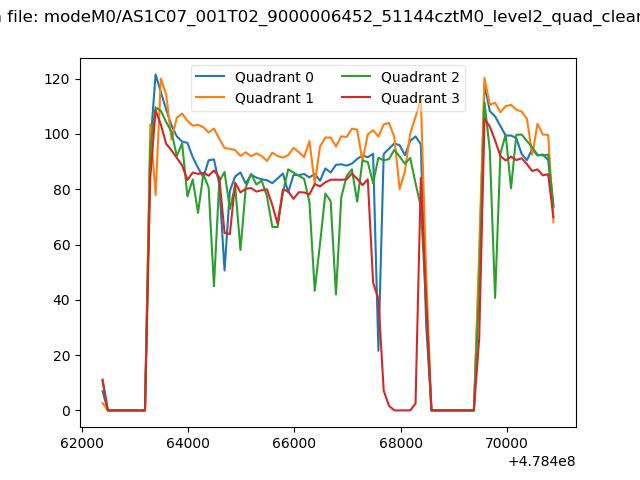 |
|
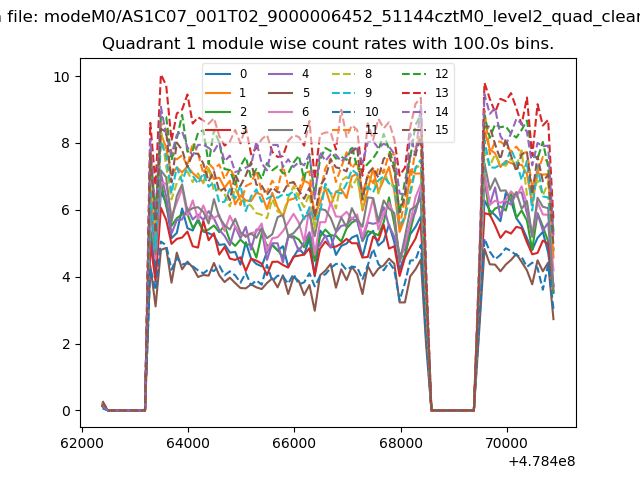
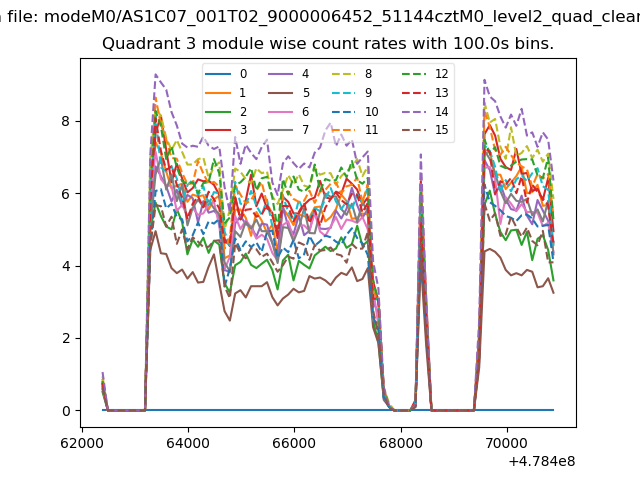
| Module-wise count rates for Quadrant A Data is divided into 100 sec bins |
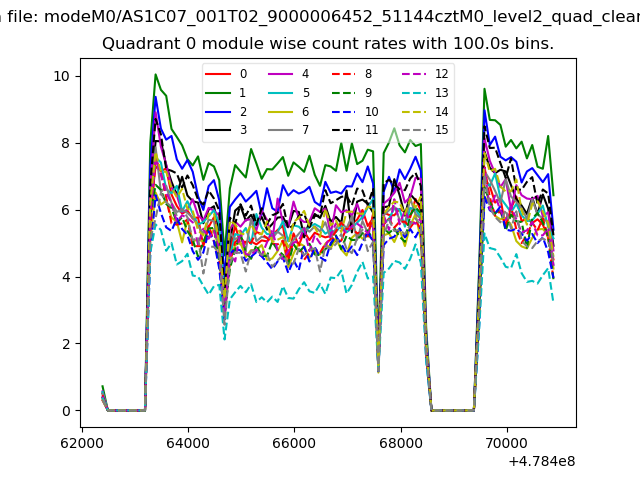 |
 |
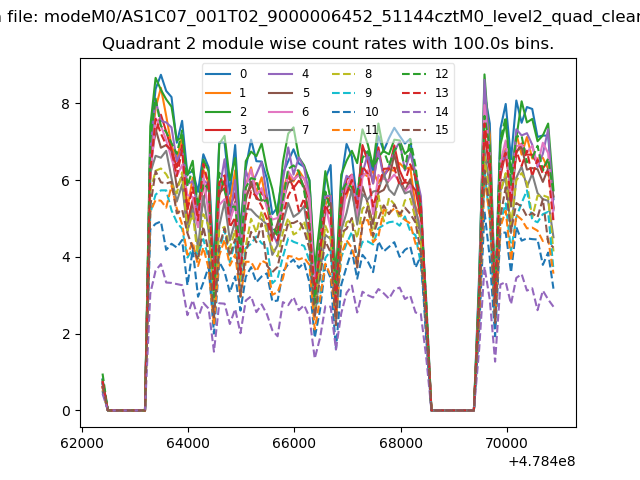
| Module-wise count rates for Quadrant B Data is divided into 100 sec bins |
 |
 |
| Module-wise count rates for Quadrant C Data is divided into 100 sec bins |
 |
 |
| Module-wise count rates for Quadrant D Data is divided into 100 sec bins |
 |
 |
| Parameter | Plot |
|---|---|
| CZT HV Monitor | 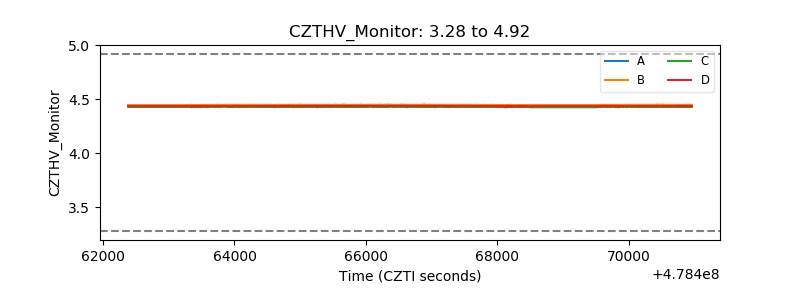 |
| D_VDD | 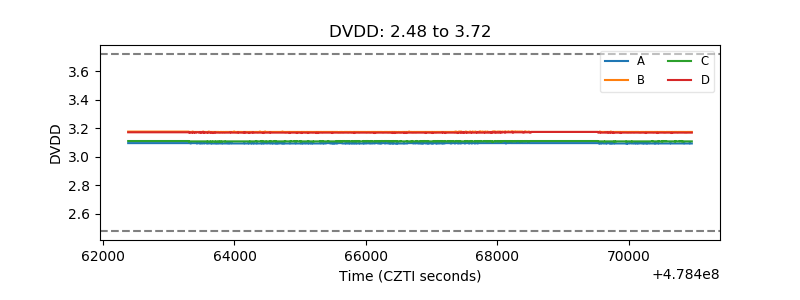 |
| Temperature 1 | 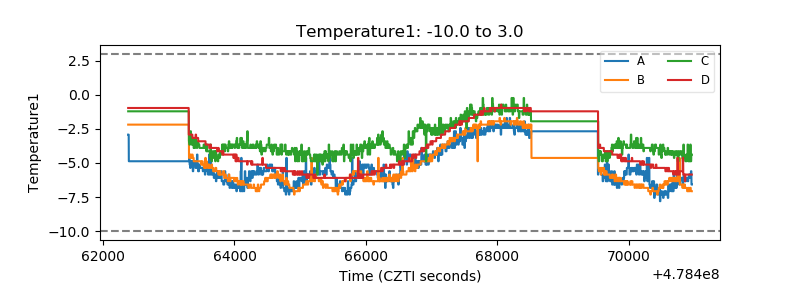 |
| Veto HV Monitor | 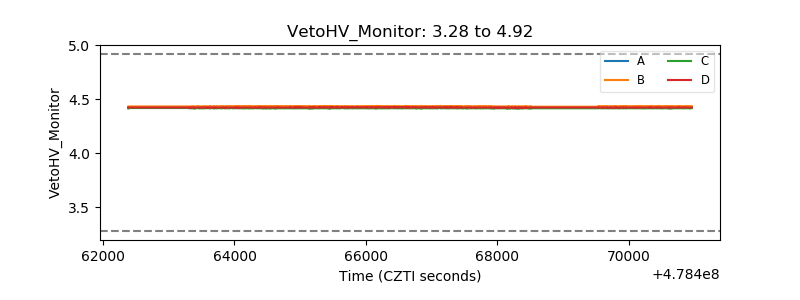 |
| Veto LLD | 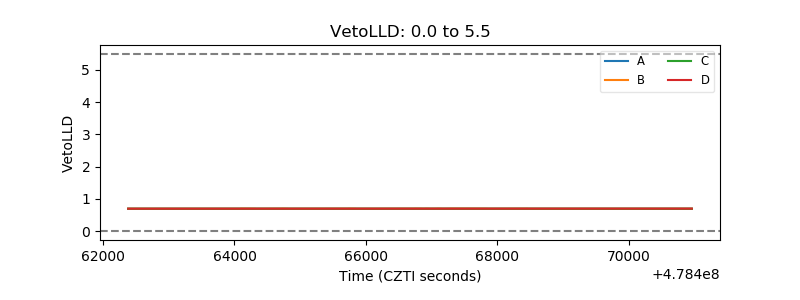 |
| Alpha Counter | 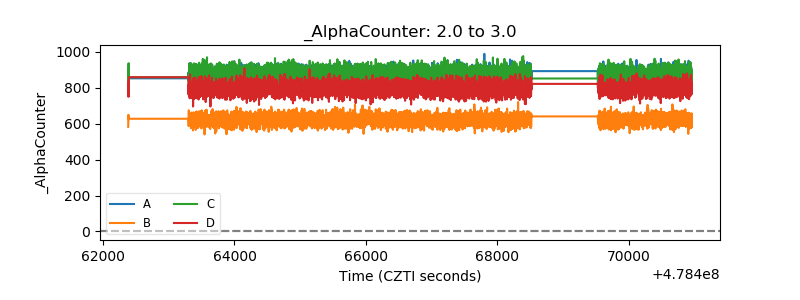 |
| _CPM_Rate | 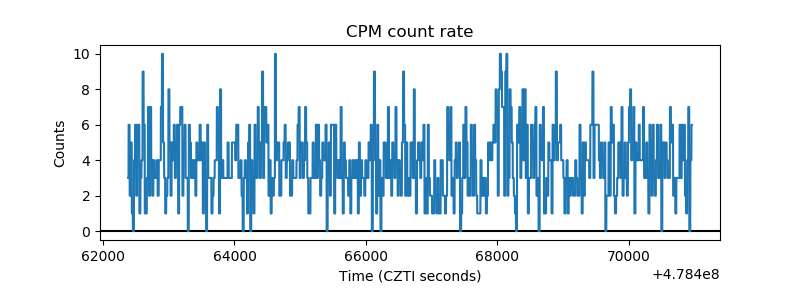 |
| CZT Counter | 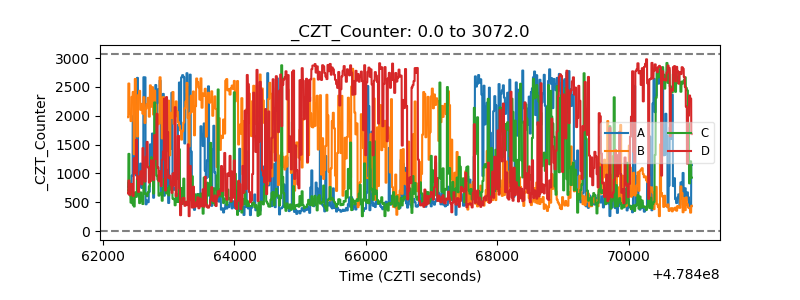 |
| +2.5 Volts monitor | 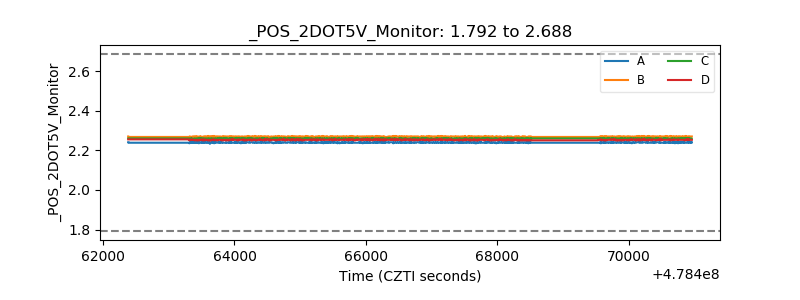 |
| +5 Volts monitor | 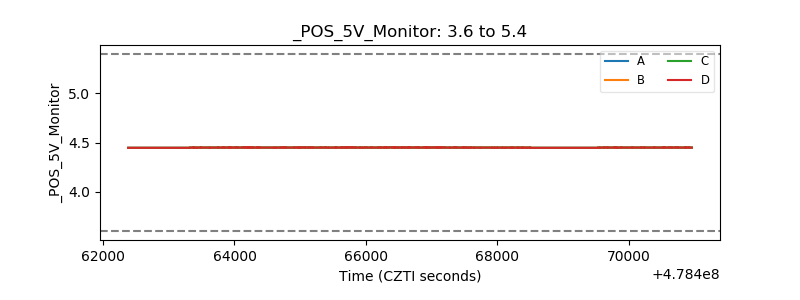 |
| _ROLL_ROT | 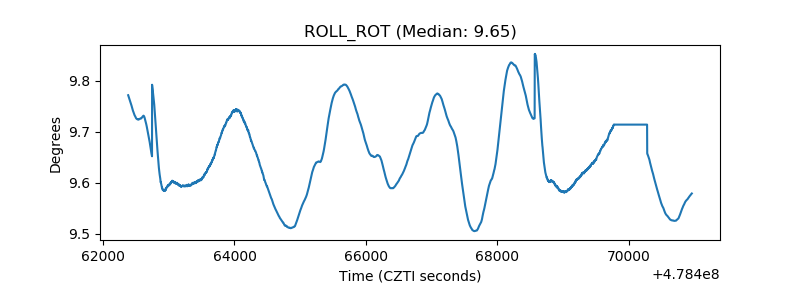 |
| _Roll_DEC | 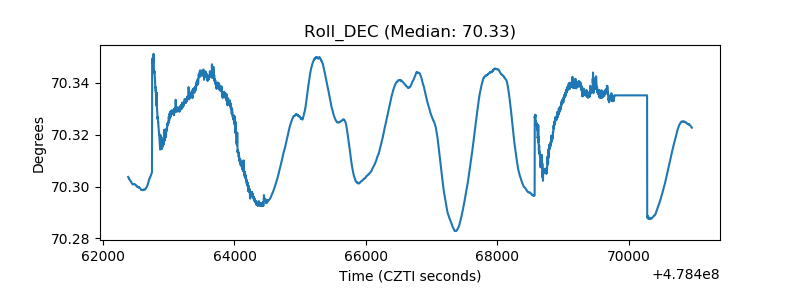 |
| _Roll_RA | 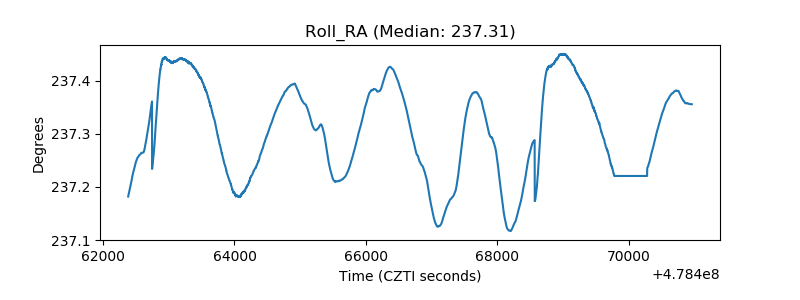 |
| Veto Counter | 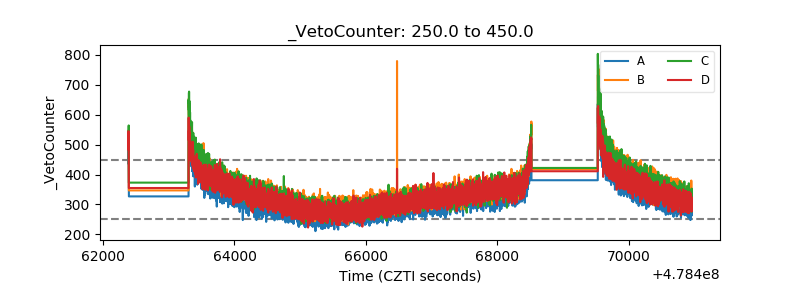 |