| Param | Original file | Final file |
|---|---|---|
| Filename | modeM0/AS1C07_001T02_9000006452_51145cztM0_level2.fits | modeM0/AS1C07_001T02_9000006452_51145cztM0_level2_quad_clean.evt |
| Size (bytes) | 580,867,200 | 97,600,320 |
| Size | 554.0 MB | 93.1 MB |
| Events in quadrant A | 5,969,975 | 626,217 |
| Events in quadrant B | 3,909,813 | 704,107 |
| Events in quadrant C | 6,805,319 | 569,177 |
| Events in quadrant D | 4,286,209 | 578,452 |
| Mode SS | |||
|---|---|---|---|
| Quadrant | BADHDUFLAG | Total packets | Discarded packets |
| A | 0 | 140 | 0 |
| B | 0 | 140 | 0 |
| C | 0 | 140 | 0 |
| D | 0 | 140 | 0 |
| Mode M9 | |||
|---|---|---|---|
| Quadrant | BADHDUFLAG | Total packets | Discarded packets |
| A | 0 | 12 | 0 |
| B | 0 | 13 | 0 |
| C | 0 | 13 | 0 |
| D | 0 | 13 | 0 |
| Mode M0 | |||
|---|---|---|---|
| Quadrant | BADHDUFLAG | Total packets | Discarded packets |
| A | 0 | 22574 | 2 |
| B | 0 | 16531 | 2 |
| C | 0 | 25075 | 2 |
| D | 0 | 17670 | 2 |
| Quadrant | Total seconds | Saturated seconds | Saturation percentage |
|---|---|---|---|
| A | 6845 | 368 | 5.376187% |
| B | 6845 | 207 | 3.024105% |
| C | 6845 | 957 | 13.981008% |
| D | 6845 | 276 | 4.032140% |
Noise dominated data is calculated using 1-second bins in cleaned event files. If a bin has >2000 counts, and if more than 50% of those come from <1% of pixels, then it is considered to be noise-dominated and hence unusable.
| Quadrant | # 1 sec bins | Bins with >0 counts | Bins with >2000 counts | High rate bins dominated by noise | Noise dominated (total time) | Noise dominated (detector-on time) | Marked lightcurve |
|---|---|---|---|---|---|---|---|
| A | 7940 | 6846 | 306 | 306 | 3.85% | 4.47% | 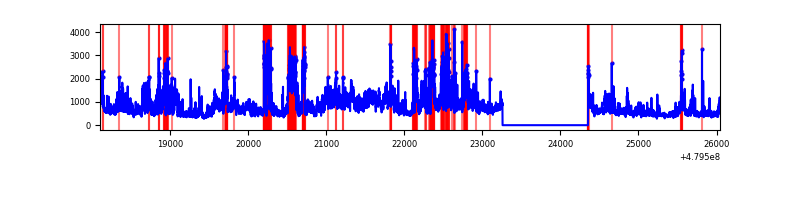 |
| B | 7940 | 6846 | 111 | 111 | 1.40% | 1.62% | 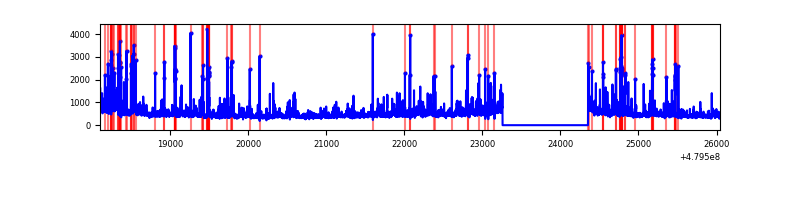 |
| C | 7940 | 6846 | 789 | 789 | 9.94% | 11.52% | 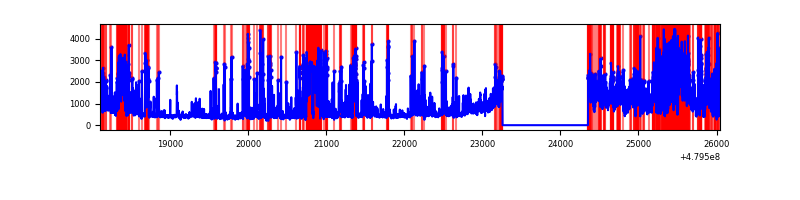 |
| D | 7940 | 6846 | 264 | 264 | 3.32% | 3.86% | 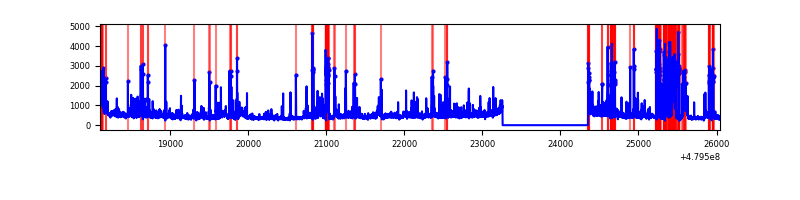 |
Top three noisy pixels from each quadrant. If the there are fewer than three noisy pixels in the level2.evt file, extra rows are filled as -1
| Pixel properties | Quadrant properties | ||||||
|---|---|---|---|---|---|---|---|
| Quadrant | DetID | PixID | Counts | Sigma | Mean | Median | Sigma |
| A | 12 | 3 | 971639 | 5652.62 | 695 | 677 | 171.8 |
| A | 4 | 4 | 627055 | 3646.57 | 695 | 677 | 171.8 |
| A | 12 | 80 | 380476 | 2211.06 | 695 | 677 | 171.8 |
| B | 5 | 185 | 266827 | 1772.48 | 709 | 685 | 150.2 |
| B | 10 | 247 | 135923 | 900.67 | 709 | 685 | 150.2 |
| B | 0 | 213 | 105910 | 700.79 | 709 | 685 | 150.2 |
| C | 12 | 247 | 1458499 | 8031.68 | 660 | 655 | 181.5 |
| C | 4 | 12 | 639353 | 3518.77 | 660 | 655 | 181.5 |
| C | 1 | 60 | 541574 | 2980.08 | 660 | 655 | 181.5 |
| D | 2 | 62 | 514997 | 2739.64 | 674 | 650 | 187.7 |
| D | 8 | 176 | 272312 | 1446.99 | 674 | 650 | 187.7 |
| D | 10 | 172 | 182781 | 970.11 | 674 | 650 | 187.7 |
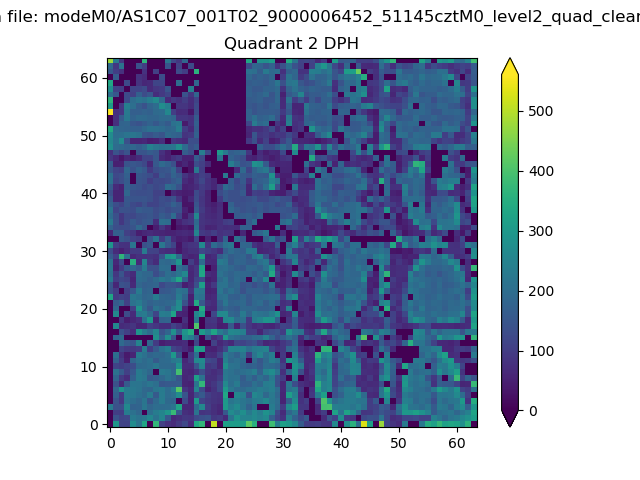
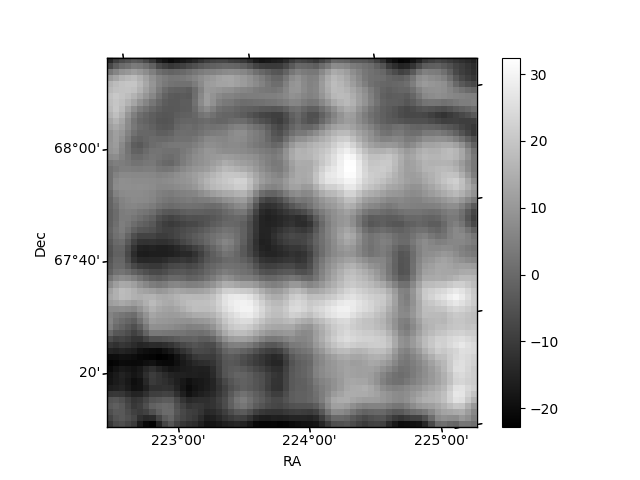
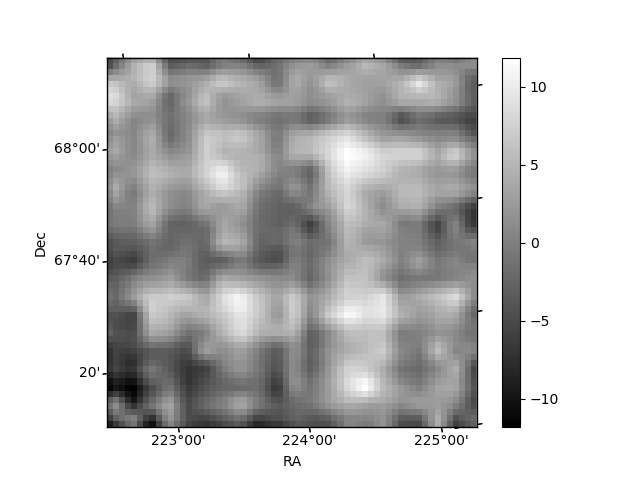
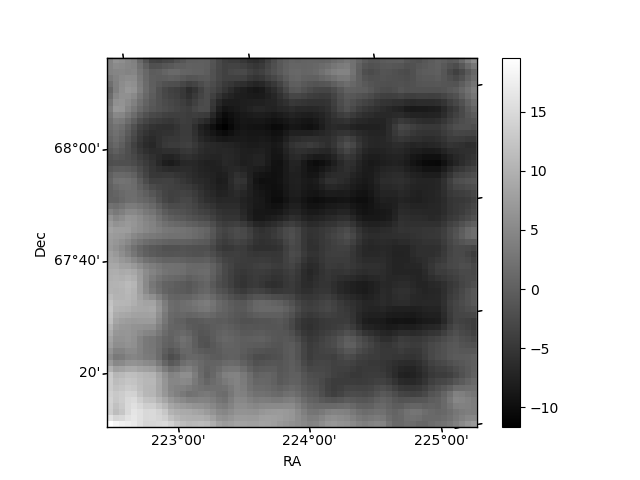
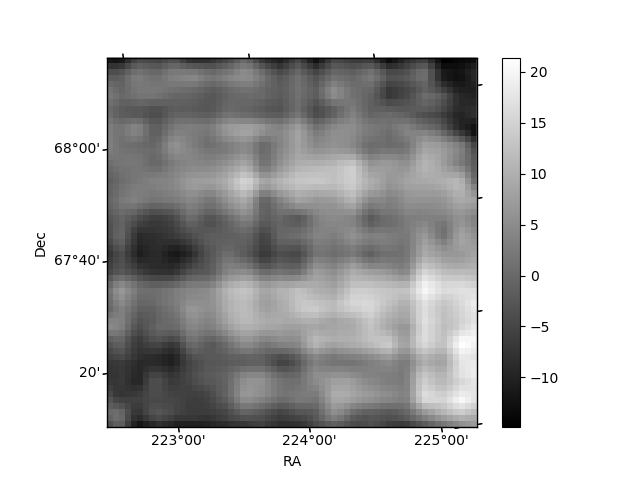
Histogram calculated using DETX and DETY for each event in the final _common_clean file
| Quadrant A | 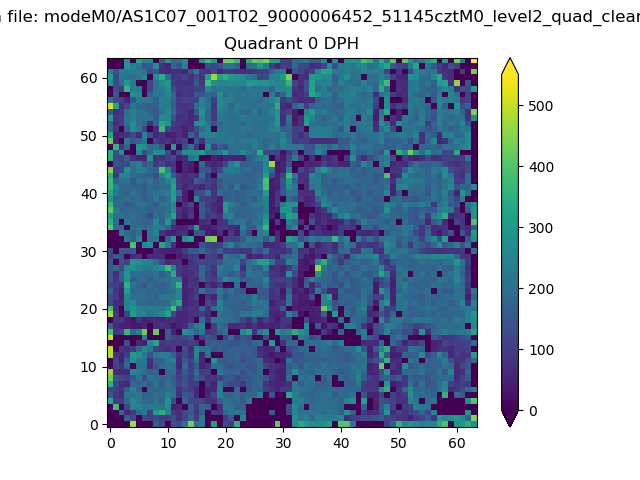 |
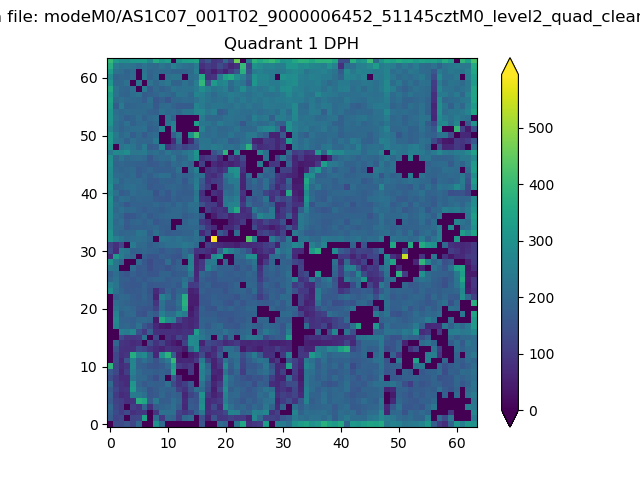 |
Quadrant B |
|---|---|---|---|
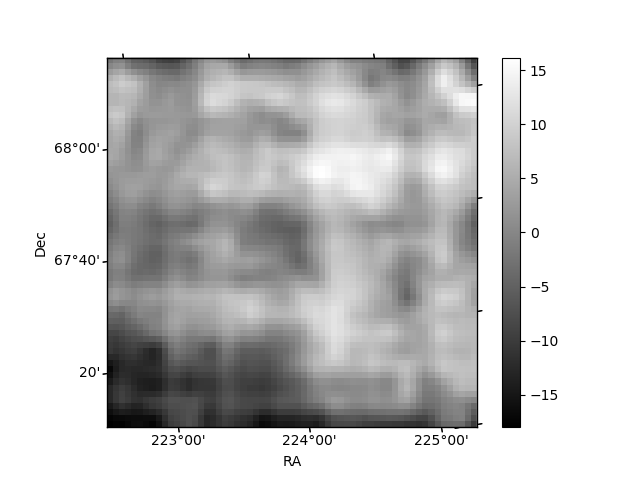
| Quadrant D | 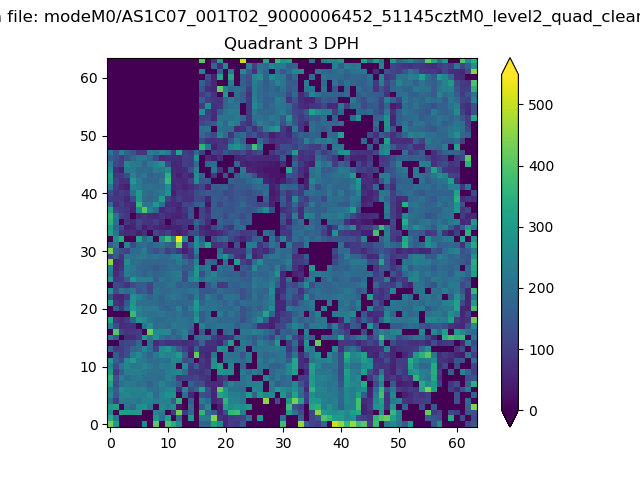 |
 |
Quadrant C |
| Plot type | Count rate plots | Images |
|---|---|---|
| Comparison with Poisson distribution Blue bars denote a histogram of data divided into 1 sec bins. Red curve is a Poisson curve with rate = median count rate of data. |
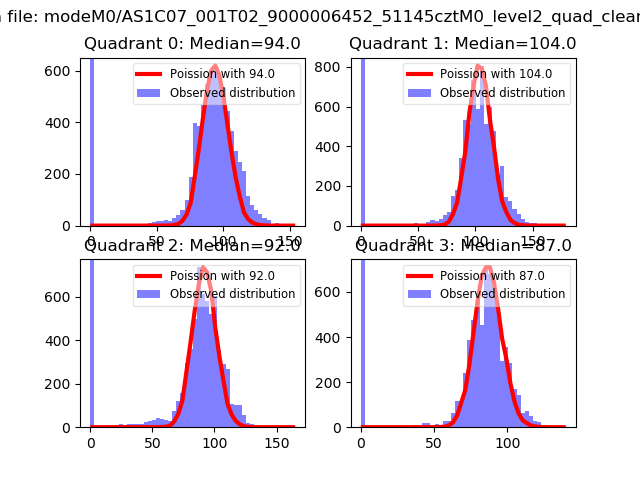 |
 |
| Quadrant-wise count rates Data is divided into 100 sec bins |
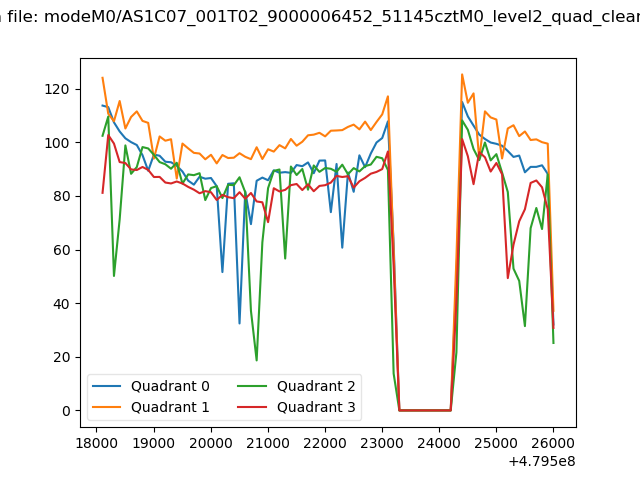 |
|
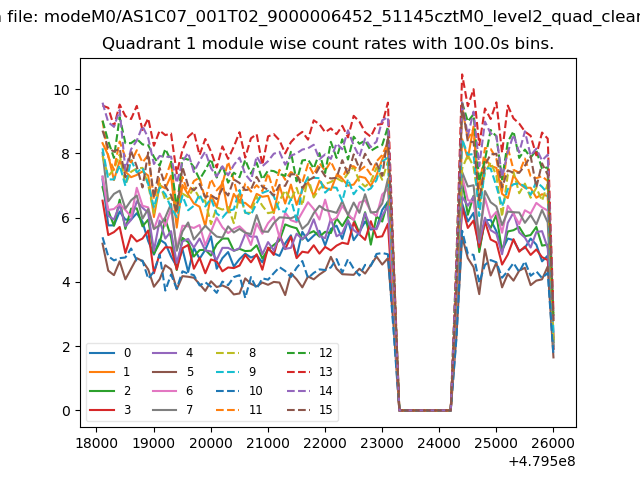
| Module-wise count rates for Quadrant A Data is divided into 100 sec bins |
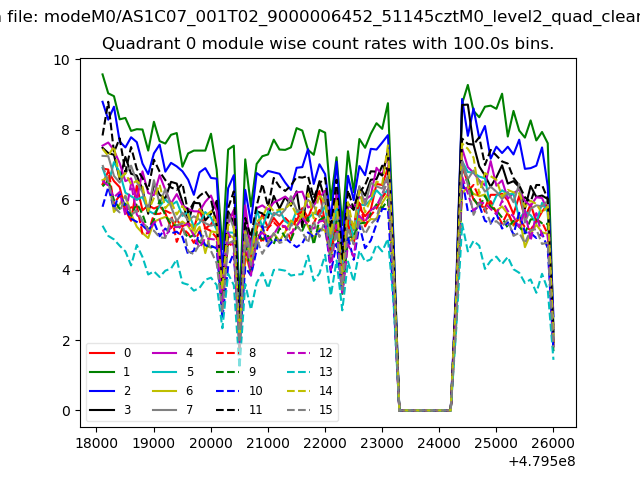 |
 |
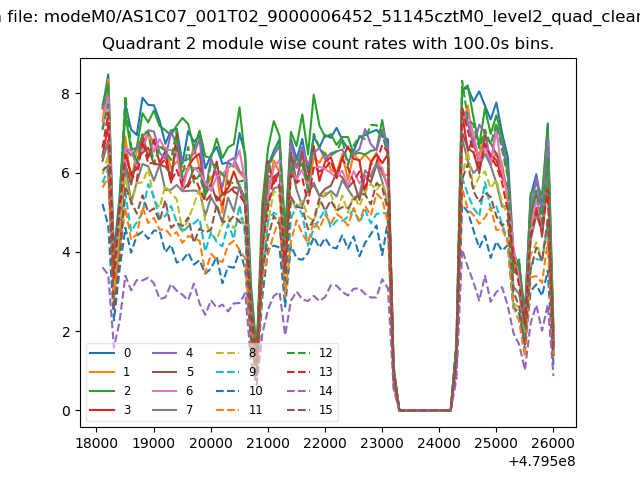
| Module-wise count rates for Quadrant B Data is divided into 100 sec bins |
 |
 |
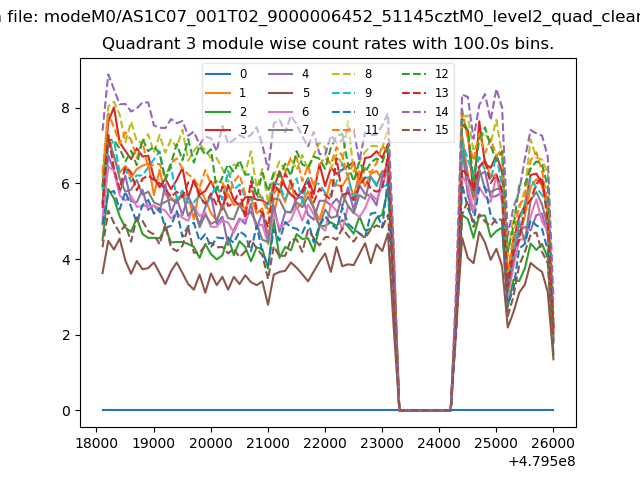
| Module-wise count rates for Quadrant C Data is divided into 100 sec bins |
 |
 |
| Module-wise count rates for Quadrant D Data is divided into 100 sec bins |
 |
 |
| Parameter | Plot |
|---|---|
| CZT HV Monitor | 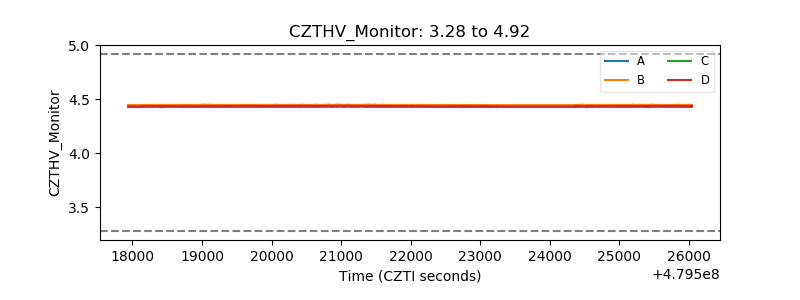 |
| D_VDD | 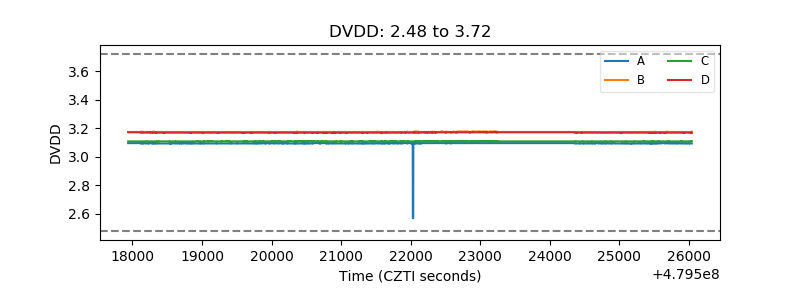 |
| Temperature 1 | 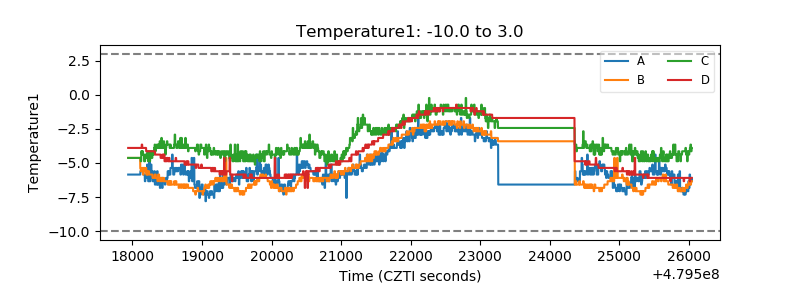 |
| Veto HV Monitor | 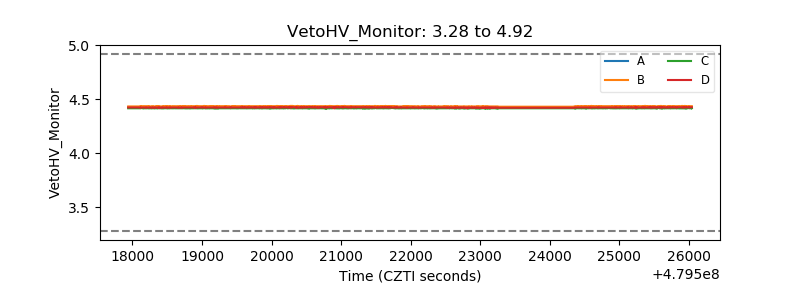 |
| Veto LLD | 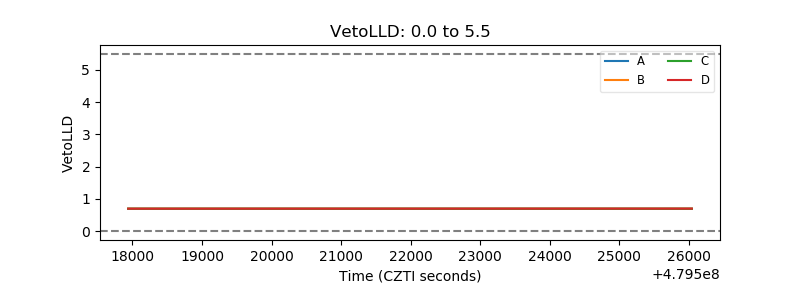 |
| Alpha Counter | 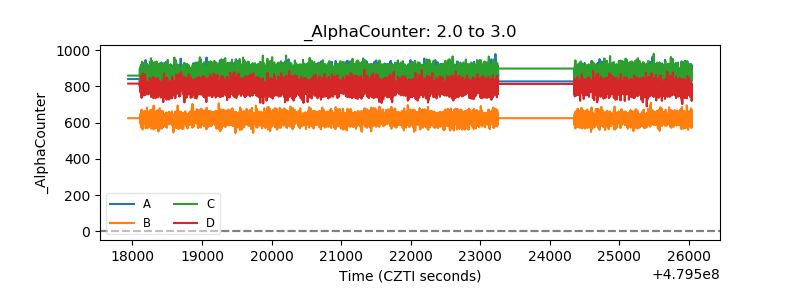 |
| _CPM_Rate | 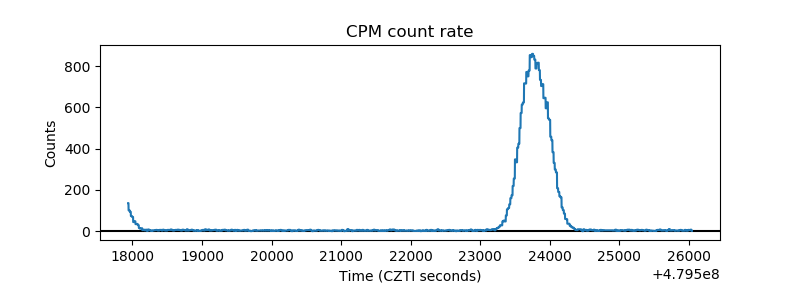 |
| CZT Counter | 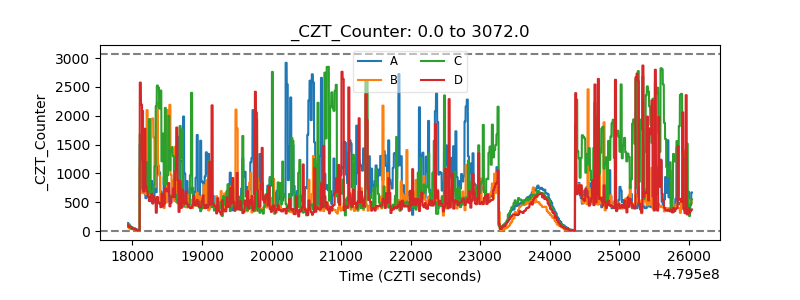 |
| +2.5 Volts monitor | 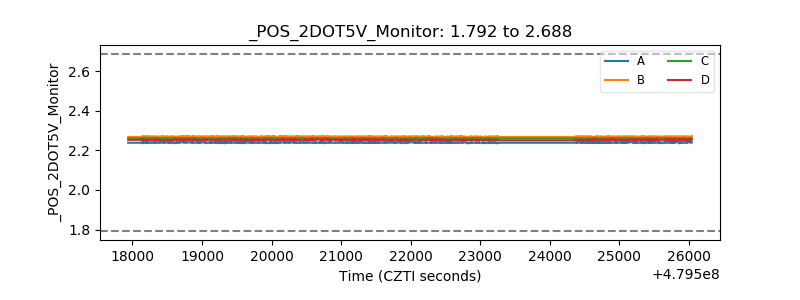 |
| +5 Volts monitor | 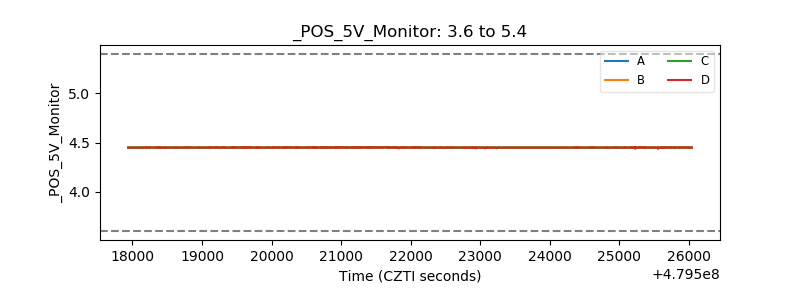 |
| _ROLL_ROT | 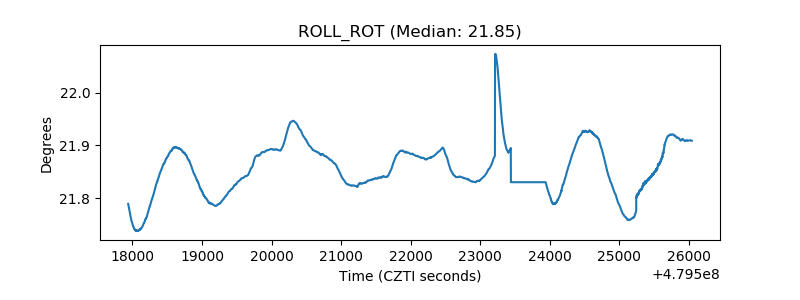 |
| _Roll_DEC | 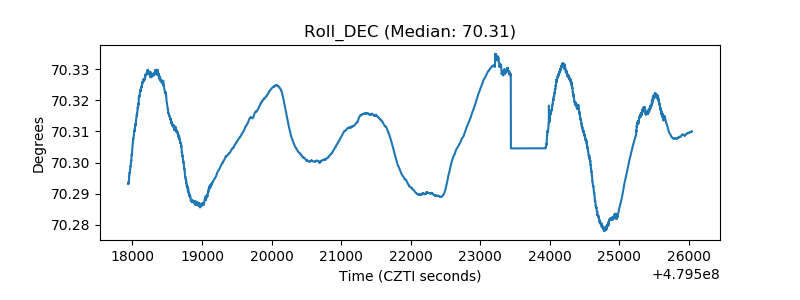 |
| _Roll_RA | 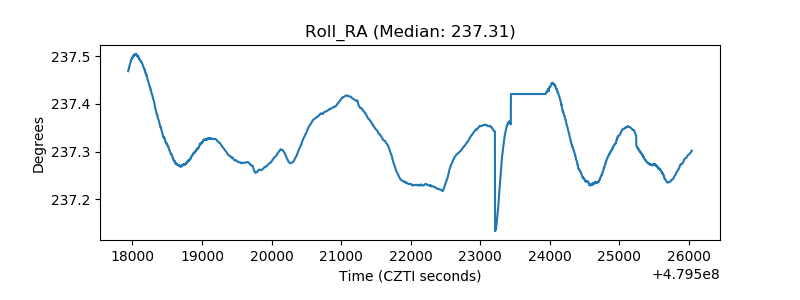 |
| Veto Counter | 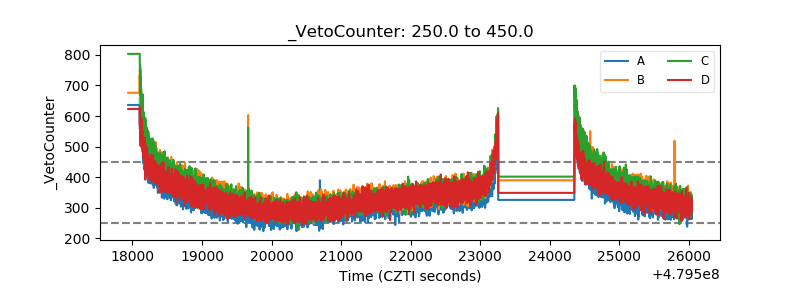 |