| Param | Original file | Final file |
|---|---|---|
| Filename | modeM0/AS1C07_001T02_9000006452_51146cztM0_level2.fits | modeM0/AS1C07_001T02_9000006452_51146cztM0_level2_quad_clean.evt |
| Size (bytes) | 477,578,880 | 79,453,440 |
| Size | 455.5 MB | 75.8 MB |
| Events in quadrant A | 3,876,685 | 519,961 |
| Events in quadrant B | 3,421,303 | 570,671 |
| Events in quadrant C | 6,139,002 | 470,404 |
| Events in quadrant D | 3,815,727 | 461,233 |
| Mode SS | |||
|---|---|---|---|
| Quadrant | BADHDUFLAG | Total packets | Discarded packets |
| A | 0 | 110 | 0 |
| B | 0 | 110 | 0 |
| C | 0 | 110 | 0 |
| D | 0 | 110 | 0 |
| Mode M9 | |||
|---|---|---|---|
| Quadrant | BADHDUFLAG | Total packets | Discarded packets |
| A | 0 | 15 | 0 |
| B | 0 | 16 | 0 |
| C | 0 | 16 | 0 |
| D | 0 | 16 | 0 |
| Mode M0 | |||
|---|---|---|---|
| Quadrant | BADHDUFLAG | Total packets | Discarded packets |
| A | 0 | 15305 | 2 |
| B | 0 | 14053 | 2 |
| C | 0 | 22083 | 2 |
| D | 0 | 15234 | 2 |
| Quadrant | Total seconds | Saturated seconds | Saturation percentage |
|---|---|---|---|
| A | 5486 | 129 | 2.351440% |
| B | 5486 | 160 | 2.916515% |
| C | 5486 | 686 | 12.504557% |
| D | 5486 | 316 | 5.760117% |
Noise dominated data is calculated using 1-second bins in cleaned event files. If a bin has >2000 counts, and if more than 50% of those come from <1% of pixels, then it is considered to be noise-dominated and hence unusable.
| Quadrant | # 1 sec bins | Bins with >0 counts | Bins with >2000 counts | High rate bins dominated by noise | Noise dominated (total time) | Noise dominated (detector-on time) | Marked lightcurve |
|---|---|---|---|---|---|---|---|
| A | 6661 | 5487 | 86 | 86 | 1.29% | 1.57% | 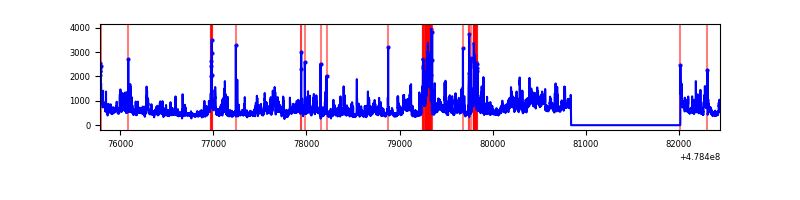 |
| B | 6661 | 5487 | 91 | 91 | 1.37% | 1.66% | 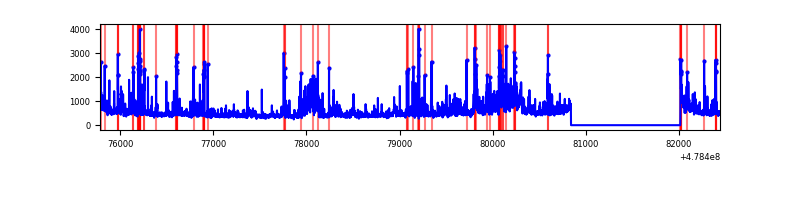 |
| C | 6661 | 5487 | 615 | 615 | 9.23% | 11.21% | 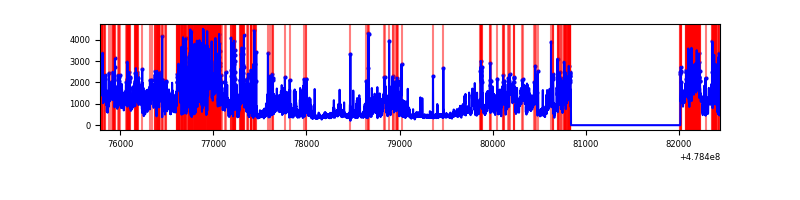 |
| D | 6661 | 5487 | 289 | 289 | 4.34% | 5.27% | 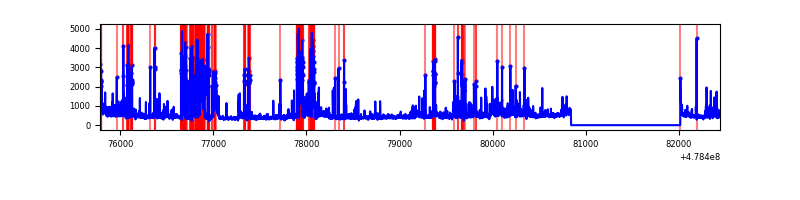 |
Top three noisy pixels from each quadrant. If the there are fewer than three noisy pixels in the level2.evt file, extra rows are filled as -1
| Pixel properties | Quadrant properties | ||||||
|---|---|---|---|---|---|---|---|
| Quadrant | DetID | PixID | Counts | Sigma | Mean | Median | Sigma |
| A | 12 | 3 | 587975 | 4135.81 | 570 | 556 | 142.0 |
| A | 4 | 4 | 304362 | 2138.99 | 570 | 556 | 142.0 |
| A | 12 | 80 | 146549 | 1027.89 | 570 | 556 | 142.0 |
| B | 5 | 185 | 301518 | 2483.97 | 571 | 553 | 121.2 |
| B | 12 | 32 | 221866 | 1826.58 | 571 | 553 | 121.2 |
| B | 4 | 171 | 188566 | 1551.74 | 571 | 553 | 121.2 |
| C | 12 | 247 | 2121260 | 14087.67 | 540 | 537 | 150.5 |
| C | 4 | 12 | 857915 | 5695.44 | 540 | 537 | 150.5 |
| C | 15 | 230 | 341315 | 2263.74 | 540 | 537 | 150.5 |
| D | 2 | 62 | 822280 | 5403.65 | 543 | 523 | 152.1 |
| D | 8 | 176 | 233356 | 1531.05 | 543 | 523 | 152.1 |
| D | 3 | 12 | 194337 | 1274.47 | 543 | 523 | 152.1 |
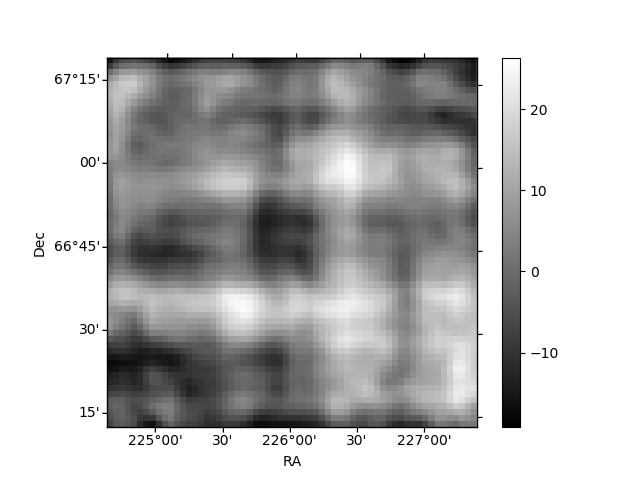
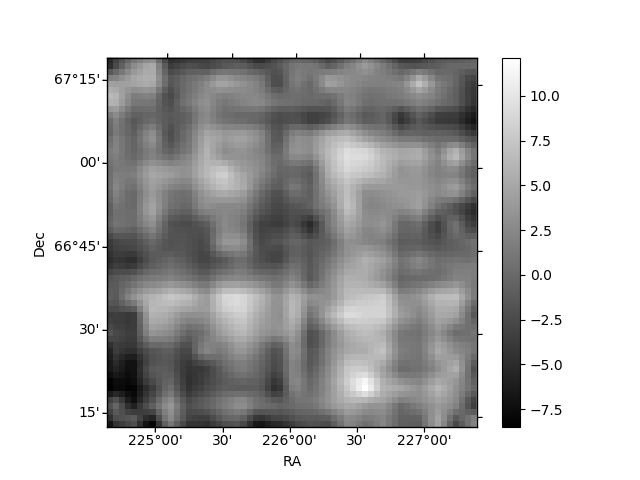
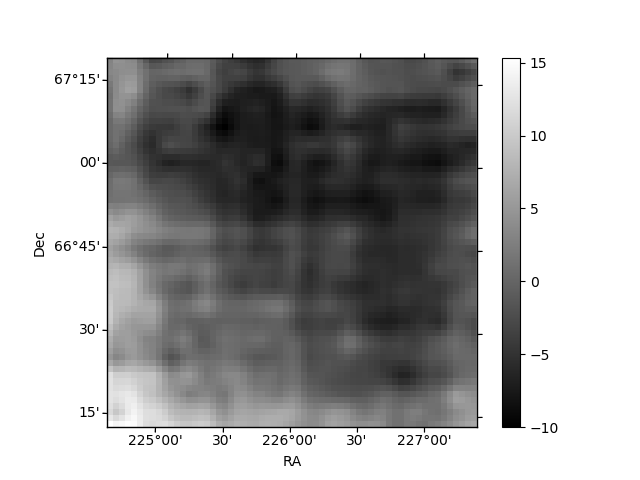
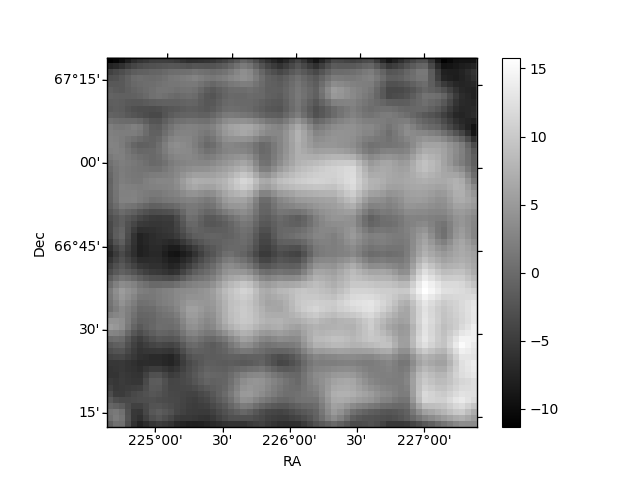
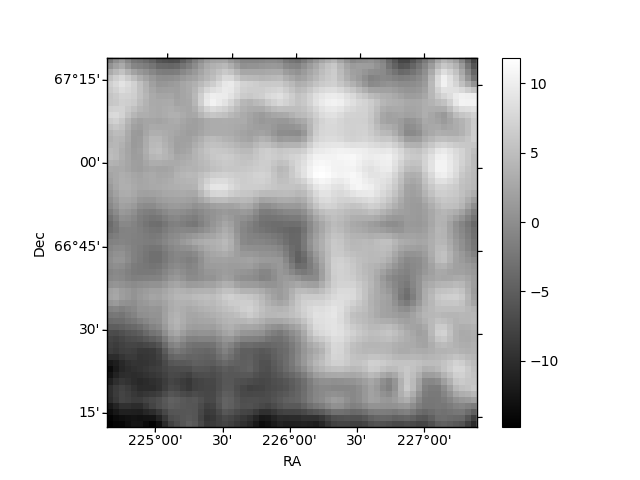
Histogram calculated using DETX and DETY for each event in the final _common_clean file
| Quadrant A | 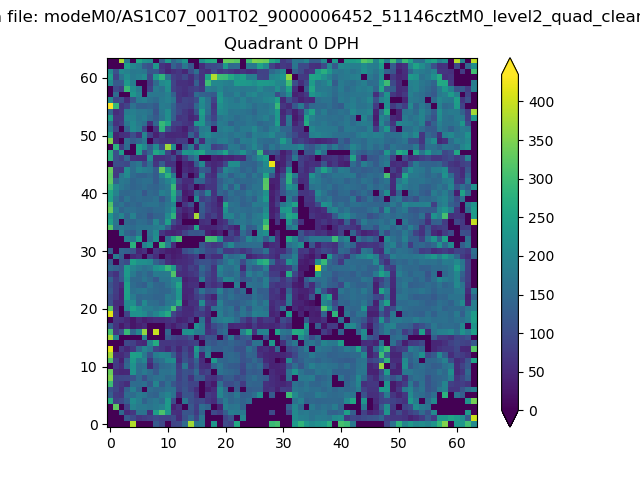 |
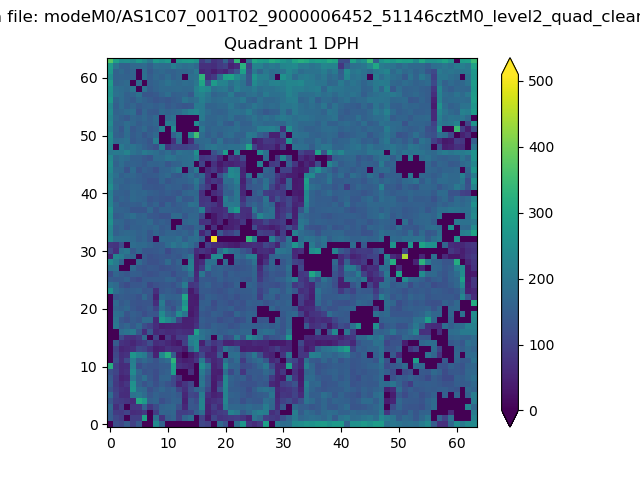 |
Quadrant B |
|---|---|---|---|
| Quadrant D | 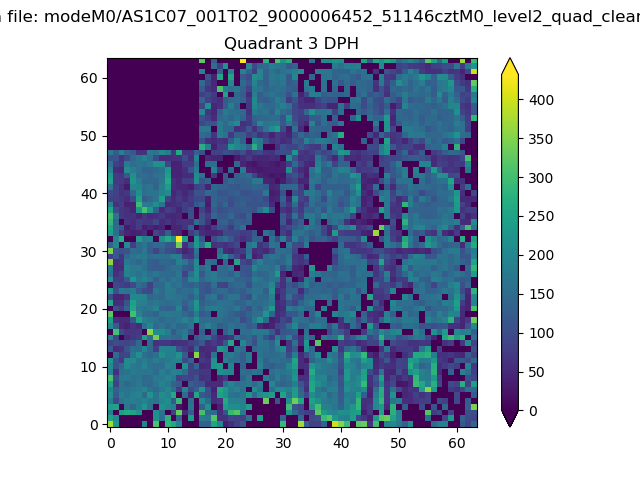 |
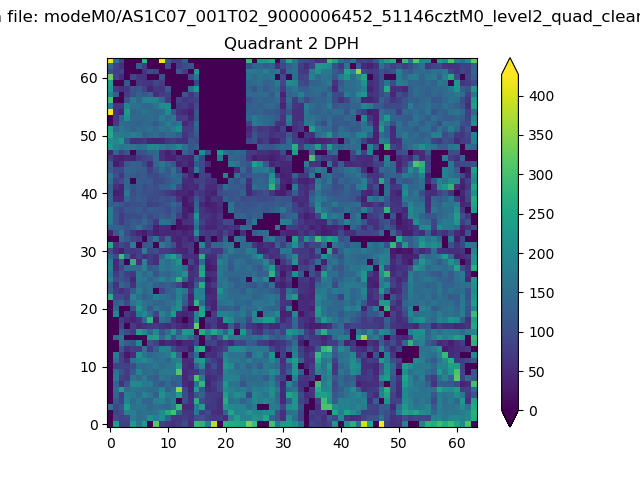 |
Quadrant C |
| Plot type | Count rate plots | Images |
|---|---|---|
| Comparison with Poisson distribution Blue bars denote a histogram of data divided into 1 sec bins. Red curve is a Poisson curve with rate = median count rate of data. |
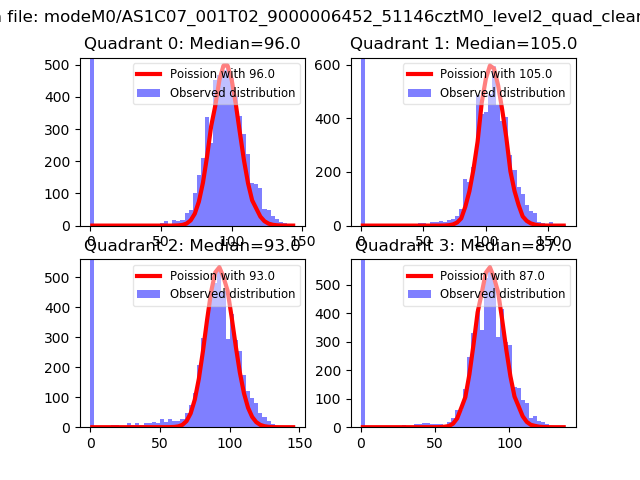 |
 |
| Quadrant-wise count rates Data is divided into 100 sec bins |
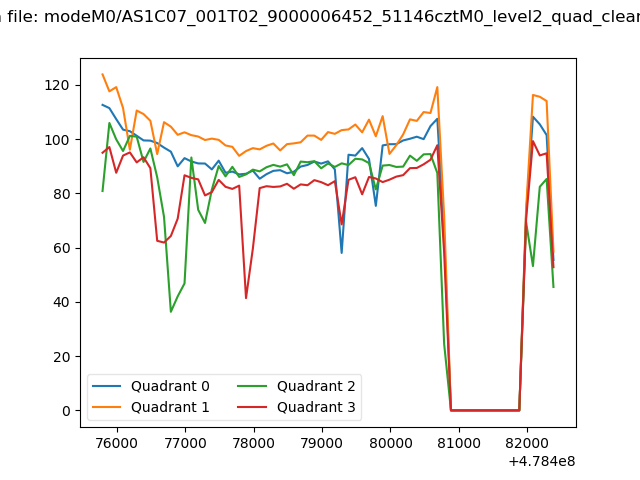 |
|
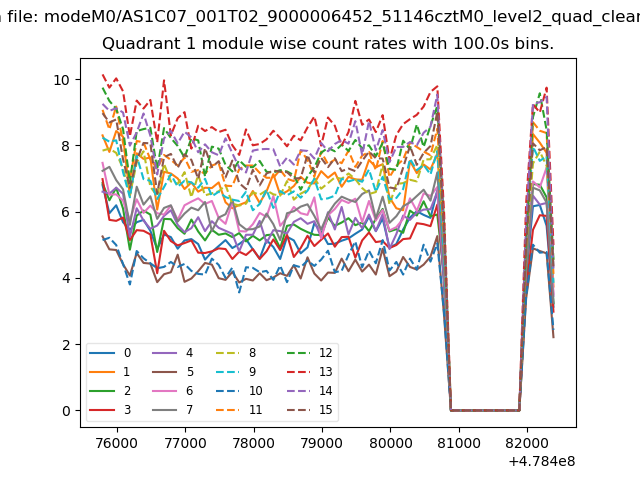
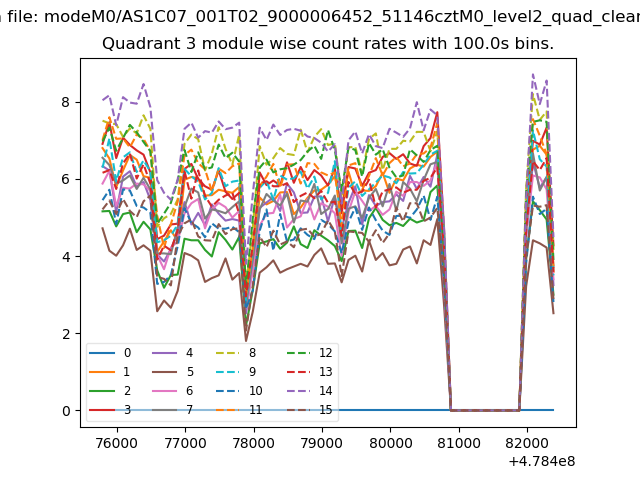
| Module-wise count rates for Quadrant A Data is divided into 100 sec bins |
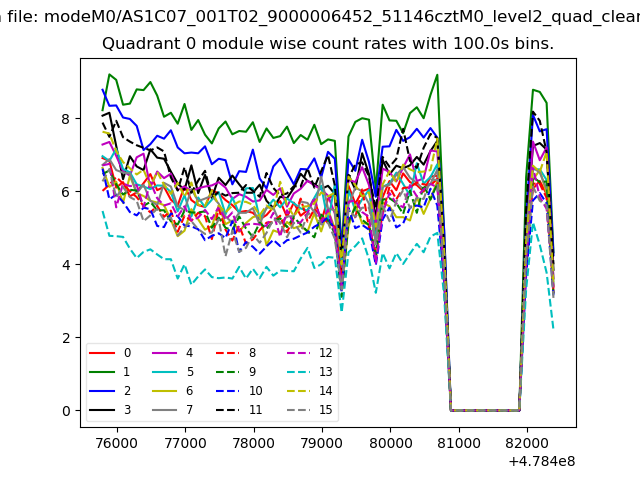 |
 |
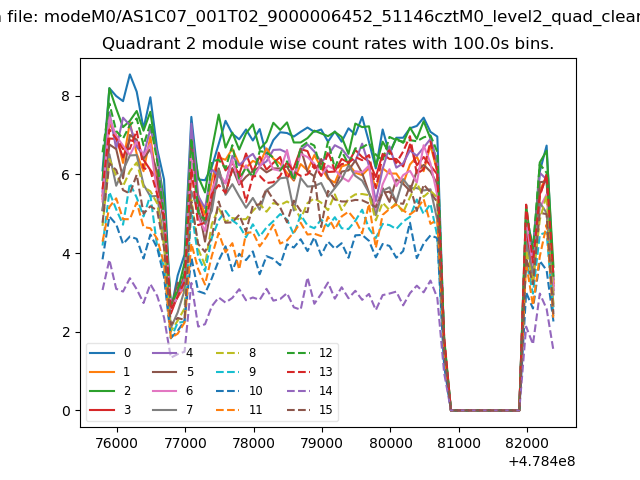
| Module-wise count rates for Quadrant B Data is divided into 100 sec bins |
 |
 |
| Module-wise count rates for Quadrant C Data is divided into 100 sec bins |
 |
 |
| Module-wise count rates for Quadrant D Data is divided into 100 sec bins |
 |
 |
| Parameter | Plot |
|---|---|
| CZT HV Monitor | 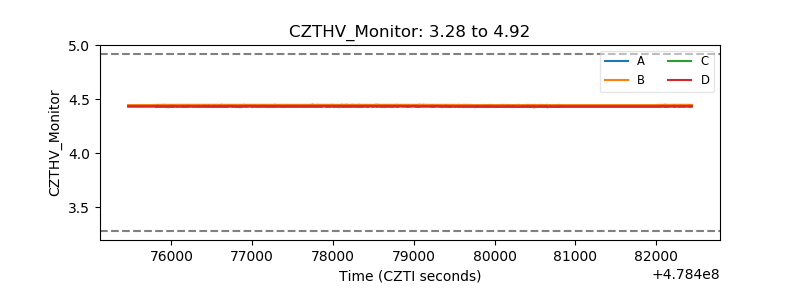 |
| D_VDD | 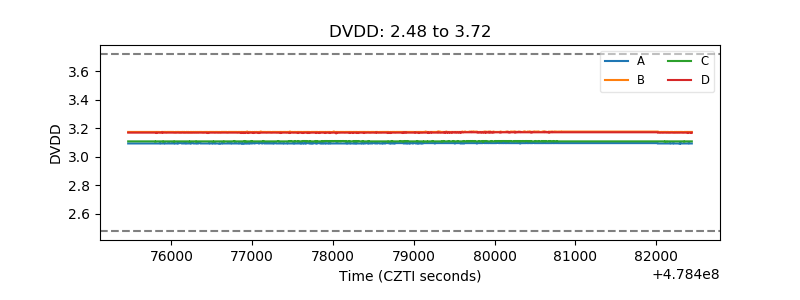 |
| Temperature 1 | 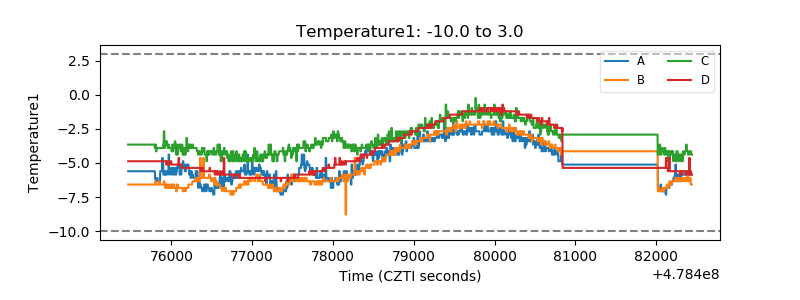 |
| Veto HV Monitor | 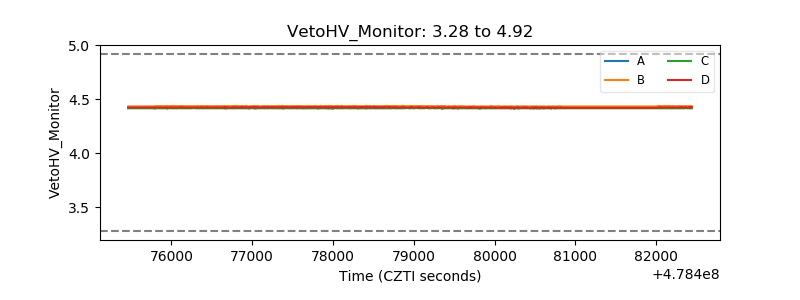 |
| Veto LLD | 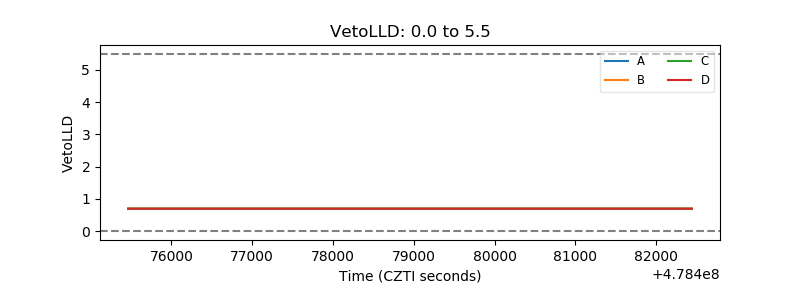 |
| Alpha Counter | 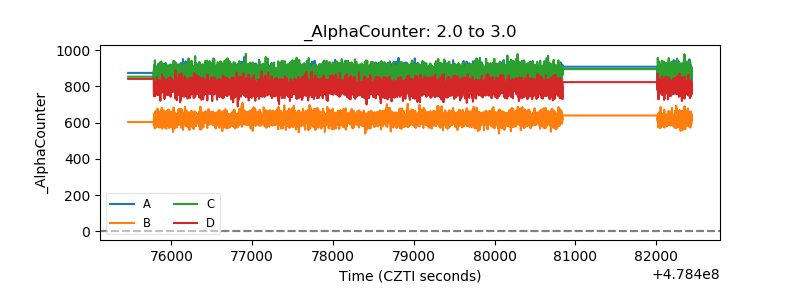 |
| _CPM_Rate | 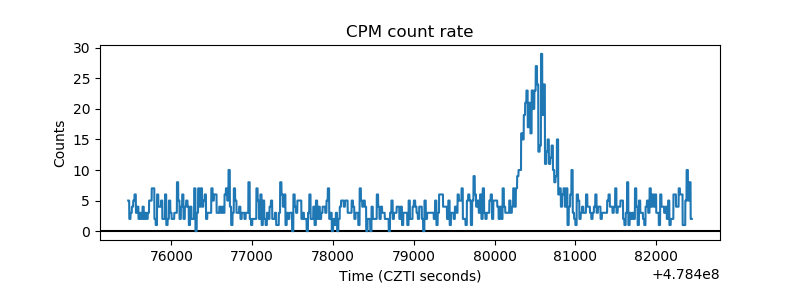 |
| CZT Counter | 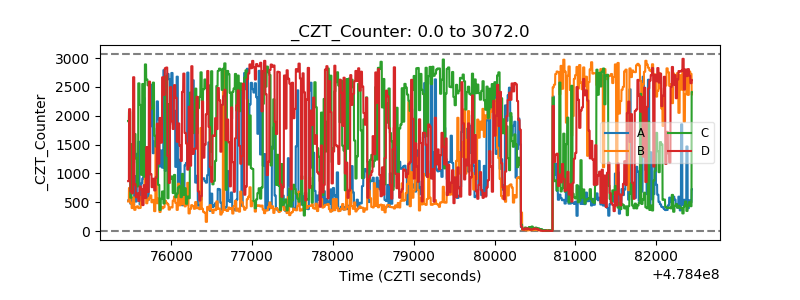 |
| +2.5 Volts monitor | 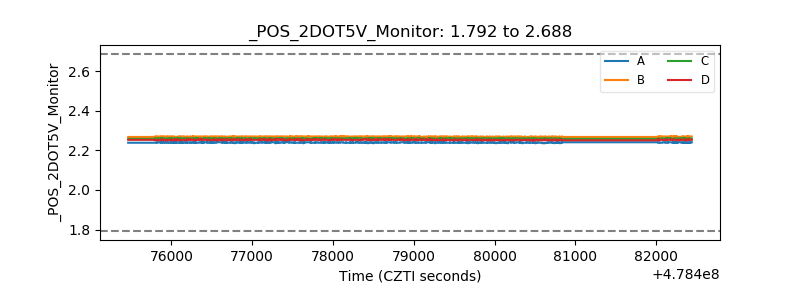 |
| +5 Volts monitor | 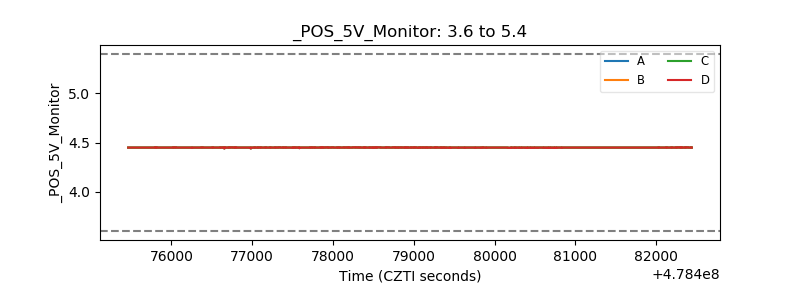 |
| _ROLL_ROT | 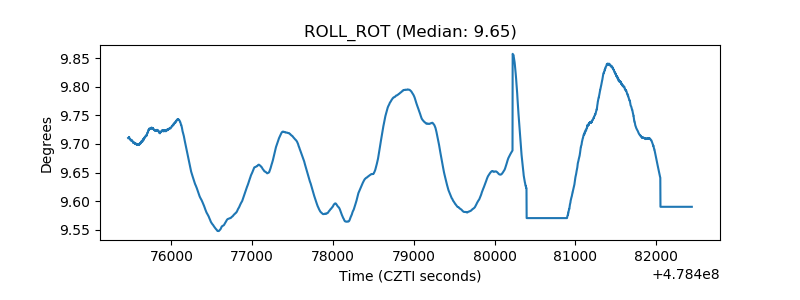 |
| _Roll_DEC | 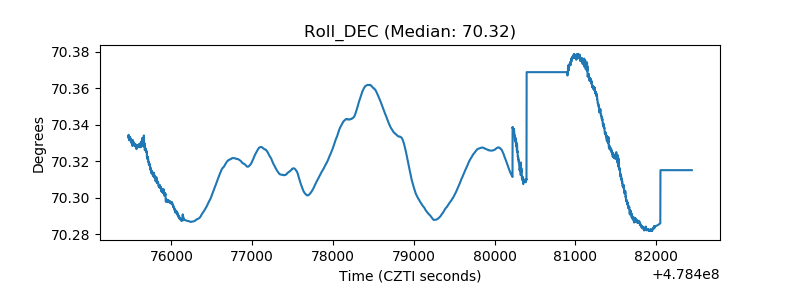 |
| _Roll_RA | 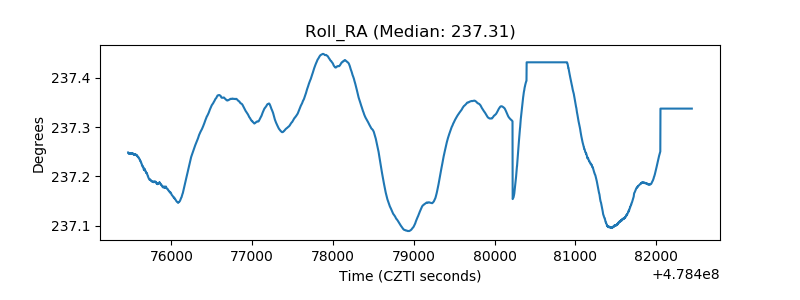 |
| Veto Counter | 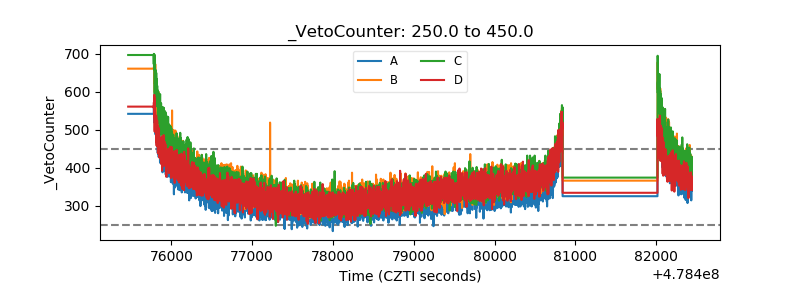 |