| Param | Original file | Final file |
|---|---|---|
| Filename | modeM0/AS1C07_001T01_9000006454cztM0_level2.fits | modeM0/AS1C07_001T01_9000006454cztM0_level2_quad_clean.evt |
| Size (bytes) | 4,714,300,800 | 6,699,280,320 |
| Size | 4.4 GB | 6.2 GB |
| Events in quadrant A | 9,639,640 | 14,402,727 |
| Events in quadrant B | 33,308,136 | 59,060,814 |
| Events in quadrant C | 27,859,682 | 39,314,494 |
| Events in quadrant D | 29,142,569 | 47,483,171 |
| Mode M0 | |||
|---|---|---|---|
| Quadrant | BADHDUFLAG | Total packets | Discarded packets |
| A | 0 | 923308 | 0 |
| B | 0 | 2110370 | 0 |
| C | 0 | 3632563 | 0 |
| D | 0 | 2427052 | 0 |
| Mode SS | |||
|---|---|---|---|
| Quadrant | BADHDUFLAG | Total packets | Discarded packets |
| A | 0 | 15118 | 0 |
| B | 0 | 15123 | 0 |
| C | 0 | 15121 | 0 |
| D | 0 | 15139 | 0 |
| Mode M9 | |||
|---|---|---|---|
| Quadrant | BADHDUFLAG | Total packets | Discarded packets |
| A | 0 | 843 | 0 |
| B | 0 | 842 | 0 |
| C | 0 | 844 | 0 |
| D | 0 | 843 | 0 |
| Quadrant | Total seconds | Saturated seconds | Saturation percentage |
|---|---|---|---|
| A | 220292 | 40941 | 18.584878% |
| B | 745295 | 52381 | 7.028224% |
| C | 744459 | 239258 | 32.138506% |
| D | 745086 | 78155 | 10.489393% |
Noise dominated data is calculated using 1-second bins in cleaned event files. If a bin has >2000 counts, and if more than 50% of those come from <1% of pixels, then it is considered to be noise-dominated and hence unusable.
| Quadrant | # 1 sec bins | Bins with >0 counts | Bins with >2000 counts | High rate bins dominated by noise | Noise dominated (total time) | Noise dominated (detector-on time) | Marked lightcurve |
|---|---|---|---|---|---|---|---|
| A | 264347 | 220563 | 0 | 0 | 0.00% | 0.00% | 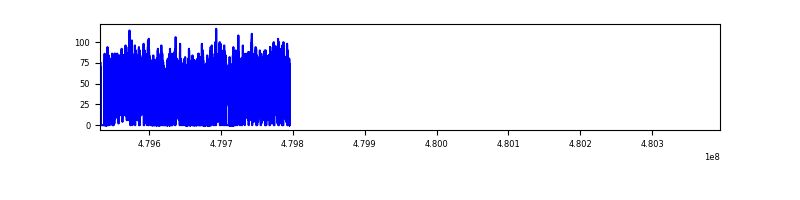 |
| B | 863068 | 746232 | 0 | 0 | 0.00% | 0.00% | 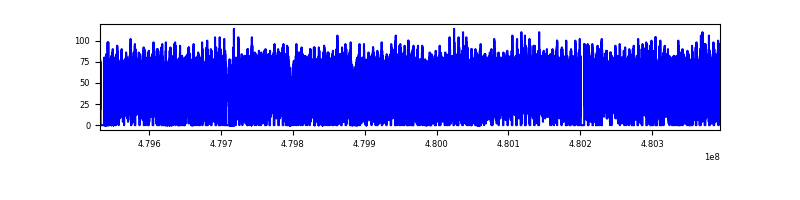 |
| C | 863068 | 730521 | 0 | 0 | 0.00% | 0.00% | 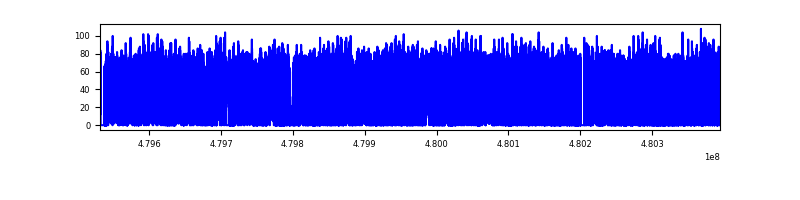 |
| D | 863068 | 744707 | 0 | 0 | 0.00% | 0.00% | 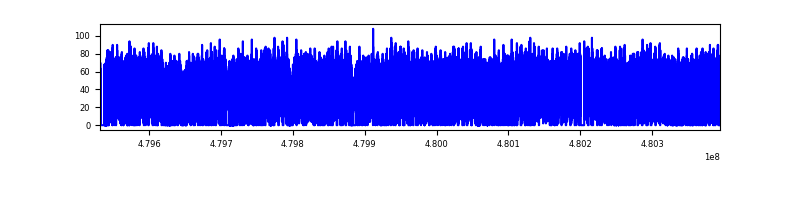 |
Top three noisy pixels from each quadrant. If the there are fewer than three noisy pixels in the level2.evt file, extra rows are filled as -1
| Pixel properties | Quadrant properties | ||||||
|---|---|---|---|---|---|---|---|
| Quadrant | DetID | PixID | Counts | Sigma | Mean | Median | Sigma |
| A | 14 | 188 | 10296 | 9.5 | 2542 | 2353 | 835.9 |
| A | 9 | 255 | 9927 | 9.06 | 2542 | 2353 | 835.9 |
| A | 14 | 95 | 8179 | 6.97 | 2542 | 2353 | 835.9 |
| B | 2 | 245 | 27021 | 8.95 | 8901 | 8435 | 2076.7 |
| B | 9 | 173 | 27011 | 8.94 | 8901 | 8435 | 2076.7 |
| B | 3 | 25 | 26289 | 8.6 | 8901 | 8435 | 2076.7 |
| C | 2 | 31 | 22969 | 6.34 | 7541 | 6907 | 2535.2 |
| C | 15 | 127 | 22577 | 6.18 | 7541 | 6907 | 2535.2 |
| C | 7 | 221 | 21889 | 5.91 | 7541 | 6907 | 2535.2 |
| D | 6 | 218 | 37185 | 10.58 | 8368 | 7416 | 2814.6 |
| D | 3 | 30 | 28754 | 7.58 | 8368 | 7416 | 2814.6 |
| D | 15 | 11 | 26663 | 6.84 | 8368 | 7416 | 2814.6 |
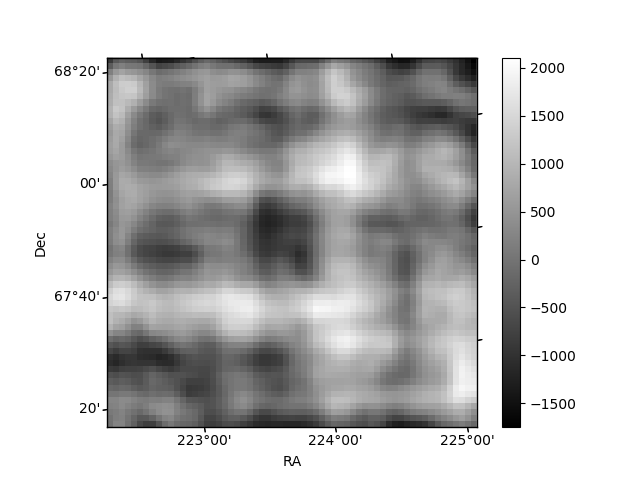
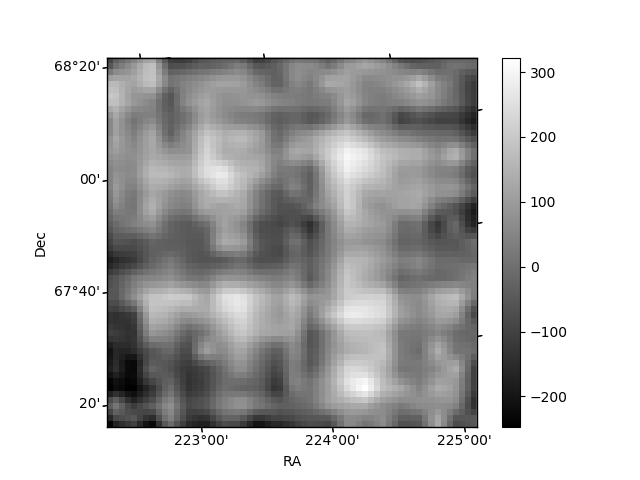
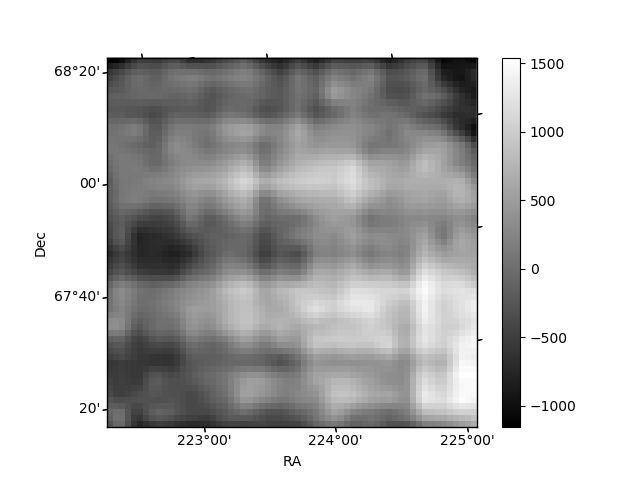
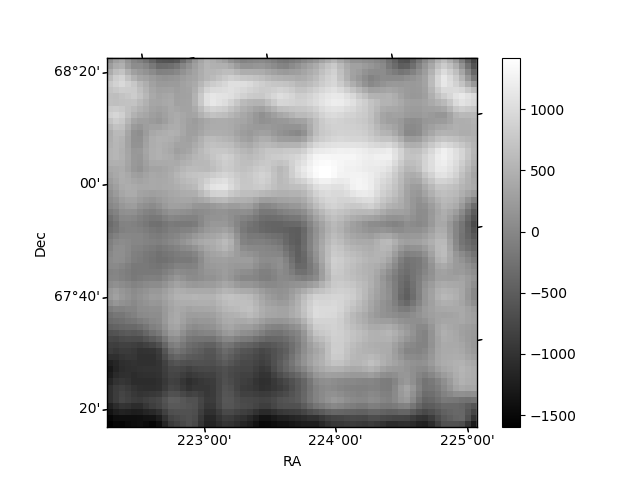
Histogram calculated using DETX and DETY for each event in the final _common_clean file
| Quadrant A | 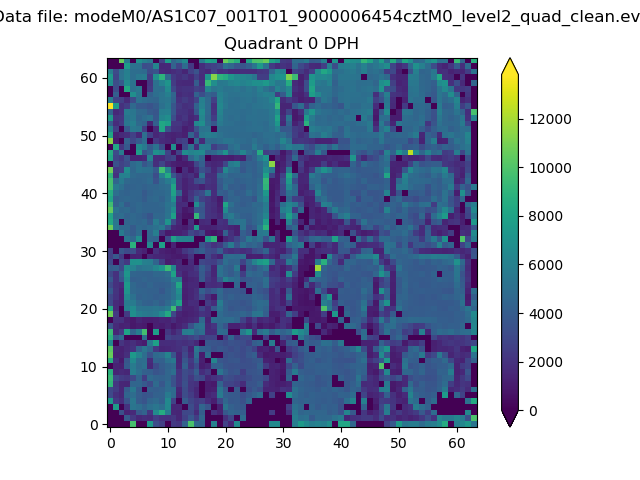 |
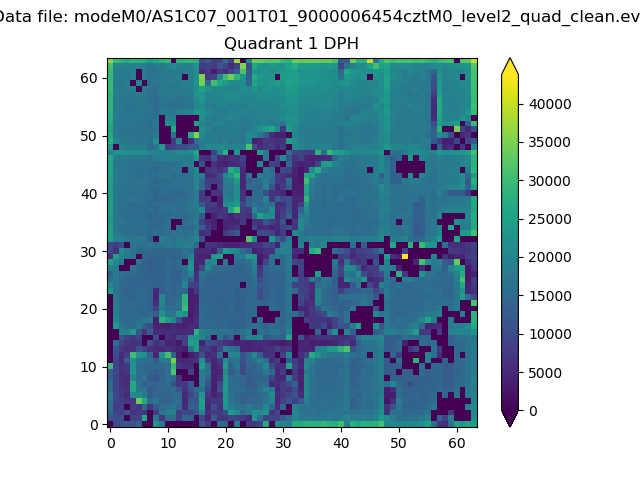 |
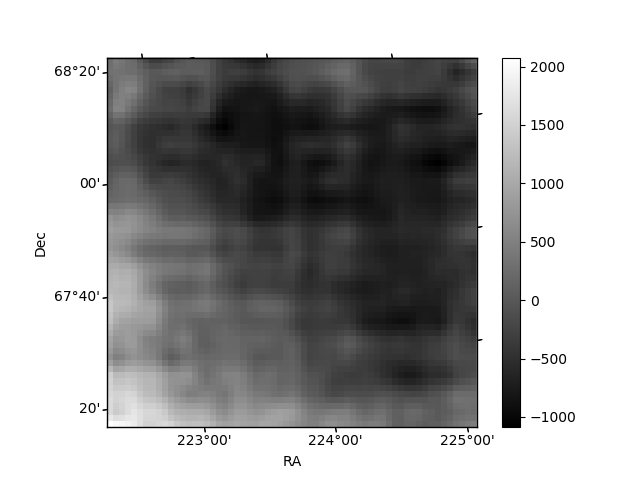
Quadrant B |
|---|---|---|---|
| Quadrant D | 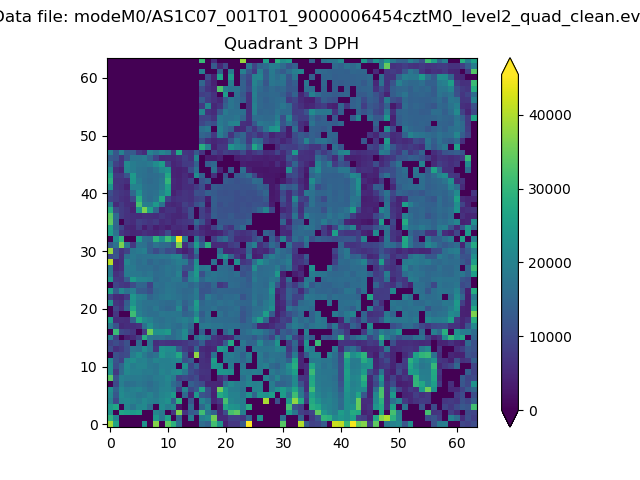 |
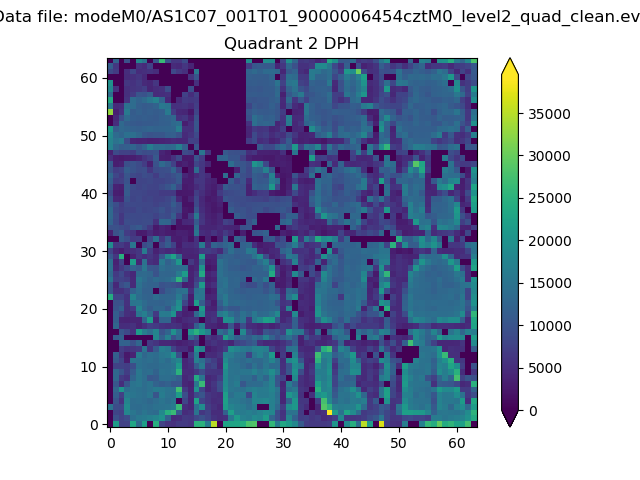 |
Quadrant C |
| Plot type | Count rate plots | Images |
|---|---|---|
| Comparison with Poisson distribution Blue bars denote a histogram of data divided into 1 sec bins. Red curve is a Poisson curve with rate = median count rate of data. |
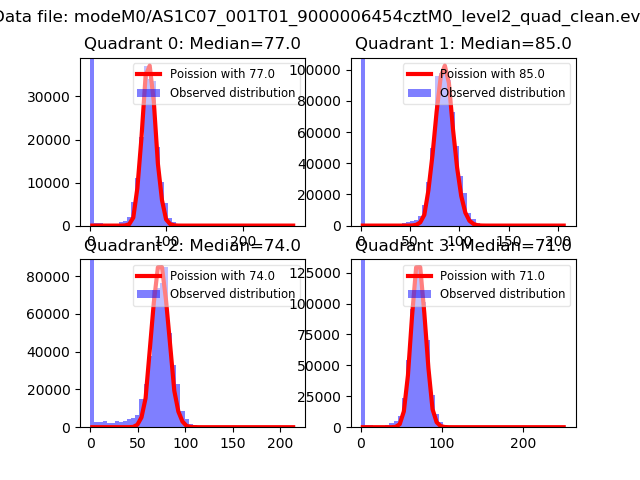 |
 |
| Quadrant-wise count rates Data is divided into 100 sec bins |
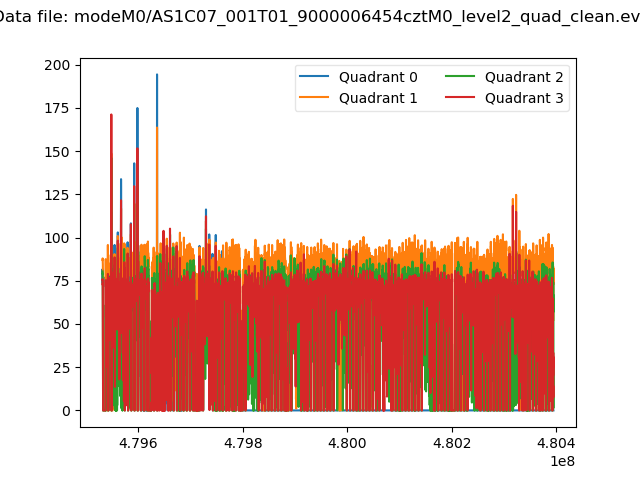 |
|
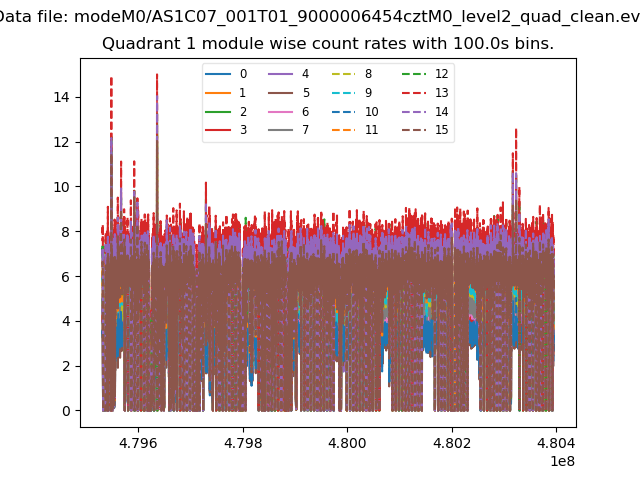
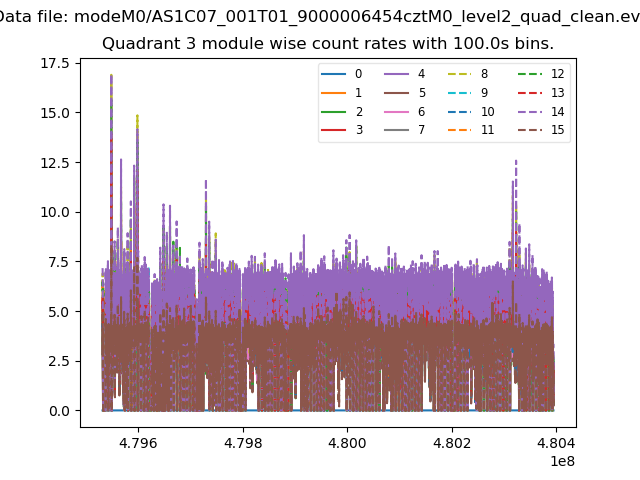
| Module-wise count rates for Quadrant A Data is divided into 100 sec bins |
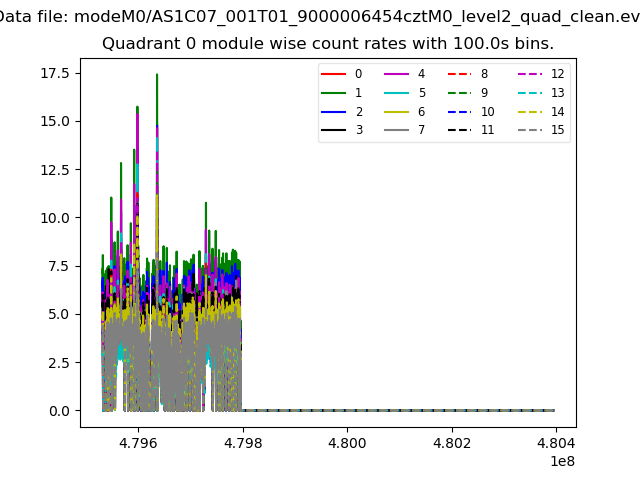 |
 |
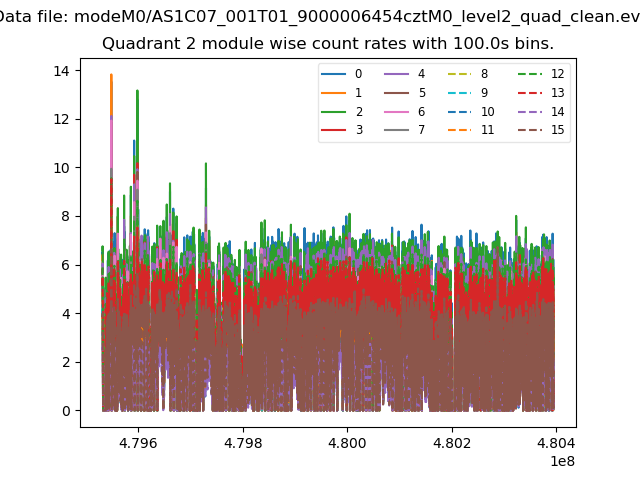
| Module-wise count rates for Quadrant B Data is divided into 100 sec bins |
 |
 |
| Module-wise count rates for Quadrant C Data is divided into 100 sec bins |
 |
 |
| Module-wise count rates for Quadrant D Data is divided into 100 sec bins |
 |
 |
| Parameter | Plot |
|---|---|
| CZT HV Monitor | 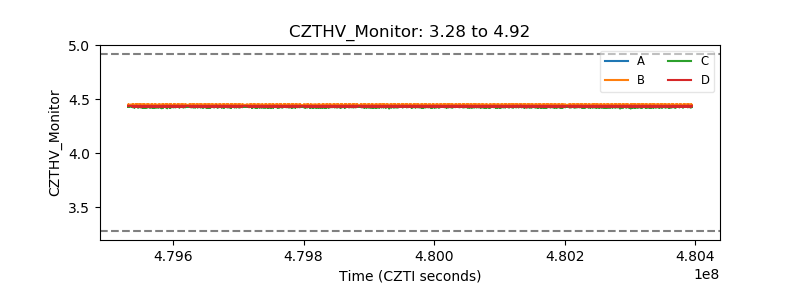 |
| D_VDD | 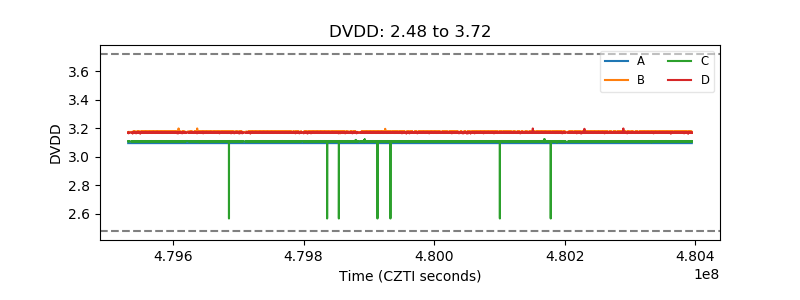 |
| Temperature 1 | 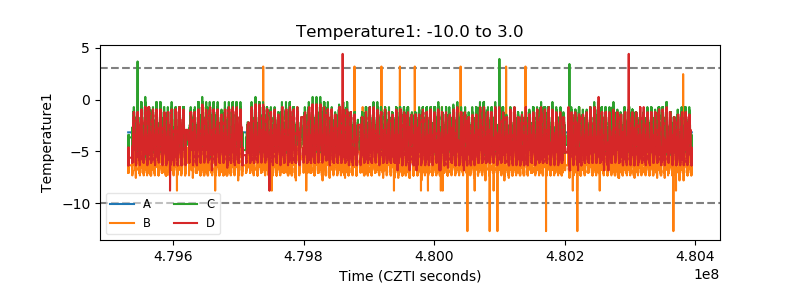 |
| Veto HV Monitor | 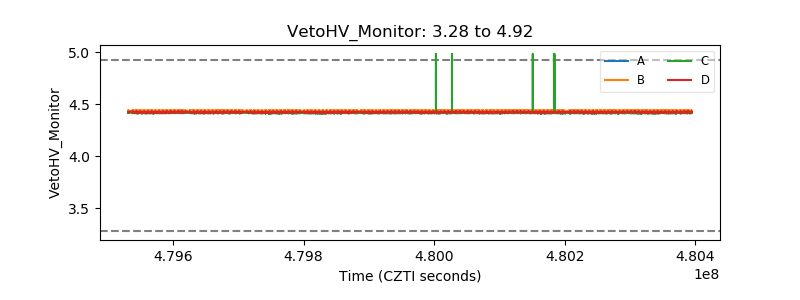 |
| Veto LLD | 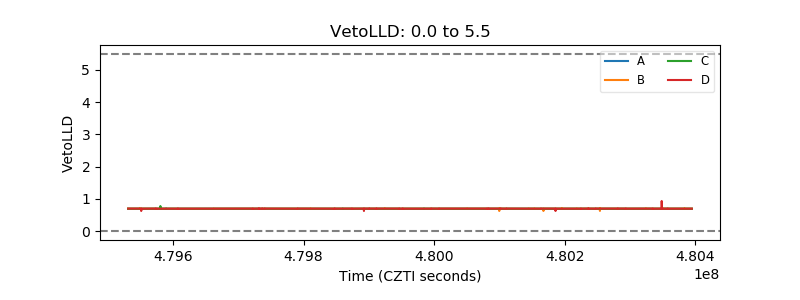 |
| Alpha Counter | 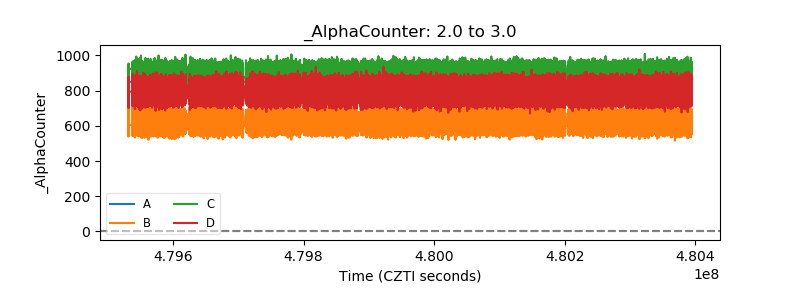 |
| _CPM_Rate | 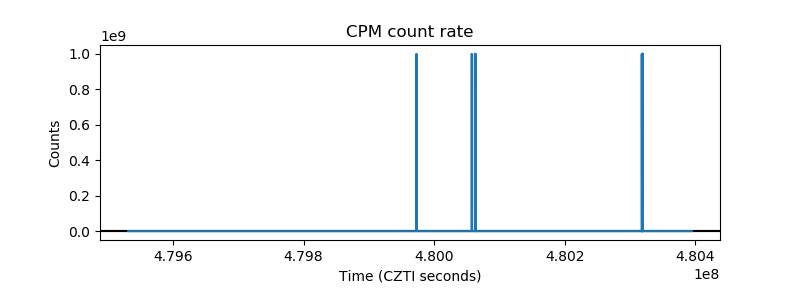 |
| CZT Counter | 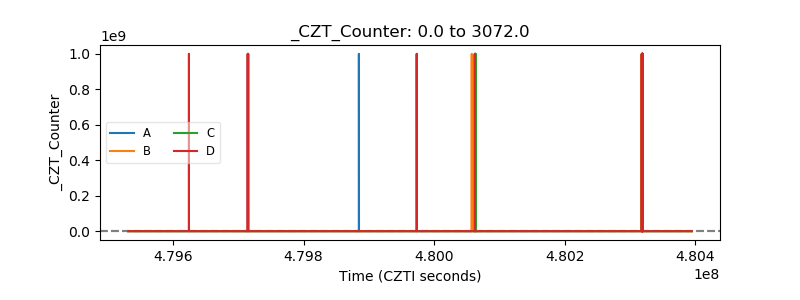 |
| +2.5 Volts monitor | 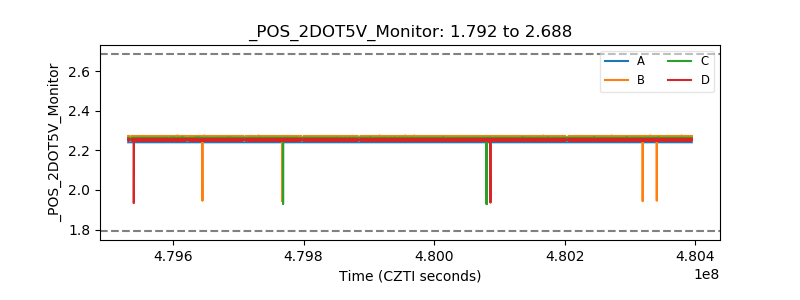 |
| +5 Volts monitor | 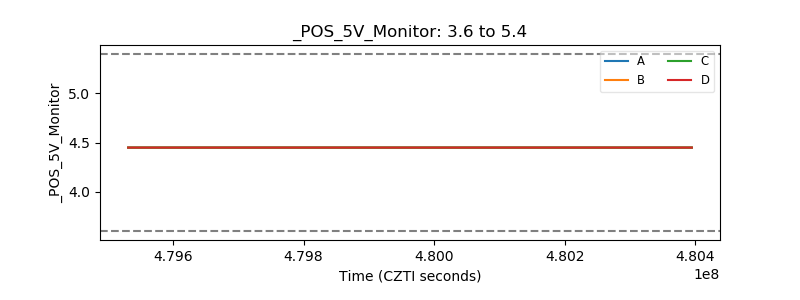 |
| _ROLL_ROT | 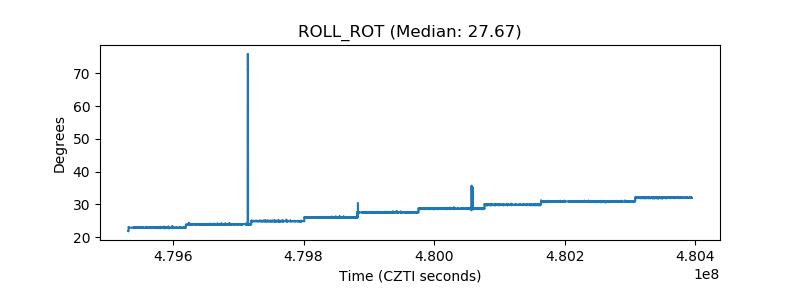 |
| _Roll_DEC | 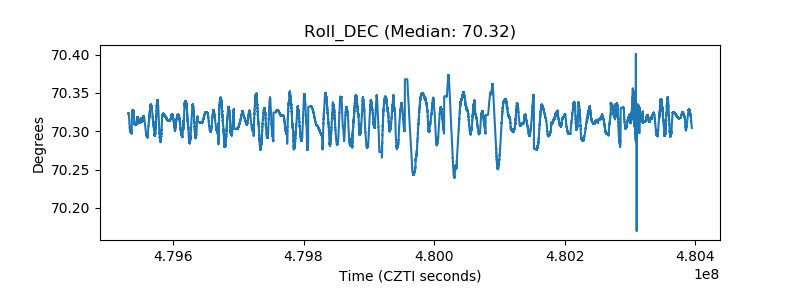 |
| _Roll_RA | 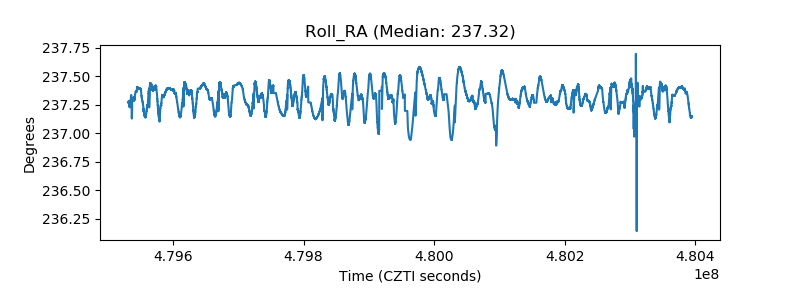 |
| Veto Counter | 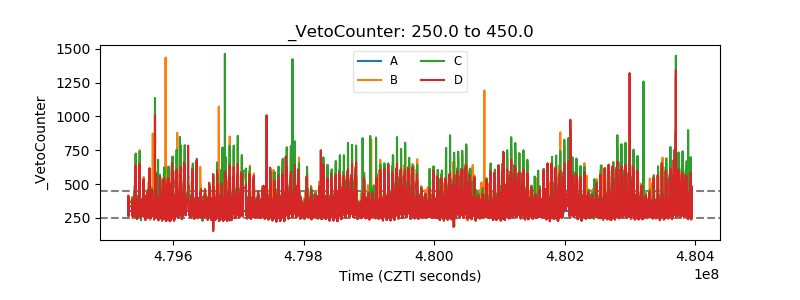 |