| Param | Original file | Final file |
|---|---|---|
| Filename | modeM0/AS1C07_001T01_9000006454_51148cztM0_level2.fits | modeM0/AS1C07_001T01_9000006454_51148cztM0_level2_quad_clean.evt |
| Size (bytes) | 774,417,600 | 71,040,960 |
| Size | 738.5 MB | 67.7 MB |
| Events in quadrant A | 7,004,929 | 506,496 |
| Events in quadrant B | 5,154,153 | 491,916 |
| Events in quadrant C | 11,482,055 | 263,025 |
| Events in quadrant D | 4,568,789 | 476,669 |
| Mode M0 | |||
|---|---|---|---|
| Quadrant | BADHDUFLAG | Total packets | Discarded packets |
| A | 0 | 25846 | 930 |
| B | 0 | 20040 | 483 |
| C | 0 | 40244 | 2165 |
| D | 0 | 18480 | 541 |
| Mode SS | |||
|---|---|---|---|
| Quadrant | BADHDUFLAG | Total packets | Discarded packets |
| A | 0 | 122 | 0 |
| B | 0 | 122 | 0 |
| C | 0 | 121 | 1 |
| D | 0 | 122 | 0 |
| Mode M9 | |||
|---|---|---|---|
| Quadrant | BADHDUFLAG | Total packets | Discarded packets |
| A | 0 | 9 | 0 |
| B | 0 | 10 | 0 |
| C | 0 | 10 | 0 |
| D | 0 | 10 | 0 |
| Quadrant | Total seconds | Saturated seconds | Saturation percentage |
|---|---|---|---|
| A | 5897 | 711 | 12.056978% |
| B | 5964 | 1268 | 21.260899% |
| C | 5786 | 3204 | 55.375043% |
| D | 5951 | 469 | 7.881028% |
Noise dominated data is calculated using 1-second bins in cleaned event files. If a bin has >2000 counts, and if more than 50% of those come from <1% of pixels, then it is considered to be noise-dominated and hence unusable.
| Quadrant | # 1 sec bins | Bins with >0 counts | Bins with >2000 counts | High rate bins dominated by noise | Noise dominated (total time) | Noise dominated (detector-on time) | Marked lightcurve |
|---|---|---|---|---|---|---|---|
| A | 7058 | 6067 | 672 | 672 | 9.52% | 11.08% | 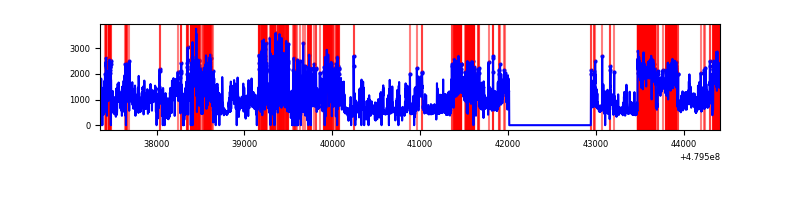 |
| B | 7059 | 6066 | 390 | 390 | 5.52% | 6.43% | 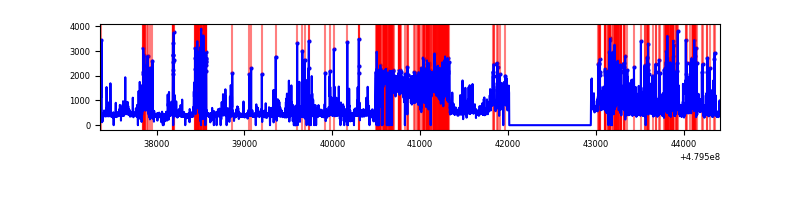 |
| C | 7058 | 5972 | 3108 | 3108 | 44.04% | 52.04% | 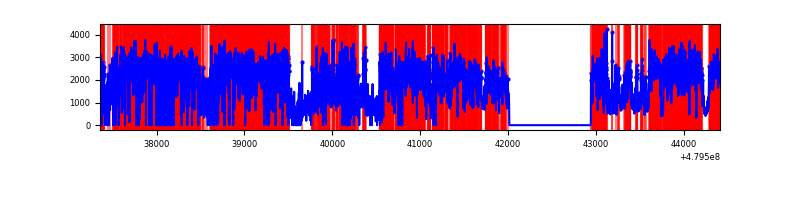 |
| D | 7058 | 6076 | 406 | 406 | 5.75% | 6.68% | 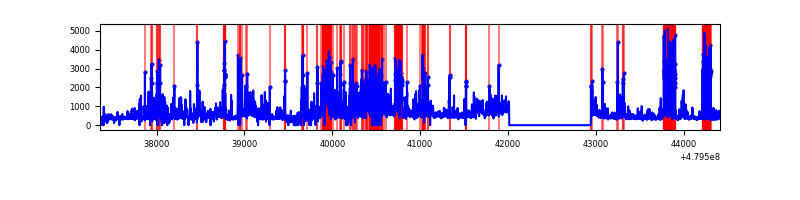 |
Top three noisy pixels from each quadrant. If the there are fewer than three noisy pixels in the level2.evt file, extra rows are filled as -1
| Pixel properties | Quadrant properties | ||||||
|---|---|---|---|---|---|---|---|
| Quadrant | DetID | PixID | Counts | Sigma | Mean | Median | Sigma |
| A | 12 | 80 | 2308480 | 15578.52 | 597 | 582 | 148.1 |
| A | 12 | 3 | 1426418 | 9624.52 | 597 | 582 | 148.1 |
| A | 13 | 248 | 260055 | 1751.47 | 597 | 582 | 148.1 |
| B | 12 | 32 | 1777480 | 14892.4 | 558 | 539 | 119.3 |
| B | 5 | 185 | 505316 | 4230.5 | 558 | 539 | 119.3 |
| B | 4 | 171 | 165312 | 1380.95 | 558 | 539 | 119.3 |
| C | 12 | 247 | 8072013 | 60321.32 | 481 | 479 | 133.8 |
| C | 15 | 224 | 738113 | 5512.59 | 481 | 479 | 133.8 |
| C | 4 | 12 | 314177 | 2344.37 | 481 | 479 | 133.8 |
| D | 2 | 62 | 511913 | 3206.75 | 572 | 552 | 159.5 |
| D | 3 | 12 | 500767 | 3136.86 | 572 | 552 | 159.5 |
| D | 10 | 172 | 466893 | 2924.43 | 572 | 552 | 159.5 |
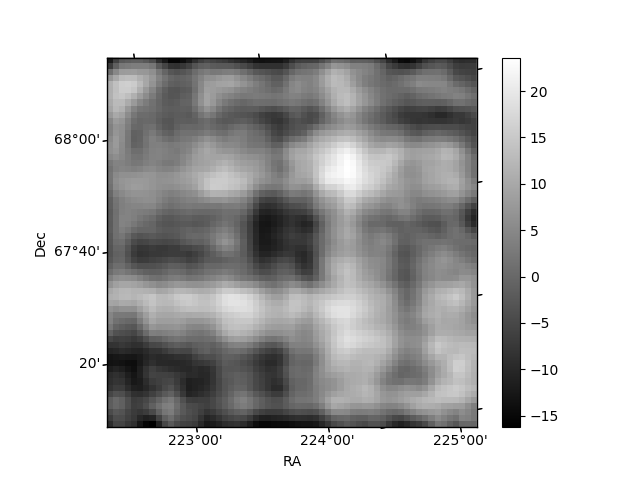
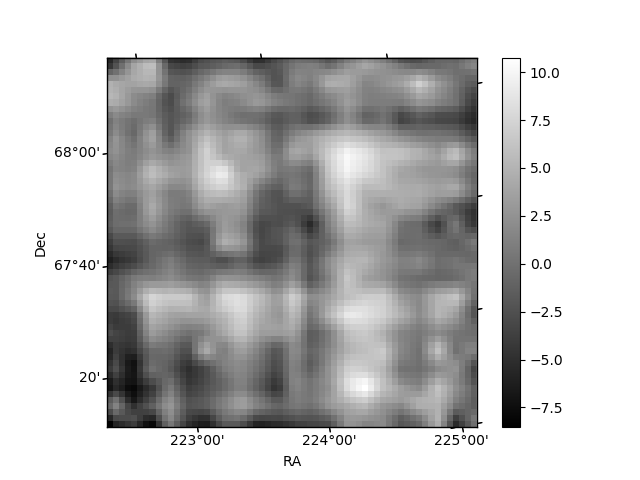
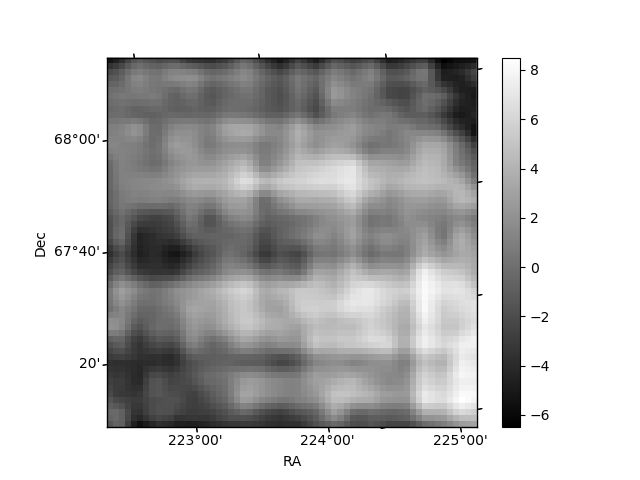
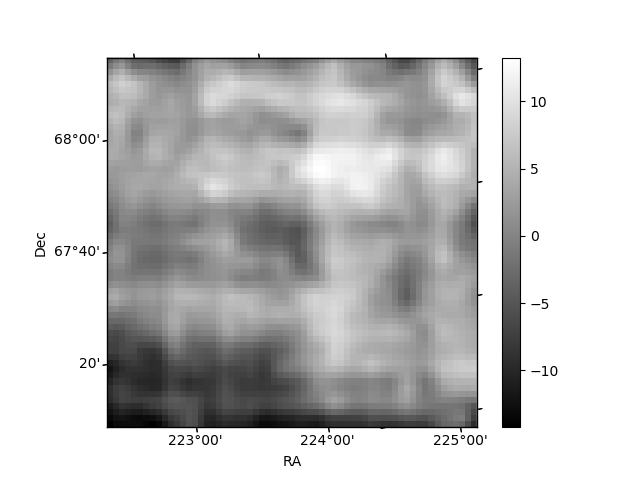
Histogram calculated using DETX and DETY for each event in the final _common_clean file
| Quadrant A | 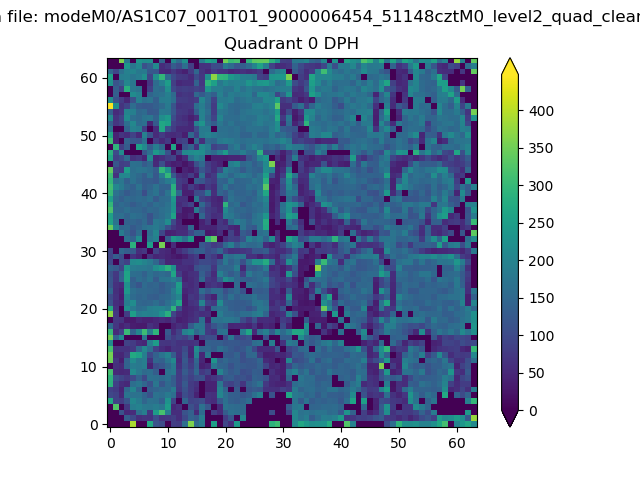 |
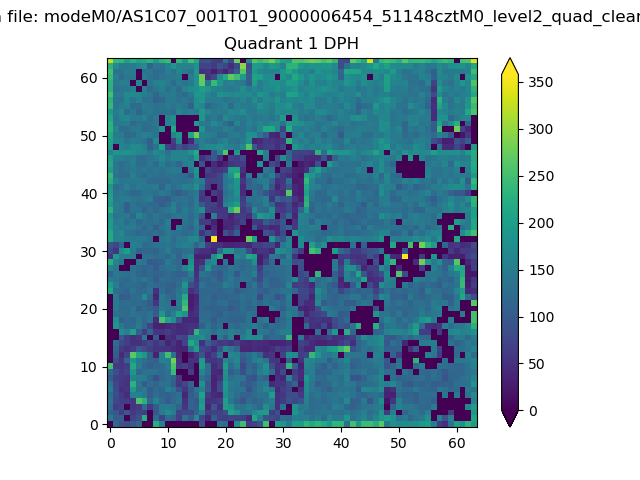 |
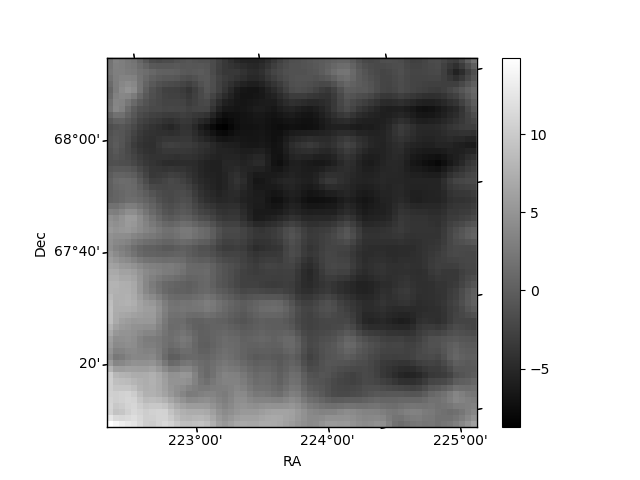
Quadrant B |
|---|---|---|---|
| Quadrant D | 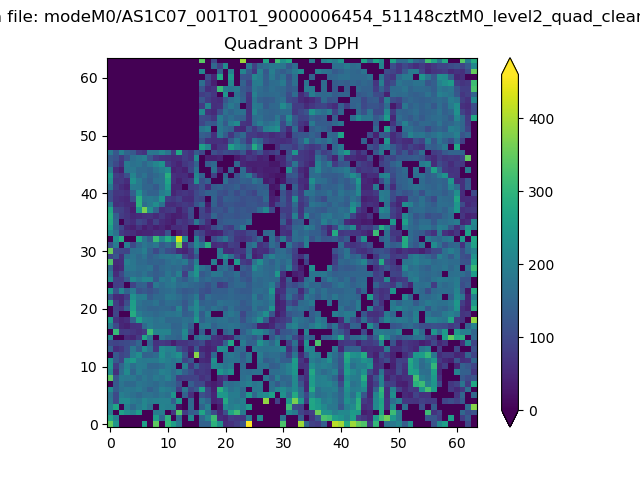 |
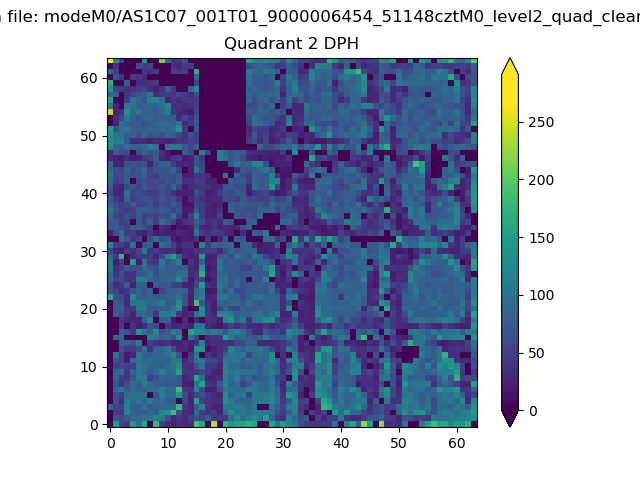 |
Quadrant C |
| Plot type | Count rate plots | Images |
|---|---|---|
| Comparison with Poisson distribution Blue bars denote a histogram of data divided into 1 sec bins. Red curve is a Poisson curve with rate = median count rate of data. |
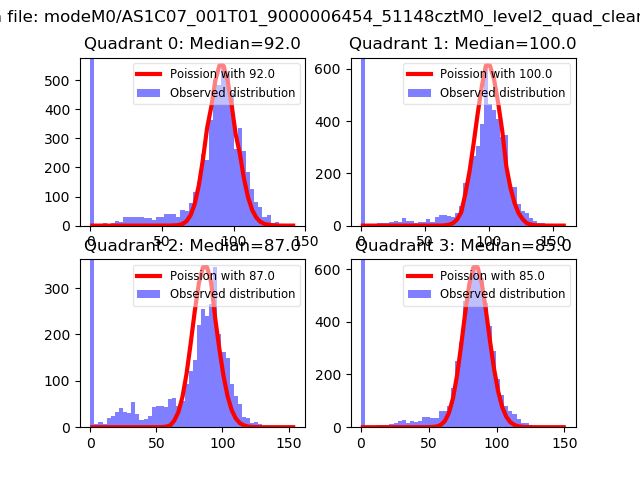 |
 |
| Quadrant-wise count rates Data is divided into 100 sec bins |
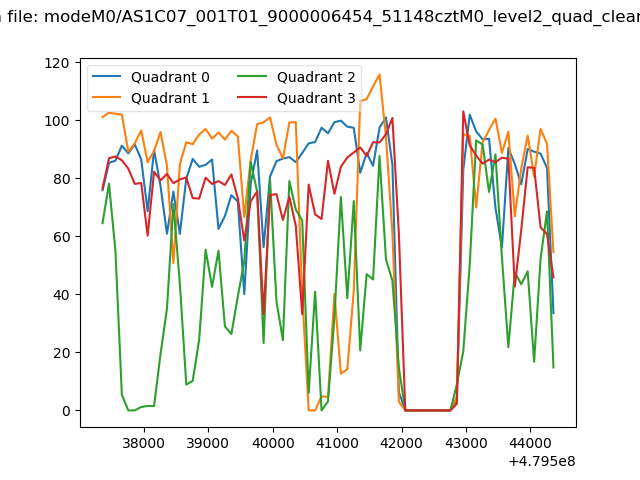 |
|
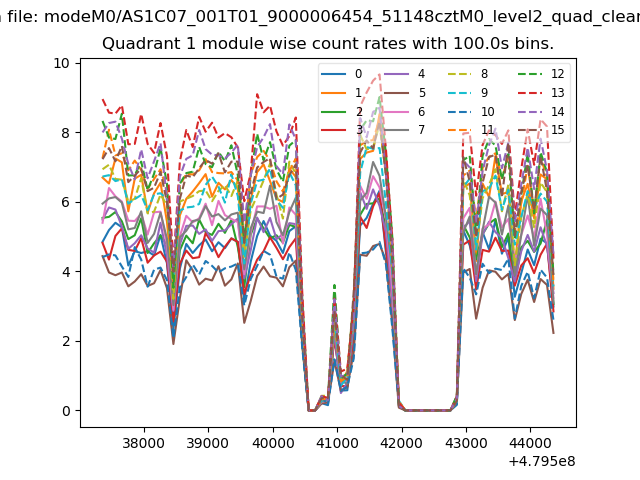
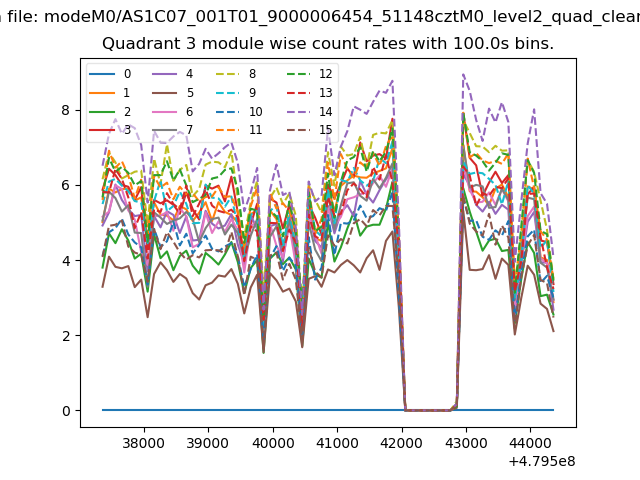
| Module-wise count rates for Quadrant A Data is divided into 100 sec bins |
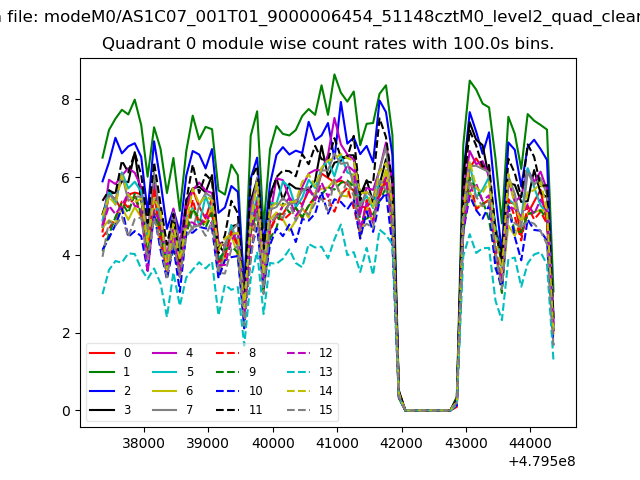 |
 |
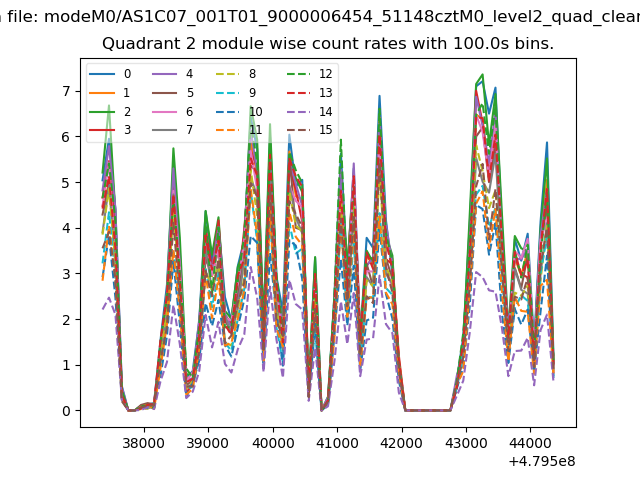
| Module-wise count rates for Quadrant B Data is divided into 100 sec bins |
 |
 |
| Module-wise count rates for Quadrant C Data is divided into 100 sec bins |
 |
 |
| Module-wise count rates for Quadrant D Data is divided into 100 sec bins |
 |
 |
| Parameter | Plot |
|---|---|
| CZT HV Monitor | 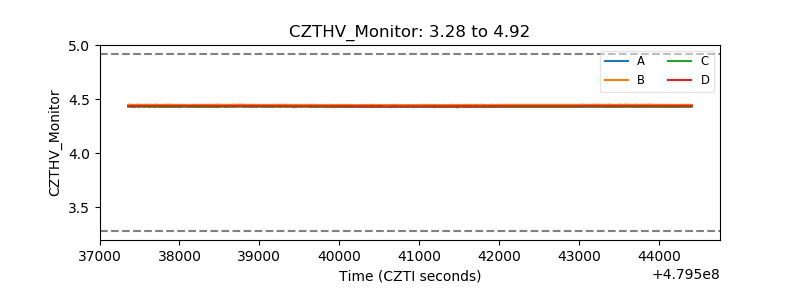 |
| D_VDD | 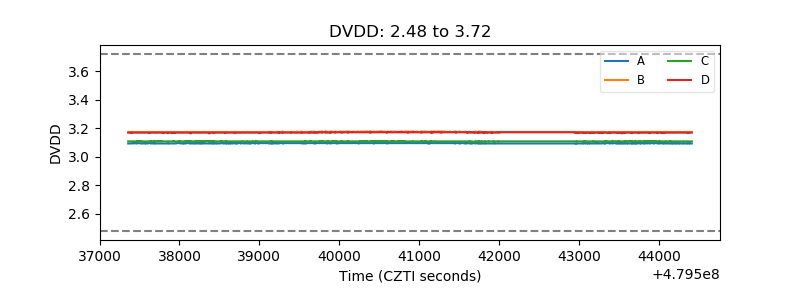 |
| Temperature 1 | 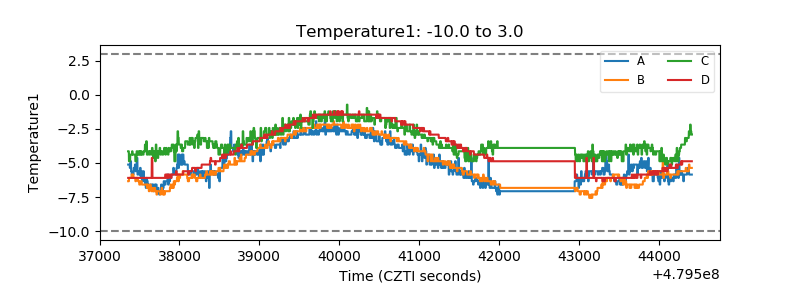 |
| Veto HV Monitor | 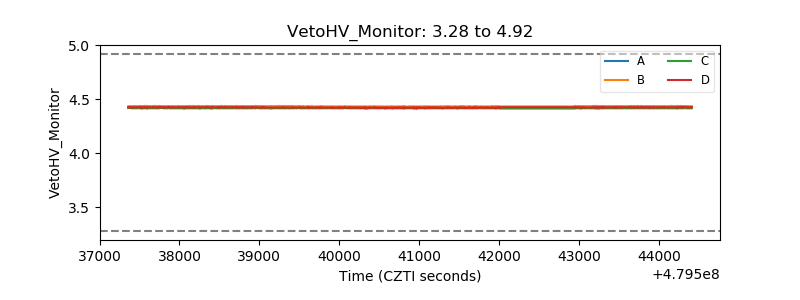 |
| Veto LLD | 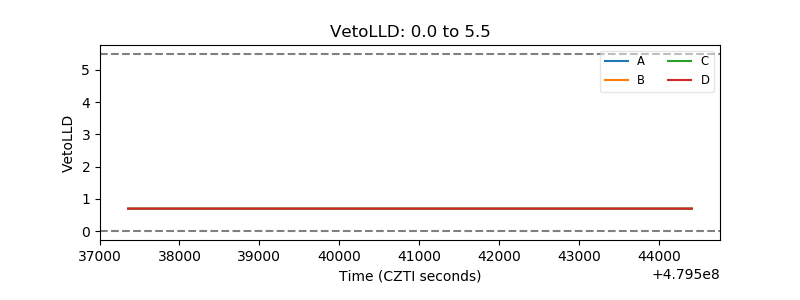 |
| Alpha Counter | 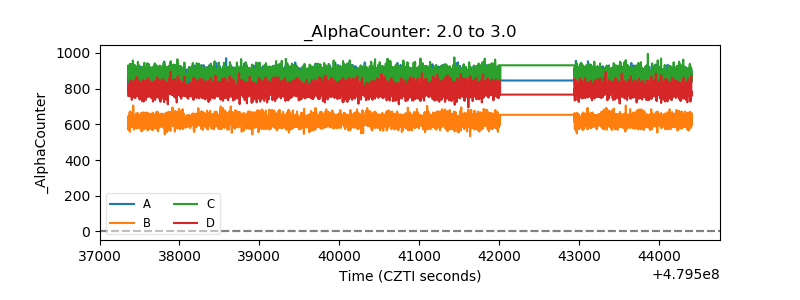 |
| _CPM_Rate | 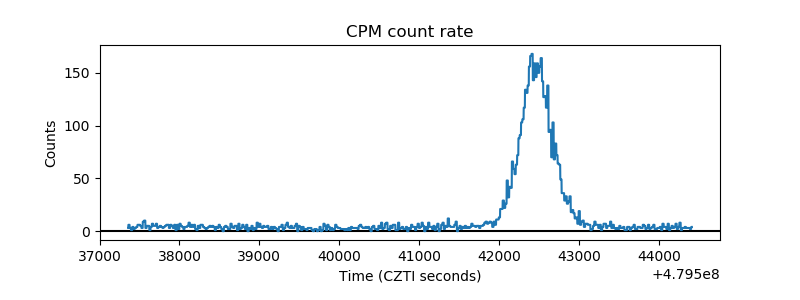 |
| CZT Counter | 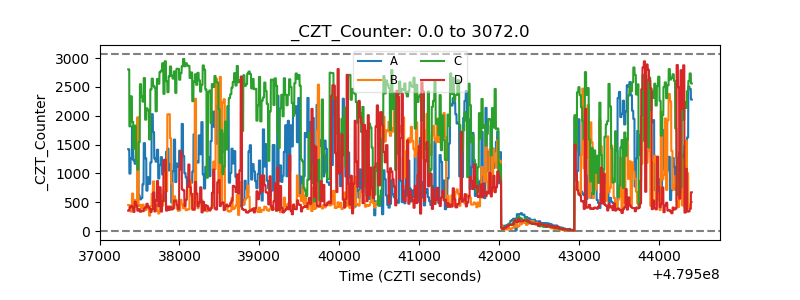 |
| +2.5 Volts monitor | 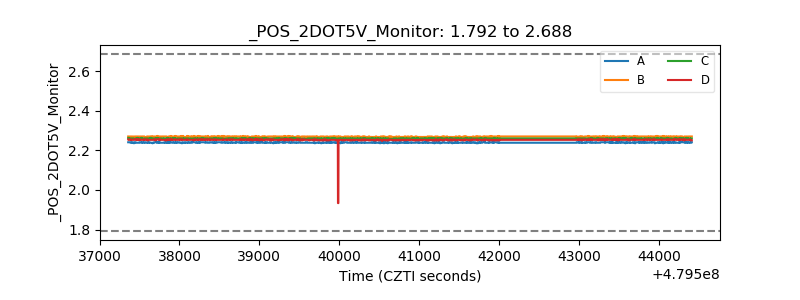 |
| +5 Volts monitor | 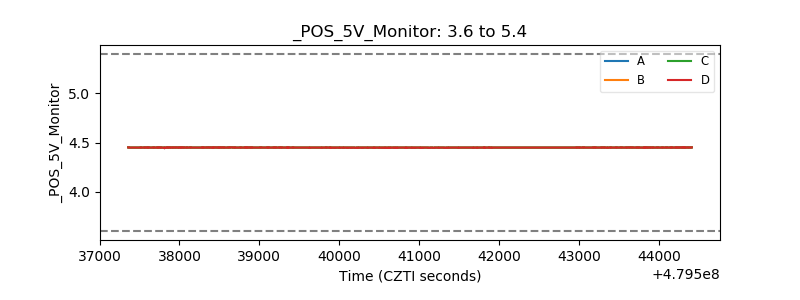 |
| _ROLL_ROT | 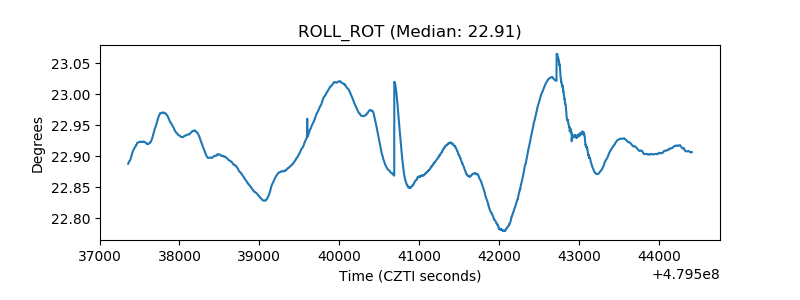 |
| _Roll_DEC | 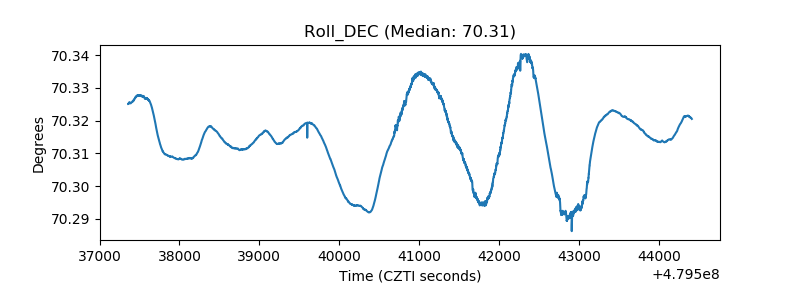 |
| _Roll_RA | 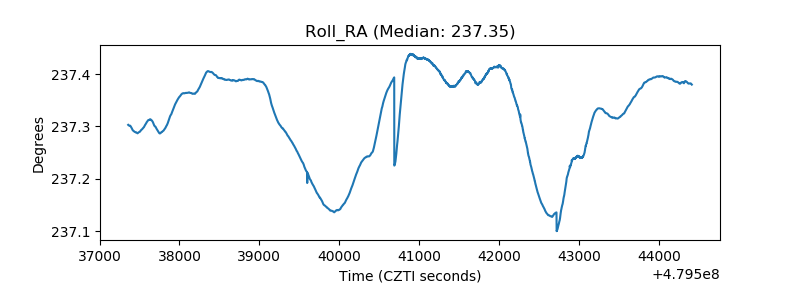 |
| Veto Counter | 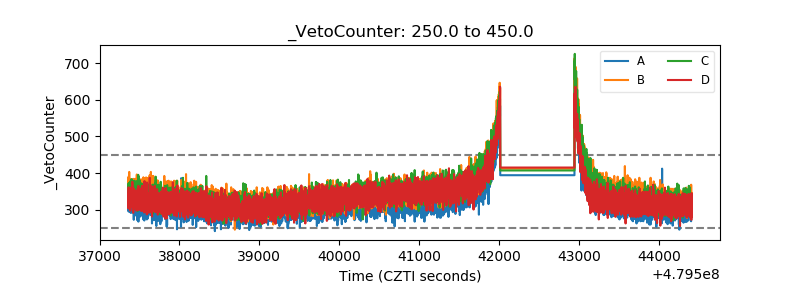 |