| Param | Original file | Final file |
|---|---|---|
| Filename | modeM0/AS1C07_001T01_9000006454_51149cztM0_level2.fits | modeM0/AS1C07_001T01_9000006454_51149cztM0_level2_quad_clean.evt |
| Size (bytes) | 825,171,840 | 83,724,480 |
| Size | 786.9 MB | 79.8 MB |
| Events in quadrant A | 9,993,755 | 489,162 |
| Events in quadrant B | 6,877,512 | 511,767 |
| Events in quadrant C | 8,526,572 | 511,659 |
| Events in quadrant D | 4,628,852 | 554,714 |
| Mode M0 | |||
|---|---|---|---|
| Quadrant | BADHDUFLAG | Total packets | Discarded packets |
| A | 0 | 34399 | 1 |
| B | 0 | 25052 | 1 |
| C | 0 | 29887 | 1 |
| D | 0 | 18635 | 1 |
| Mode SS | |||
|---|---|---|---|
| Quadrant | BADHDUFLAG | Total packets | Discarded packets |
| A | 0 | 136 | 0 |
| B | 0 | 136 | 0 |
| C | 0 | 136 | 0 |
| D | 0 | 136 | 0 |
| Mode M9 | |||
|---|---|---|---|
| Quadrant | BADHDUFLAG | Total packets | Discarded packets |
| A | 0 | 6 | 0 |
| B | 0 | 6 | 0 |
| C | 0 | 6 | 0 |
| D | 0 | 6 | 0 |
| Quadrant | Total seconds | Saturated seconds | Saturation percentage |
|---|---|---|---|
| A | 6707 | 1784 | 26.599076% |
| B | 6708 | 1972 | 29.397734% |
| C | 6708 | 1397 | 20.825880% |
| D | 6708 | 407 | 6.067382% |
Noise dominated data is calculated using 1-second bins in cleaned event files. If a bin has >2000 counts, and if more than 50% of those come from <1% of pixels, then it is considered to be noise-dominated and hence unusable.
| Quadrant | # 1 sec bins | Bins with >0 counts | Bins with >2000 counts | High rate bins dominated by noise | Noise dominated (total time) | Noise dominated (detector-on time) | Marked lightcurve |
|---|---|---|---|---|---|---|---|
| A | 7282 | 6708 | 1573 | 1573 | 21.60% | 23.45% | 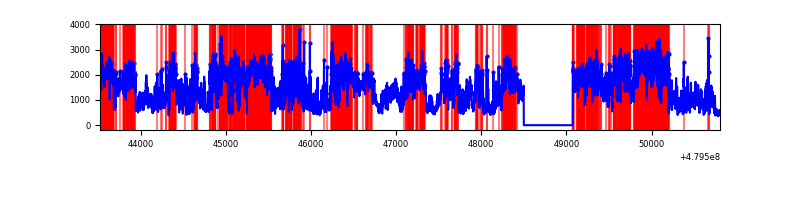 |
| B | 7283 | 6709 | 869 | 869 | 11.93% | 12.95% | 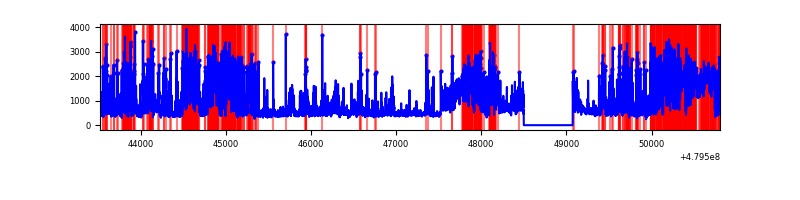 |
| C | 7283 | 6709 | 1401 | 1401 | 19.24% | 20.88% | 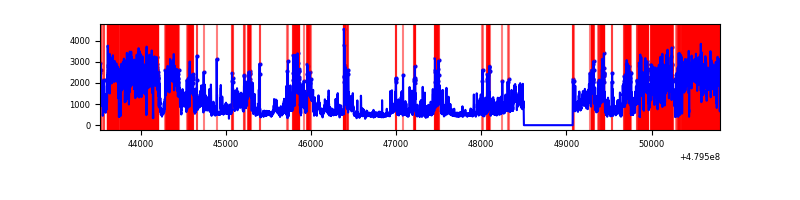 |
| D | 7283 | 6709 | 283 | 283 | 3.89% | 4.22% | 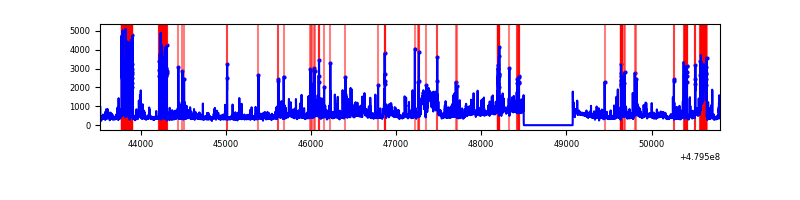 |
Top three noisy pixels from each quadrant. If the there are fewer than three noisy pixels in the level2.evt file, extra rows are filled as -1
| Pixel properties | Quadrant properties | ||||||
|---|---|---|---|---|---|---|---|
| Quadrant | DetID | PixID | Counts | Sigma | Mean | Median | Sigma |
| A | 12 | 80 | 4405499 | 27235.36 | 654 | 639 | 161.7 |
| A | 12 | 3 | 2091853 | 12930.03 | 654 | 639 | 161.7 |
| A | 12 | 194 | 242446 | 1495.1 | 654 | 639 | 161.7 |
| B | 12 | 32 | 3522749 | 27177.87 | 609 | 588 | 129.6 |
| B | 4 | 171 | 312376 | 2405.83 | 609 | 588 | 129.6 |
| B | 5 | 185 | 206940 | 1592.26 | 609 | 588 | 129.6 |
| C | 12 | 247 | 4809889 | 26959.03 | 647 | 641 | 178.4 |
| C | 9 | 38 | 263822 | 1475.3 | 647 | 641 | 178.4 |
| C | 10 | 171 | 200339 | 1119.44 | 647 | 641 | 178.4 |
| D | 2 | 62 | 609224 | 3232.65 | 668 | 644 | 188.3 |
| D | 3 | 12 | 348440 | 1847.42 | 668 | 644 | 188.3 |
| D | 8 | 176 | 227359 | 1204.26 | 668 | 644 | 188.3 |
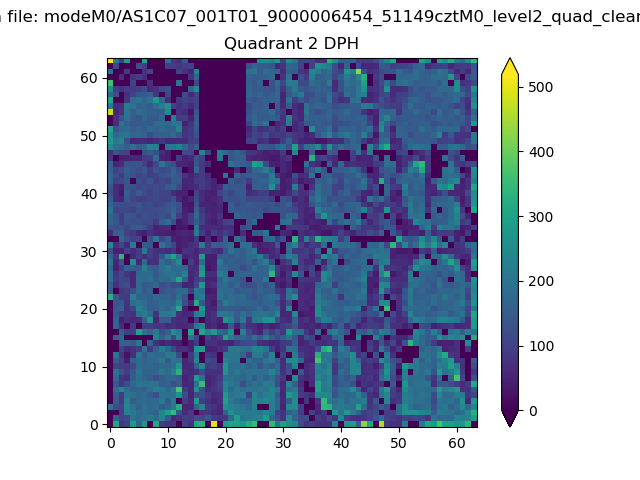
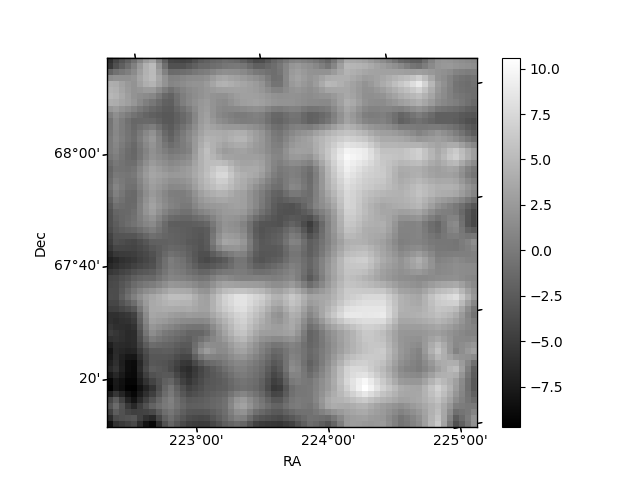
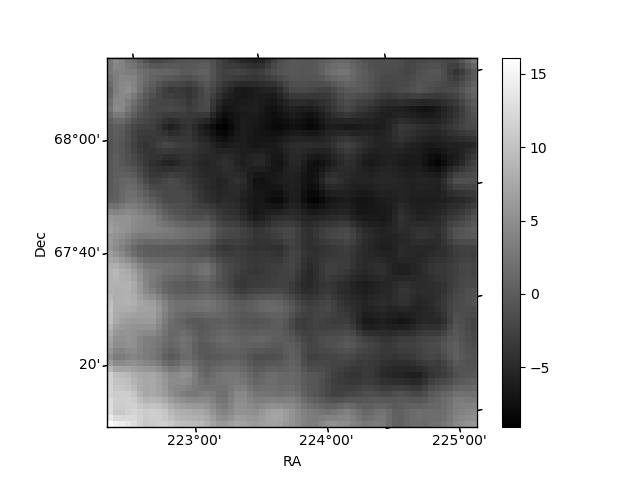
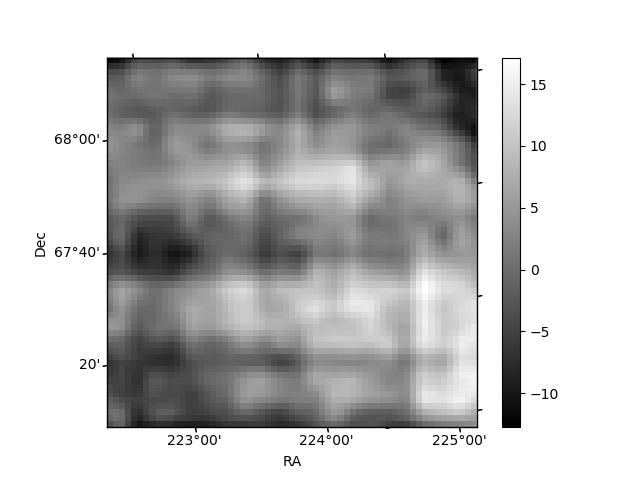
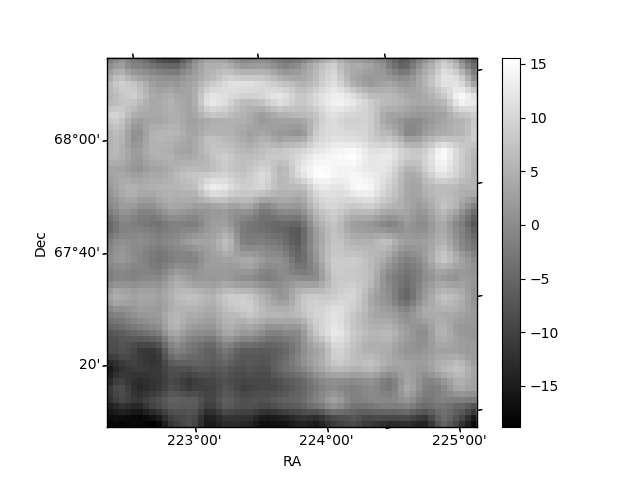
Histogram calculated using DETX and DETY for each event in the final _common_clean file
| Quadrant A | 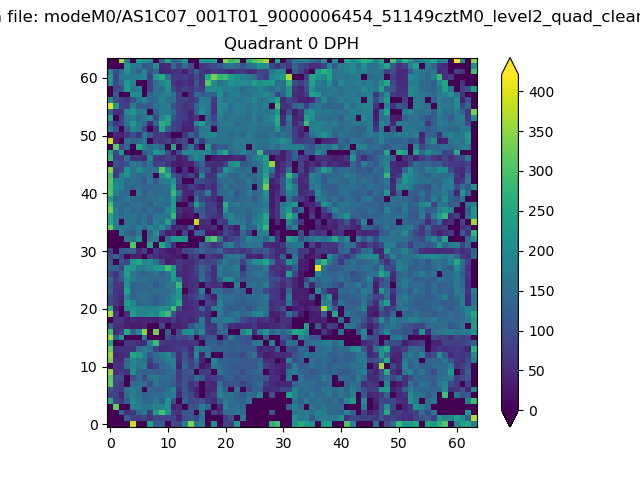 |
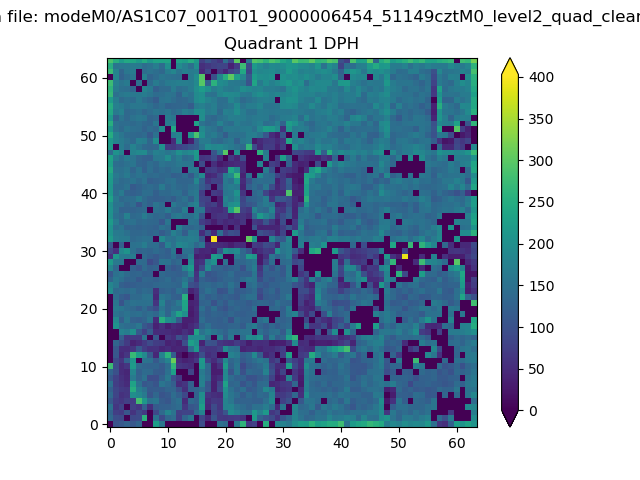 |
Quadrant B |
|---|---|---|---|
| Quadrant D | 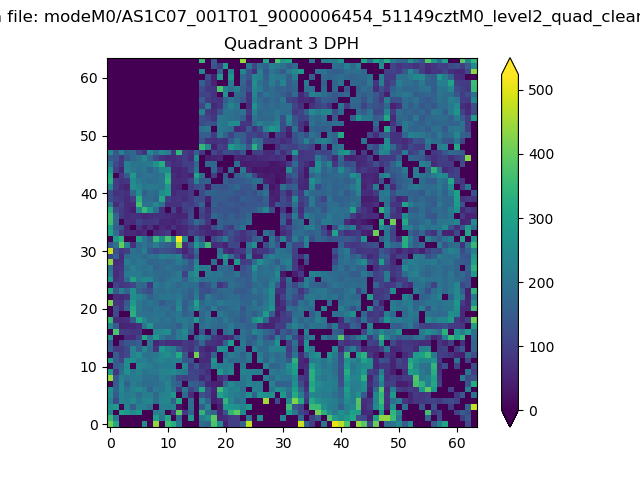 |
 |
Quadrant C |
| Plot type | Count rate plots | Images |
|---|---|---|
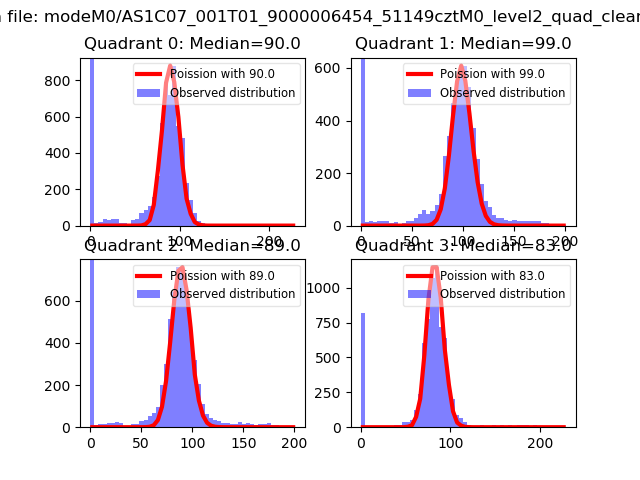
| Comparison with Poisson distribution Blue bars denote a histogram of data divided into 1 sec bins. Red curve is a Poisson curve with rate = median count rate of data. |
 |
 |
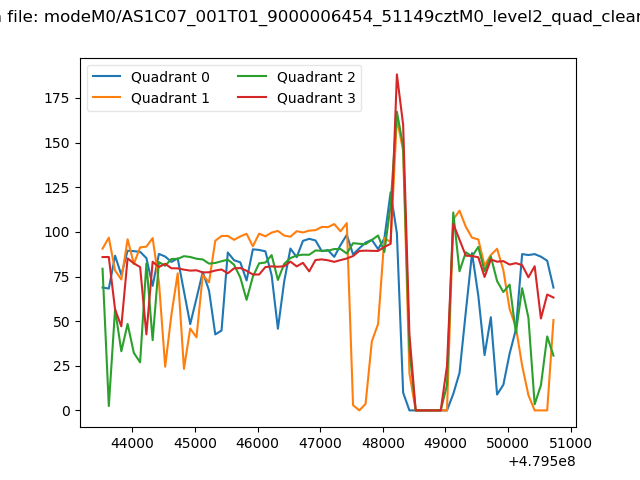
| Quadrant-wise count rates Data is divided into 100 sec bins |
 |
|
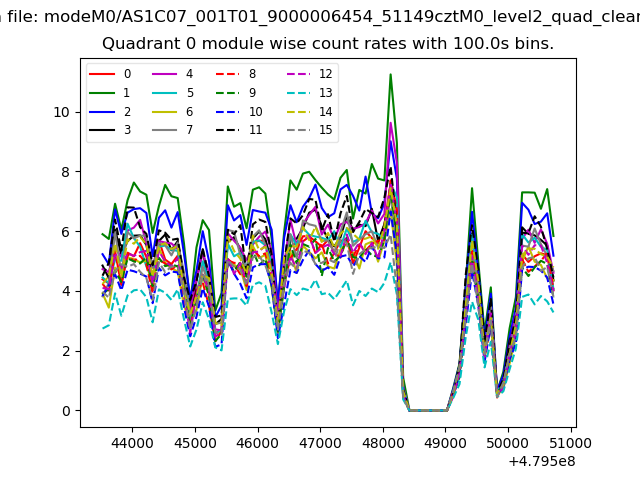
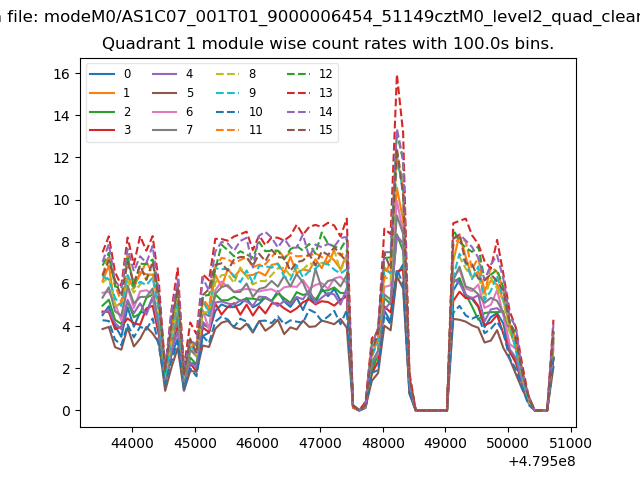
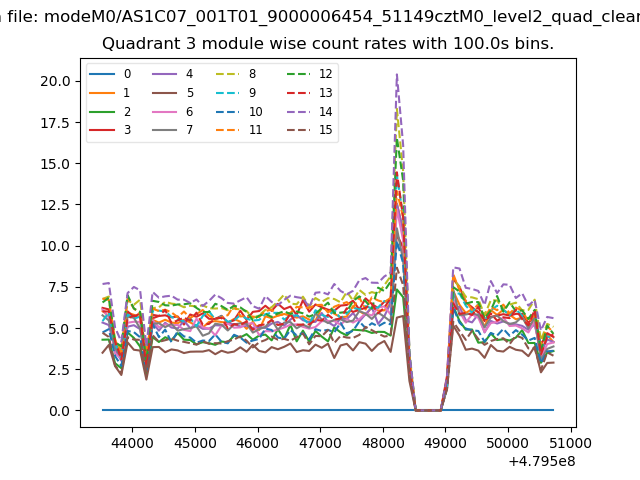
| Module-wise count rates for Quadrant A Data is divided into 100 sec bins |
 |
 |
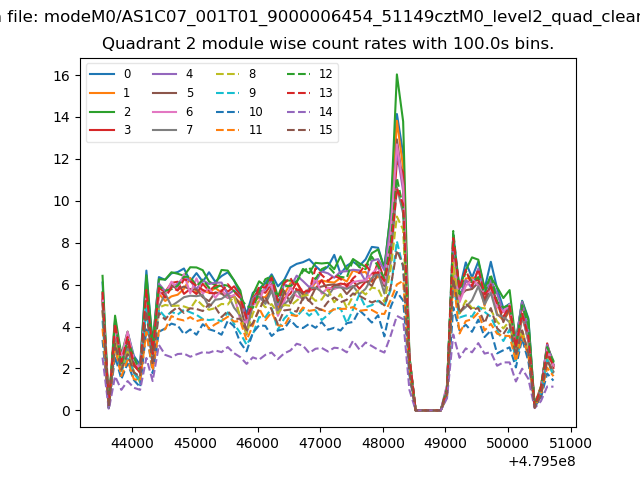
| Module-wise count rates for Quadrant B Data is divided into 100 sec bins |
 |
 |
| Module-wise count rates for Quadrant C Data is divided into 100 sec bins |
 |
 |
| Module-wise count rates for Quadrant D Data is divided into 100 sec bins |
 |
 |
| Parameter | Plot |
|---|---|
| CZT HV Monitor |  |
| D_VDD | 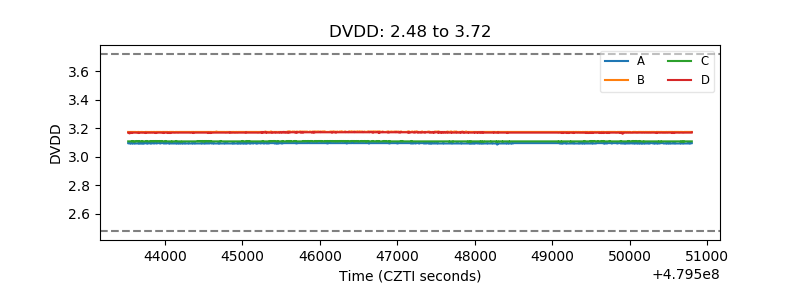 |
| Temperature 1 | 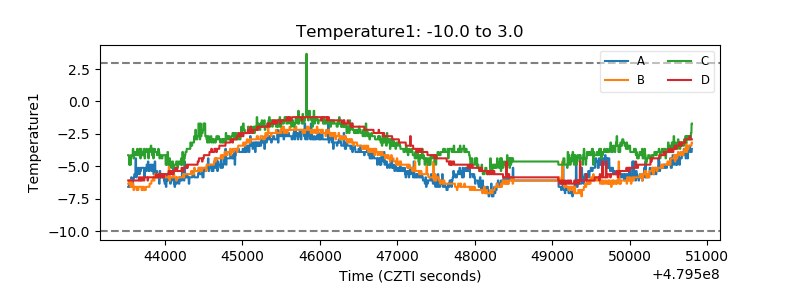 |
| Veto HV Monitor |  |
| Veto LLD | 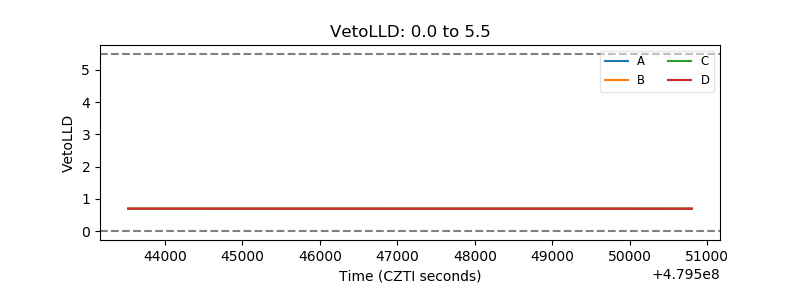 |
| Alpha Counter | 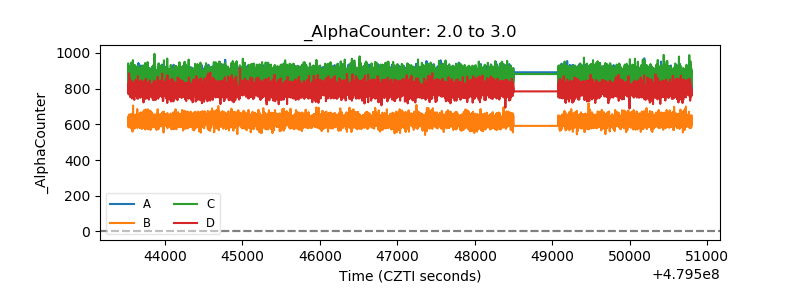 |
| _CPM_Rate | 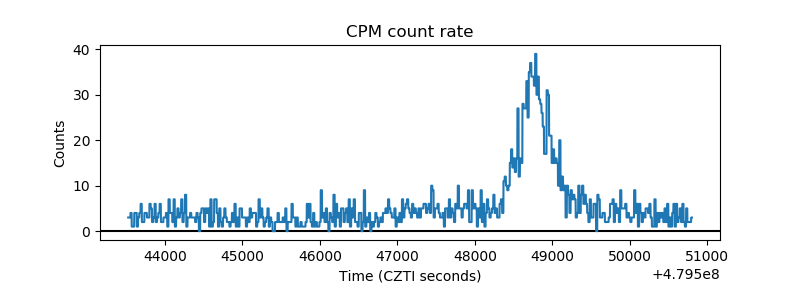 |
| CZT Counter | 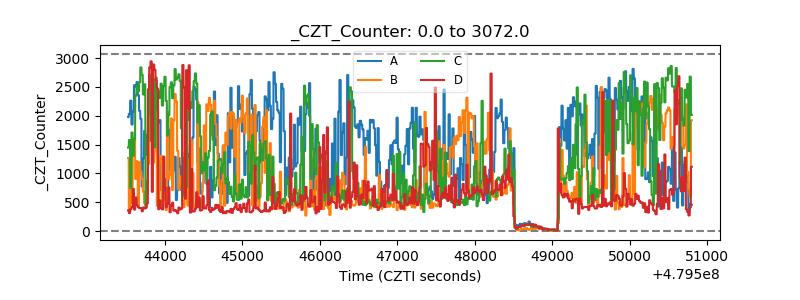 |
| +2.5 Volts monitor | 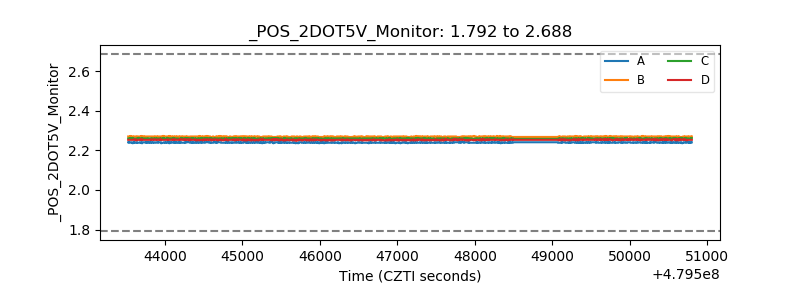 |
| +5 Volts monitor | 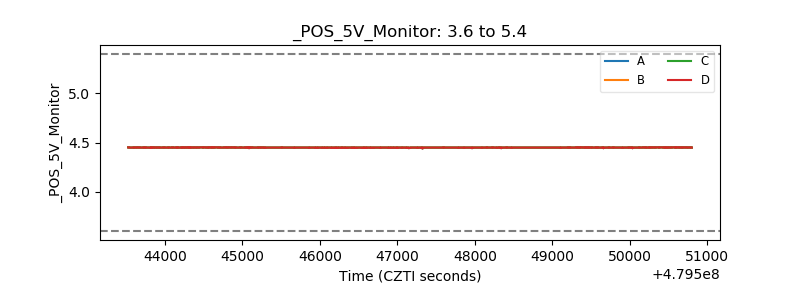 |
| _ROLL_ROT | 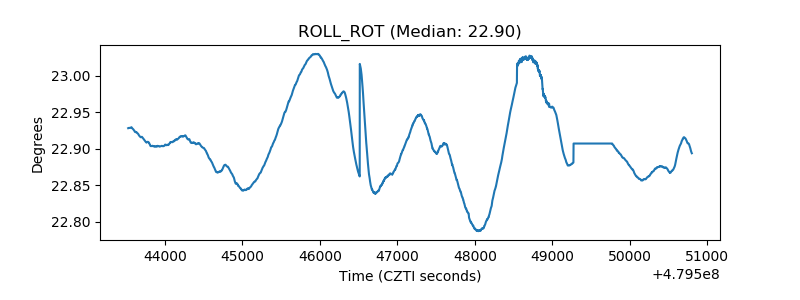 |
| _Roll_DEC | 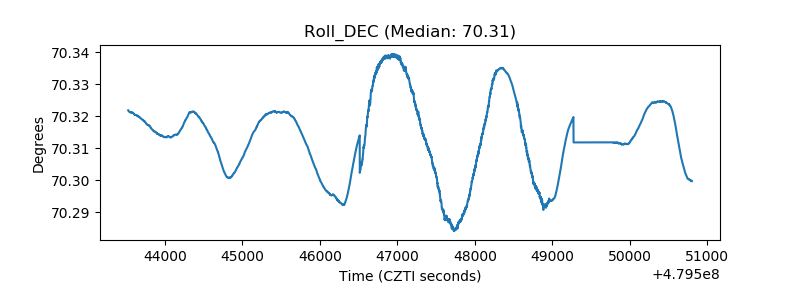 |
| _Roll_RA | 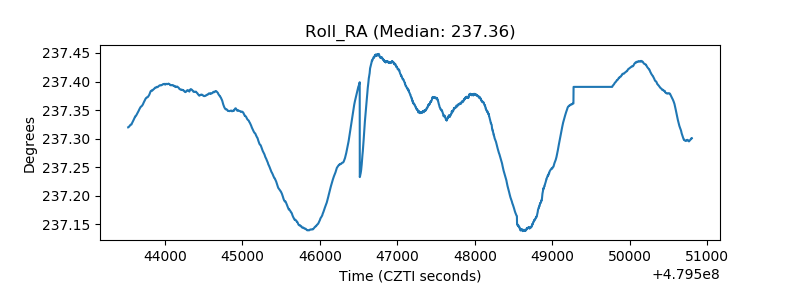 |
| Veto Counter | 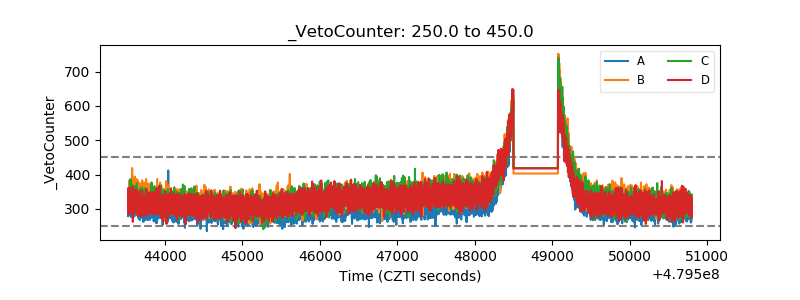 |