| Param | Original file | Final file |
|---|---|---|
| Filename | modeM0/AS1C07_001T01_9000006454_51150cztM0_level2.fits | modeM0/AS1C07_001T01_9000006454_51150cztM0_level2_quad_clean.evt |
| Size (bytes) | 839,185,920 | 87,713,280 |
| Size | 800.3 MB | 83.6 MB |
| Events in quadrant A | 7,916,169 | 566,367 |
| Events in quadrant B | 6,092,361 | 606,114 |
| Events in quadrant C | 12,139,629 | 391,555 |
| Events in quadrant D | 4,360,167 | 591,301 |
| Mode M0 | |||
|---|---|---|---|
| Quadrant | BADHDUFLAG | Total packets | Discarded packets |
| A | 0 | 28529 | 2 |
| B | 0 | 23071 | 0 |
| C | 0 | 40995 | 0 |
| D | 0 | 18151 | 0 |
| Mode SS | |||
|---|---|---|---|
| Quadrant | BADHDUFLAG | Total packets | Discarded packets |
| A | 0 | 144 | 0 |
| B | 0 | 144 | 0 |
| C | 0 | 144 | 0 |
| D | 0 | 144 | 0 |
| Quadrant | Total seconds | Saturated seconds | Saturation percentage |
|---|---|---|---|
| A | 7180 | 1231 | 17.144847% |
| B | 7180 | 1339 | 18.649025% |
| C | 7181 | 3141 | 43.740426% |
| D | 7181 | 224 | 3.119343% |
Noise dominated data is calculated using 1-second bins in cleaned event files. If a bin has >2000 counts, and if more than 50% of those come from <1% of pixels, then it is considered to be noise-dominated and hence unusable.
| Quadrant | # 1 sec bins | Bins with >0 counts | Bins with >2000 counts | High rate bins dominated by noise | Noise dominated (total time) | Noise dominated (detector-on time) | Marked lightcurve |
|---|---|---|---|---|---|---|---|
| A | 7180 | 7180 | 772 | 772 | 10.75% | 10.75% | 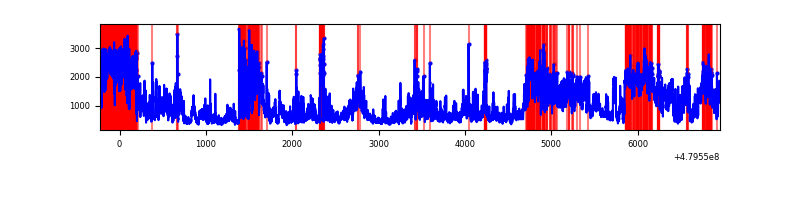 |
| B | 7180 | 7180 | 529 | 529 | 7.37% | 7.37% | 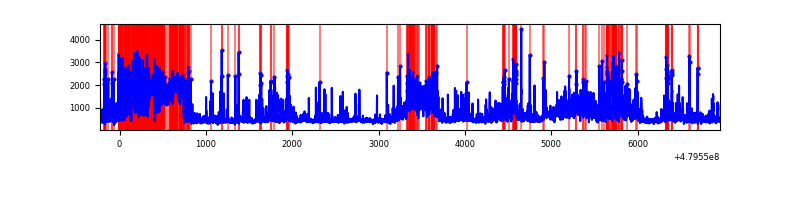 |
| C | 7181 | 7181 | 2916 | 2916 | 40.61% | 40.61% | 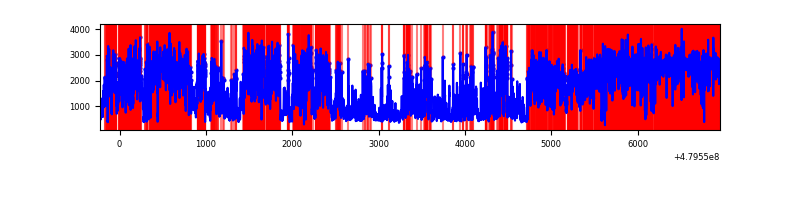 |
| D | 7181 | 7181 | 182 | 182 | 2.53% | 2.53% | 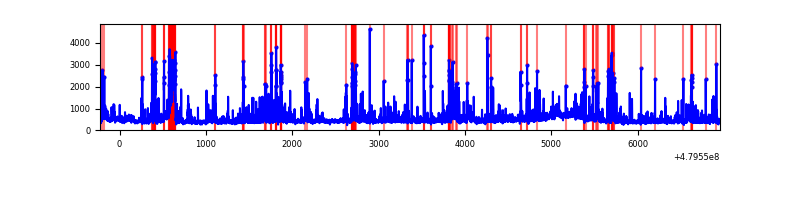 |
Top three noisy pixels from each quadrant. If the there are fewer than three noisy pixels in the level2.evt file, extra rows are filled as -1
| Pixel properties | Quadrant properties | ||||||
|---|---|---|---|---|---|---|---|
| Quadrant | DetID | PixID | Counts | Sigma | Mean | Median | Sigma |
| A | 12 | 80 | 2315994 | 13000.04 | 723 | 705 | 178.1 |
| A | 12 | 3 | 1734740 | 9736.38 | 723 | 705 | 178.1 |
| A | 12 | 194 | 199552 | 1116.5 | 723 | 705 | 178.1 |
| B | 12 | 32 | 2291579 | 15529.34 | 691 | 666 | 147.5 |
| B | 4 | 171 | 300334 | 2031.35 | 691 | 666 | 147.5 |
| B | 5 | 185 | 194932 | 1316.87 | 691 | 666 | 147.5 |
| C | 12 | 247 | 8300313 | 48248.27 | 624 | 618 | 172.0 |
| C | 13 | 3 | 597827 | 3471.73 | 624 | 618 | 172.0 |
| C | 4 | 13 | 118567 | 685.67 | 624 | 618 | 172.0 |
| D | 3 | 12 | 415598 | 2052.18 | 724 | 699 | 202.2 |
| D | 11 | 176 | 213927 | 1054.67 | 724 | 699 | 202.2 |
| D | 2 | 249 | 137923 | 678.74 | 724 | 699 | 202.2 |
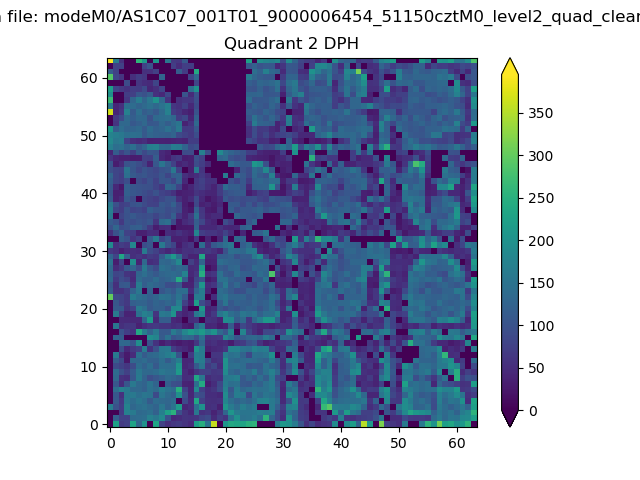
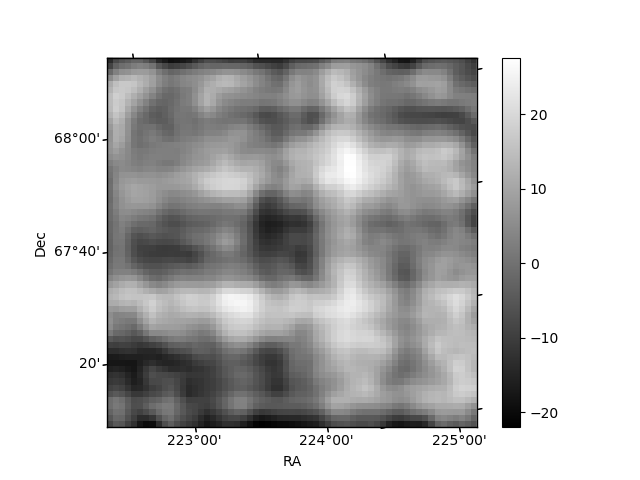
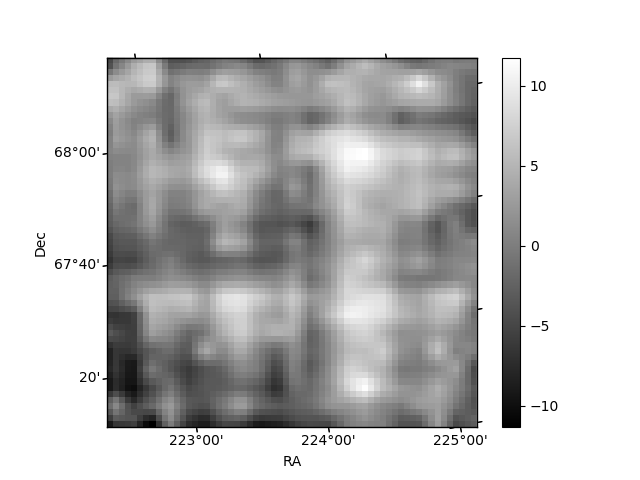
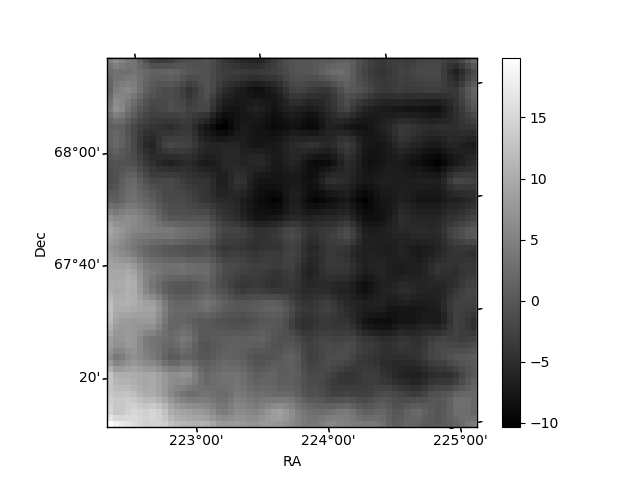
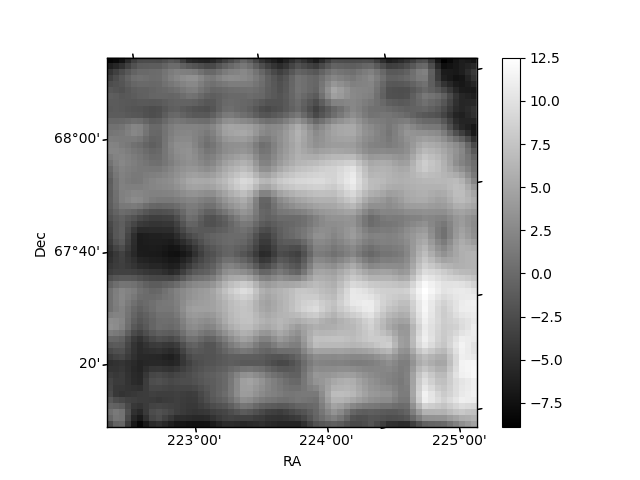
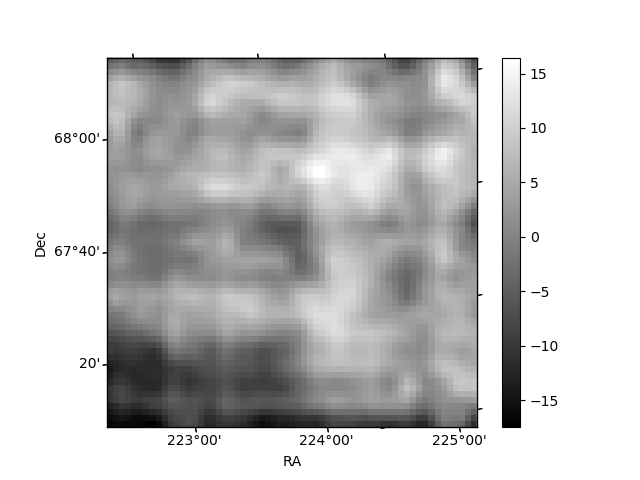
Histogram calculated using DETX and DETY for each event in the final _common_clean file
| Quadrant A | 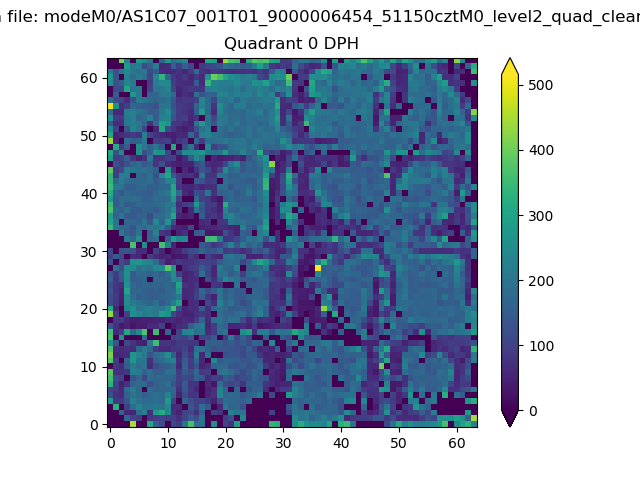 |
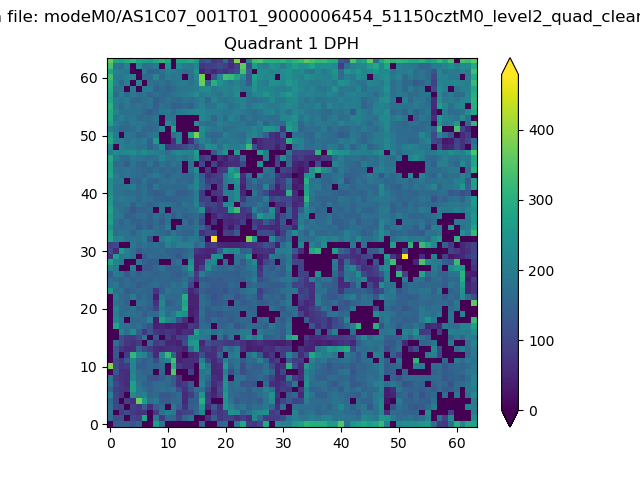 |
Quadrant B |
|---|---|---|---|
| Quadrant D | 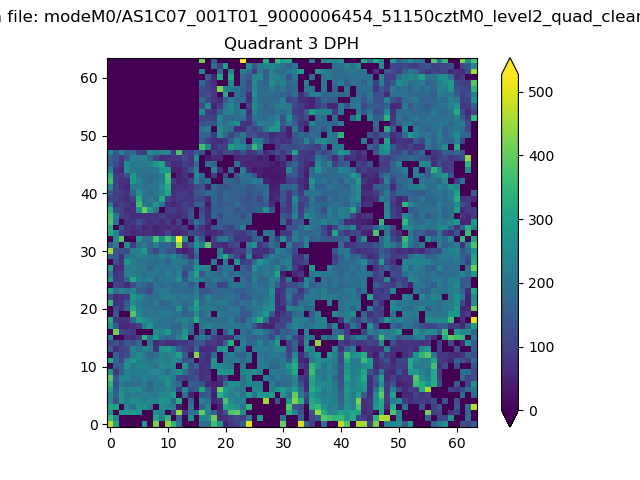 |
 |
Quadrant C |
| Plot type | Count rate plots | Images |
|---|---|---|
| Comparison with Poisson distribution Blue bars denote a histogram of data divided into 1 sec bins. Red curve is a Poisson curve with rate = median count rate of data. |
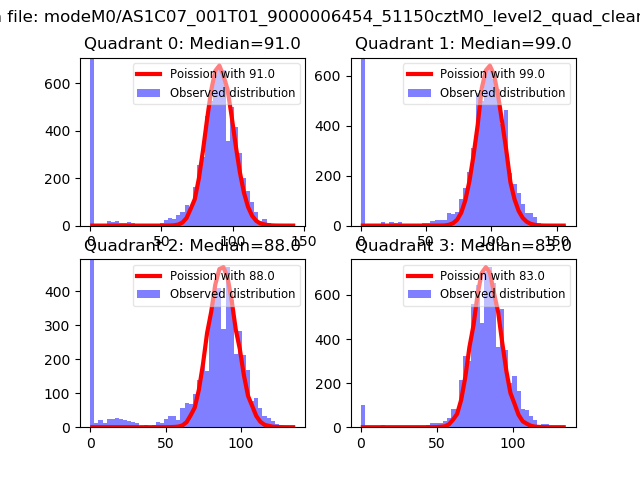 |
 |
| Quadrant-wise count rates Data is divided into 100 sec bins |
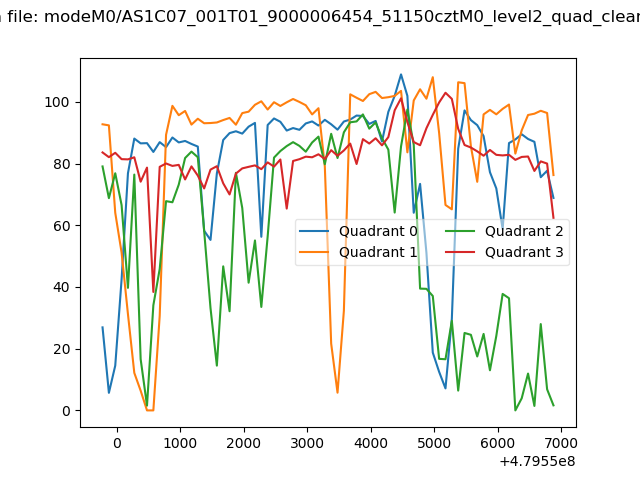 |
|
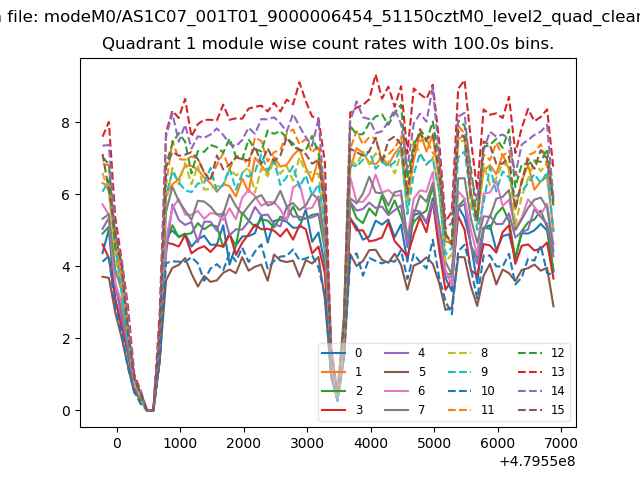
| Module-wise count rates for Quadrant A Data is divided into 100 sec bins |
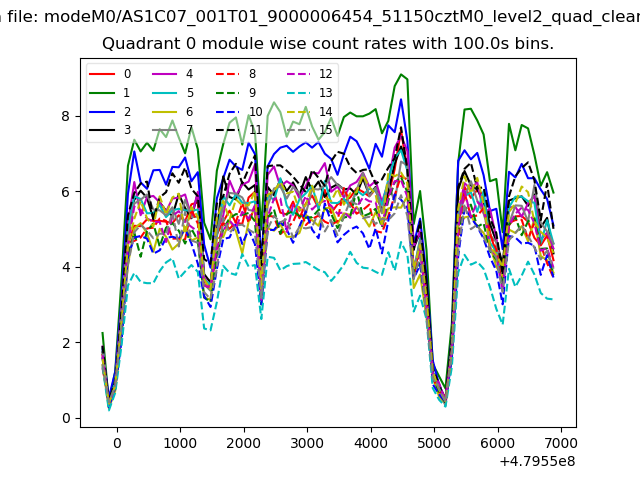 |
 |
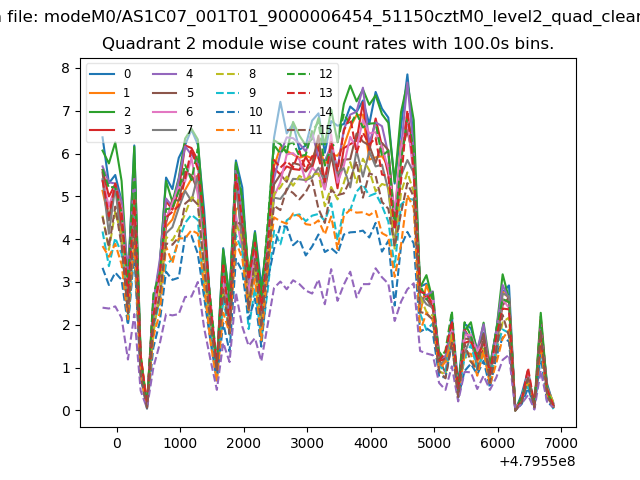
| Module-wise count rates for Quadrant B Data is divided into 100 sec bins |
 |
 |
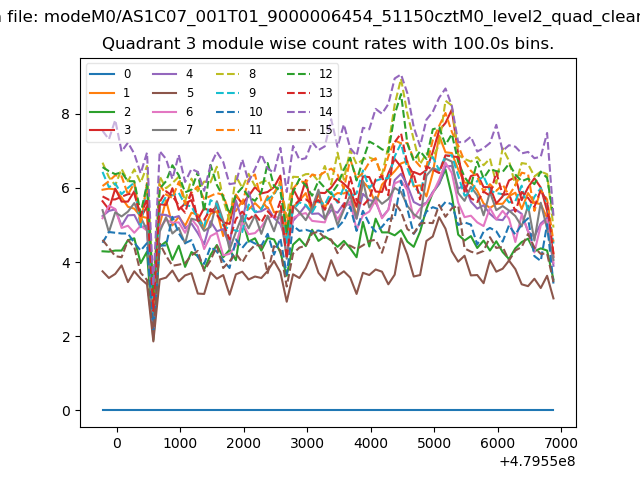
| Module-wise count rates for Quadrant C Data is divided into 100 sec bins |
 |
 |
| Module-wise count rates for Quadrant D Data is divided into 100 sec bins |
 |
 |
| Parameter | Plot |
|---|---|
| CZT HV Monitor | 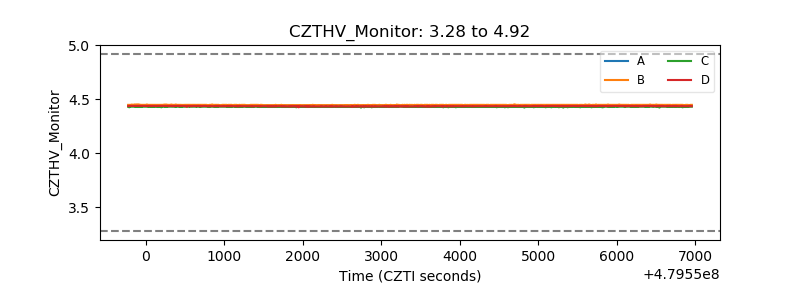 |
| D_VDD | 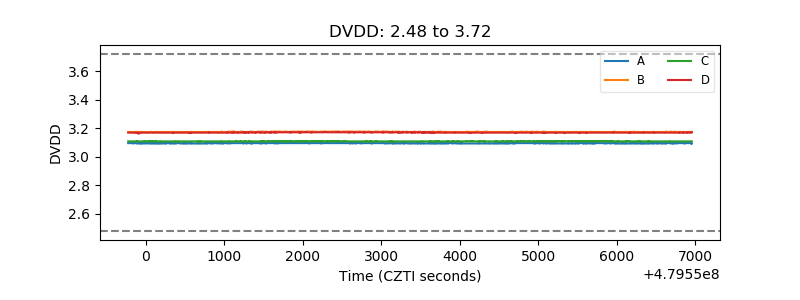 |
| Temperature 1 | 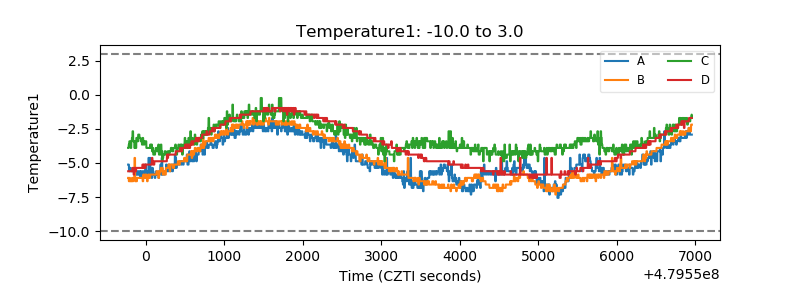 |
| Veto HV Monitor | 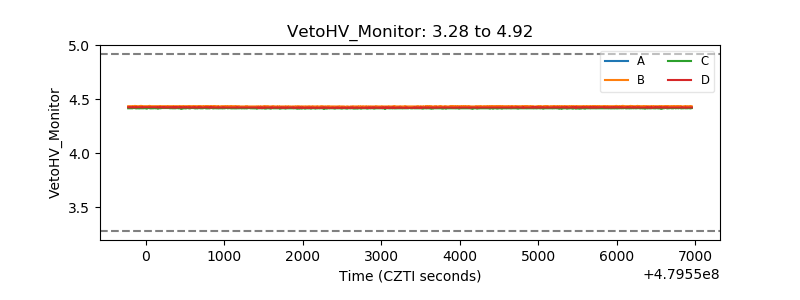 |
| Veto LLD | 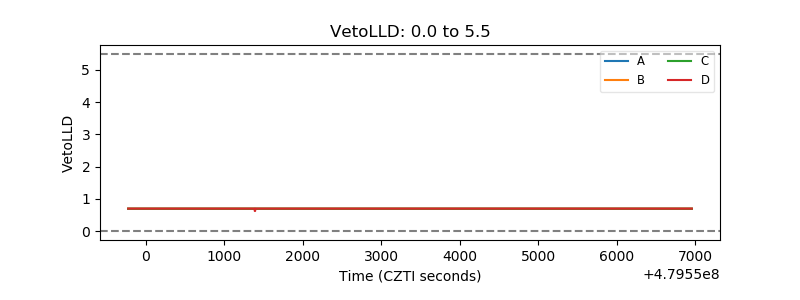 |
| Alpha Counter | 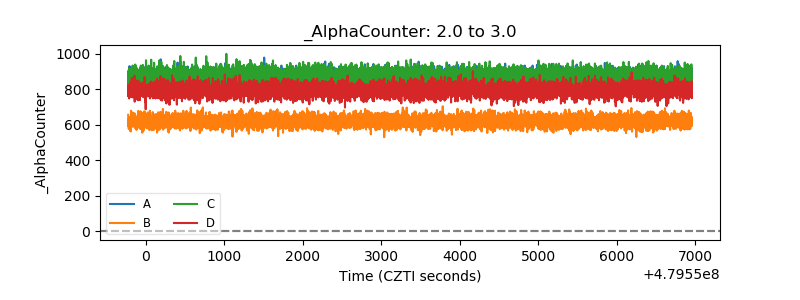 |
| _CPM_Rate | 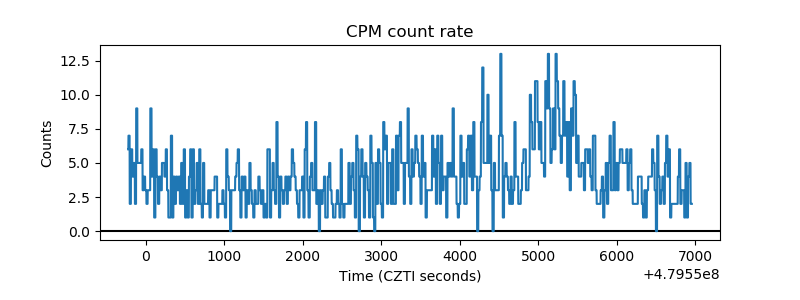 |
| CZT Counter | 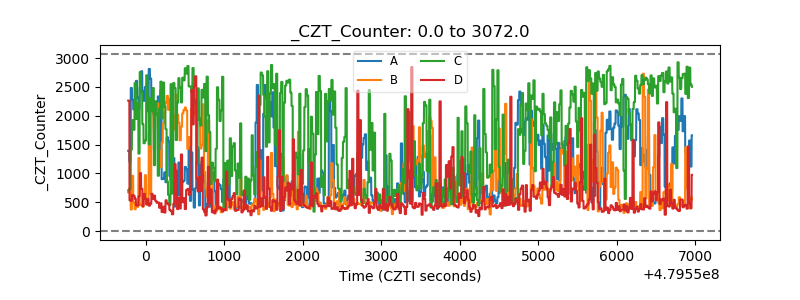 |
| +2.5 Volts monitor | 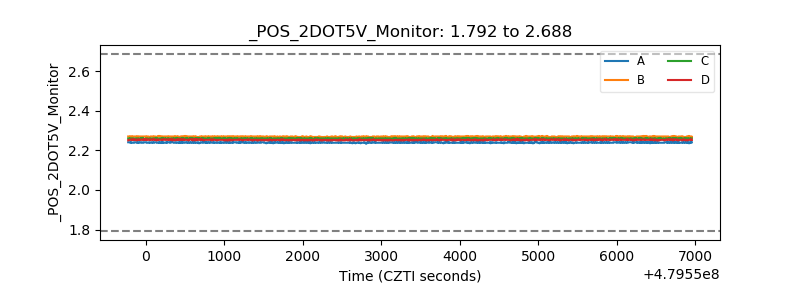 |
| +5 Volts monitor | 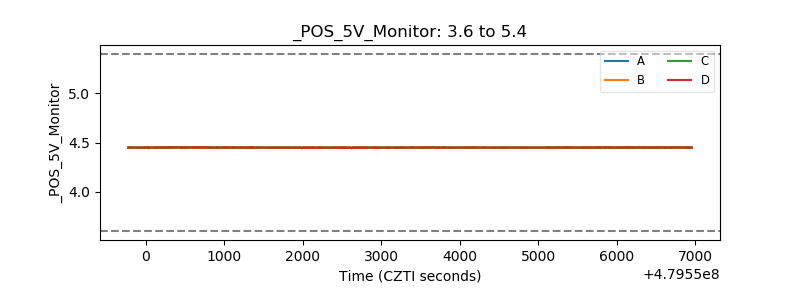 |
| _ROLL_ROT | 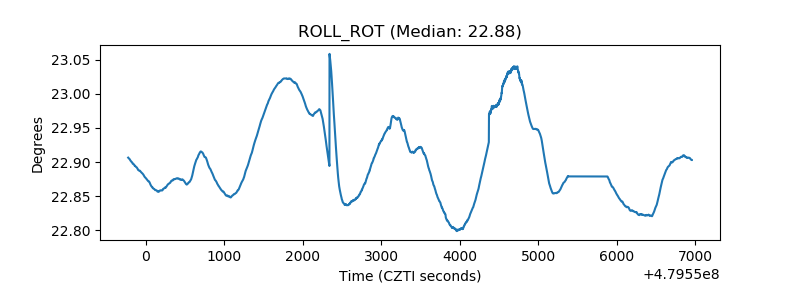 |
| _Roll_DEC | 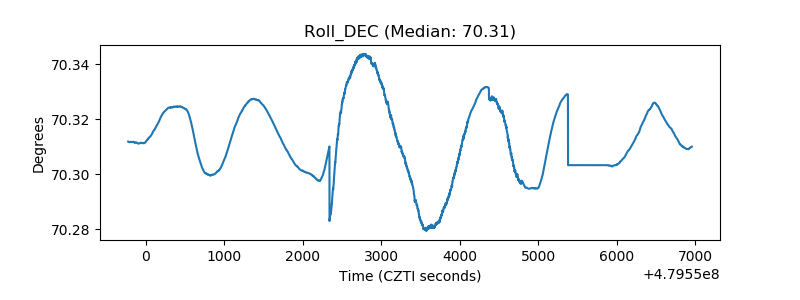 |
| _Roll_RA | 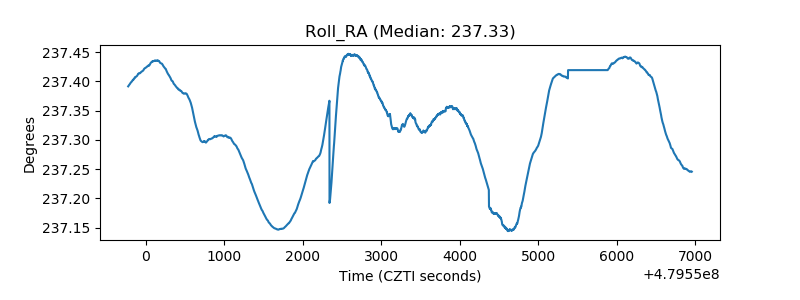 |
| Veto Counter | 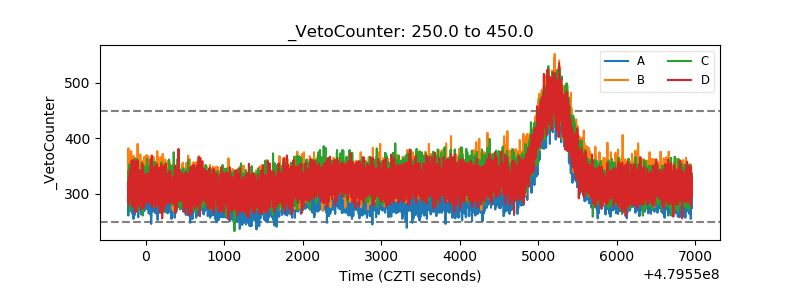 |