| Param | Original file | Final file |
|---|---|---|
| Filename | modeM0/AS1C07_001T01_9000006454_51151cztM0_level2.fits | modeM0/AS1C07_001T01_9000006454_51151cztM0_level2_quad_clean.evt |
| Size (bytes) | 881,124,480 | 93,450,240 |
| Size | 840.3 MB | 89.1 MB |
| Events in quadrant A | 8,722,090 | 653,747 |
| Events in quadrant B | 4,735,530 | 727,281 |
| Events in quadrant C | 14,363,419 | 326,737 |
| Events in quadrant D | 4,224,241 | 606,998 |
| Mode M0 | |||
|---|---|---|---|
| Quadrant | BADHDUFLAG | Total packets | Discarded packets |
| A | 0 | 31077 | 0 |
| B | 0 | 19039 | 0 |
| C | 0 | 47769 | 0 |
| D | 0 | 17816 | 0 |
| Mode SS | |||
|---|---|---|---|
| Quadrant | BADHDUFLAG | Total packets | Discarded packets |
| A | 0 | 148 | 0 |
| B | 0 | 148 | 0 |
| C | 0 | 148 | 0 |
| D | 0 | 148 | 0 |
| Quadrant | Total seconds | Saturated seconds | Saturation percentage |
|---|---|---|---|
| A | 7391 | 557 | 7.536193% |
| B | 7391 | 233 | 3.152483% |
| C | 7391 | 4195 | 56.758219% |
| D | 7391 | 166 | 2.245975% |
Noise dominated data is calculated using 1-second bins in cleaned event files. If a bin has >2000 counts, and if more than 50% of those come from <1% of pixels, then it is considered to be noise-dominated and hence unusable.
| Quadrant | # 1 sec bins | Bins with >0 counts | Bins with >2000 counts | High rate bins dominated by noise | Noise dominated (total time) | Noise dominated (detector-on time) | Marked lightcurve |
|---|---|---|---|---|---|---|---|
| A | 7391 | 7391 | 494 | 494 | 6.68% | 6.68% |  |
| B | 7391 | 7391 | 167 | 167 | 2.26% | 2.26% |  |
| C | 7391 | 7391 | 4065 | 4065 | 55.00% | 55.00% | 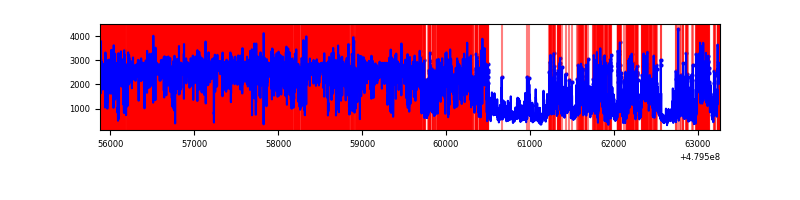 |
| D | 7391 | 7391 | 126 | 126 | 1.70% | 1.70% | 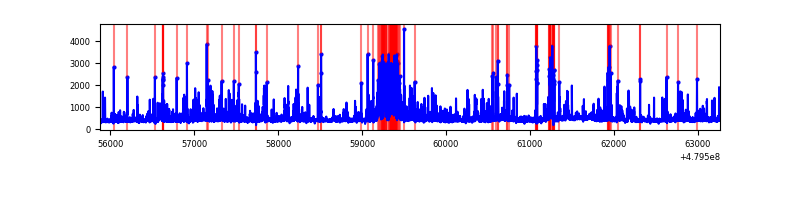 |
Top three noisy pixels from each quadrant. If the there are fewer than three noisy pixels in the level2.evt file, extra rows are filled as -1
| Pixel properties | Quadrant properties | ||||||
|---|---|---|---|---|---|---|---|
| Quadrant | DetID | PixID | Counts | Sigma | Mean | Median | Sigma |
| A | 12 | 80 | 3357298 | 17959.89 | 755 | 736 | 186.9 |
| A | 12 | 3 | 1556474 | 8324.26 | 755 | 736 | 186.9 |
| A | 12 | 194 | 180763 | 963.27 | 755 | 736 | 186.9 |
| B | 5 | 185 | 372262 | 2284.49 | 756 | 728 | 162.6 |
| B | 4 | 171 | 278013 | 1704.97 | 756 | 728 | 162.6 |
| B | 10 | 247 | 235349 | 1442.64 | 756 | 728 | 162.6 |
| C | 12 | 247 | 9417570 | 58607.57 | 585 | 581 | 160.7 |
| C | 4 | 12 | 737351 | 4585.36 | 585 | 581 | 160.7 |
| C | 4 | 13 | 439729 | 2733.08 | 585 | 581 | 160.7 |
| D | 7 | 126 | 435686 | 2113.29 | 732 | 709 | 205.8 |
| D | 3 | 12 | 178623 | 864.38 | 732 | 709 | 205.8 |
| D | 2 | 249 | 109133 | 526.77 | 732 | 709 | 205.8 |
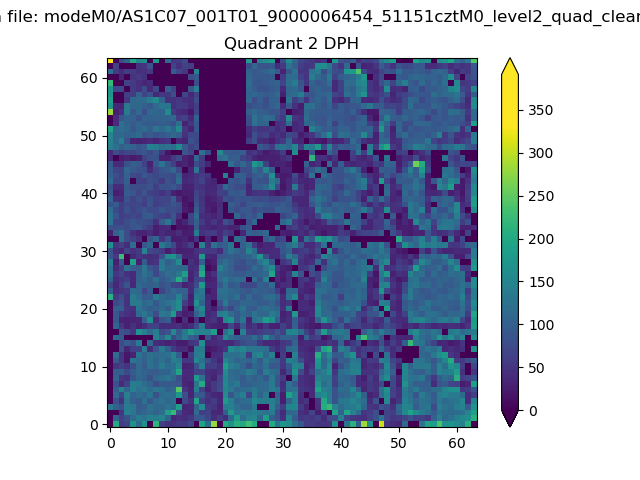
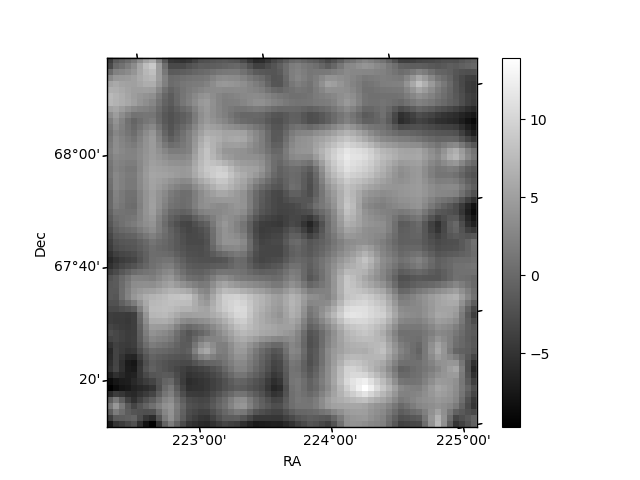
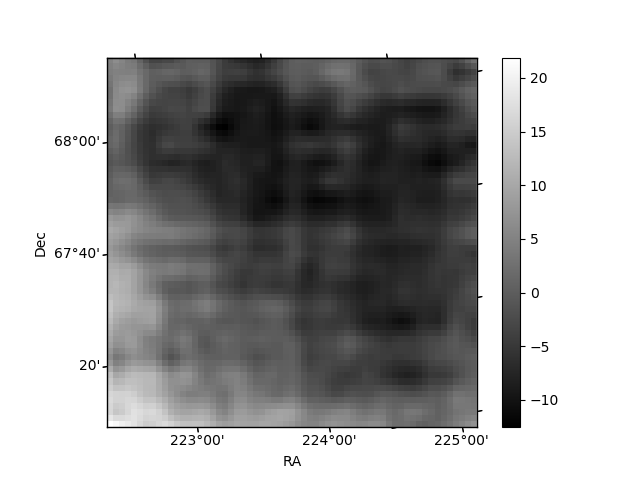
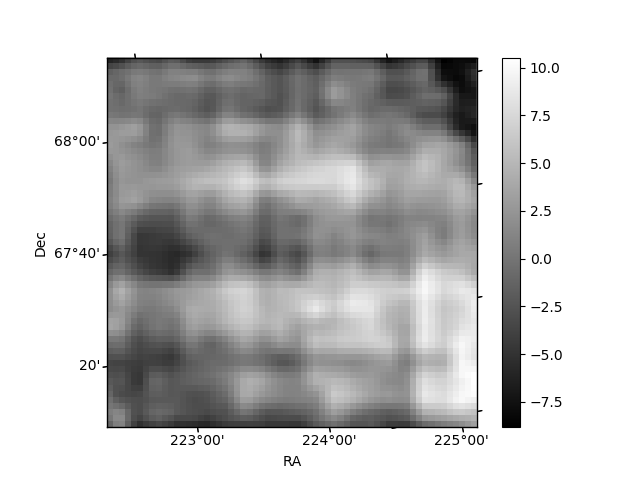
Histogram calculated using DETX and DETY for each event in the final _common_clean file
| Quadrant A | 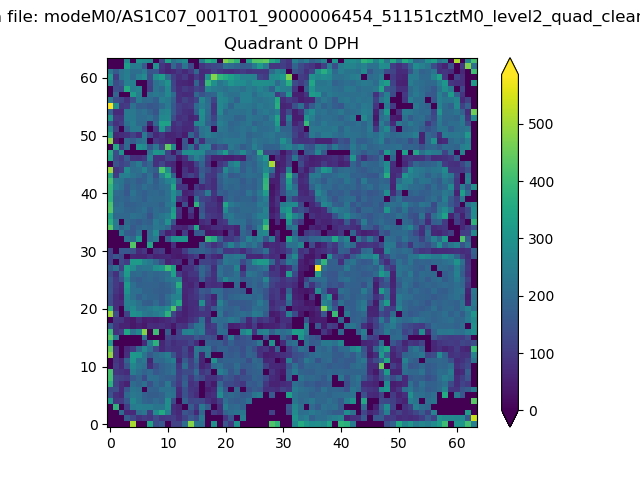 |
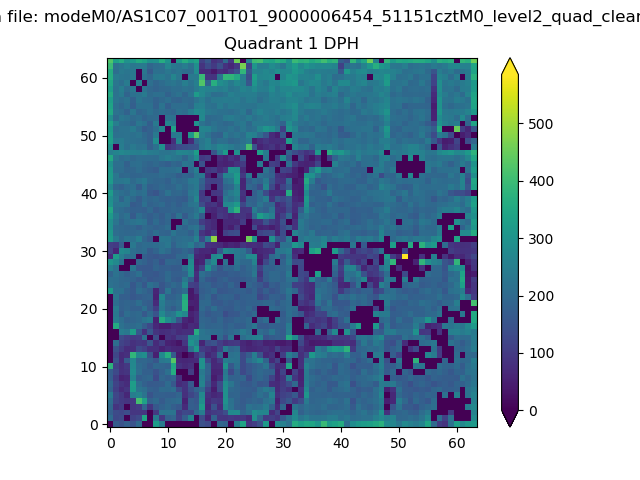 |
Quadrant B |
|---|---|---|---|
| Quadrant D |  |
 |
Quadrant C |
| Plot type | Count rate plots | Images |
|---|---|---|
| Comparison with Poisson distribution Blue bars denote a histogram of data divided into 1 sec bins. Red curve is a Poisson curve with rate = median count rate of data. |
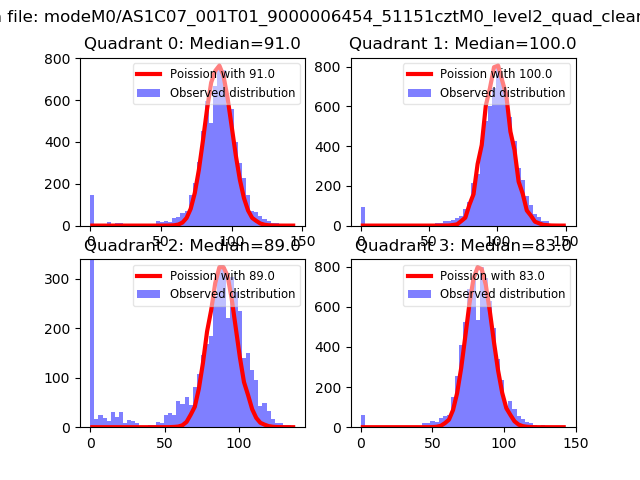 |
 |
| Quadrant-wise count rates Data is divided into 100 sec bins |
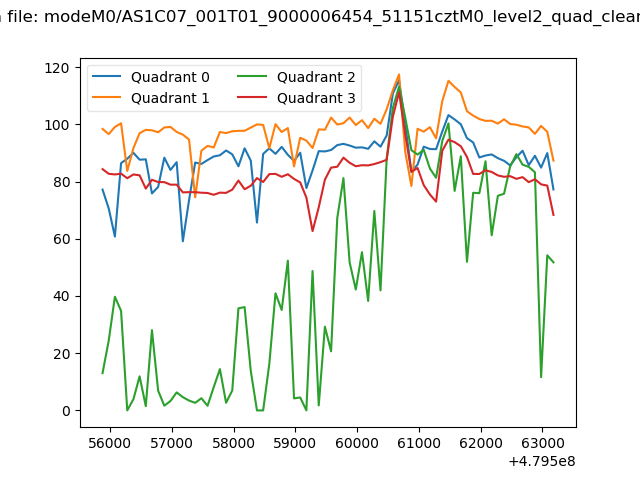 |
|
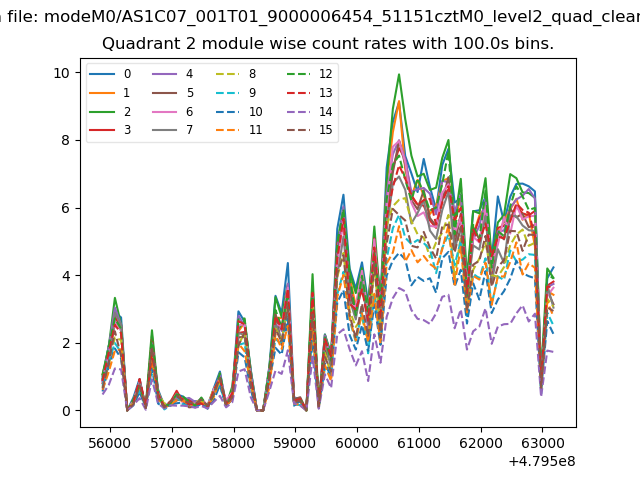
| Module-wise count rates for Quadrant A Data is divided into 100 sec bins |
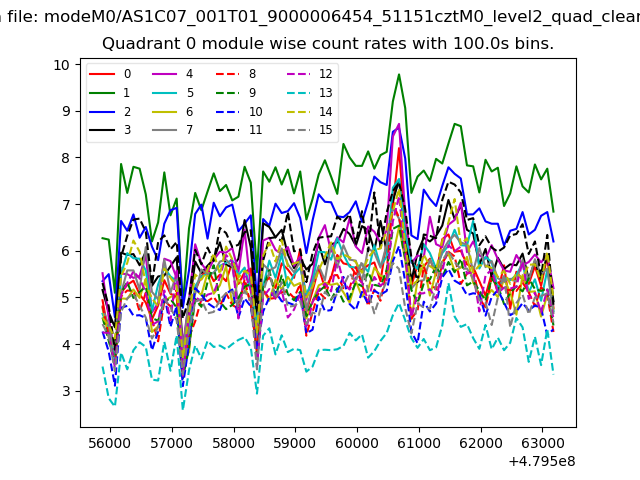 |
 |
| Module-wise count rates for Quadrant B Data is divided into 100 sec bins |
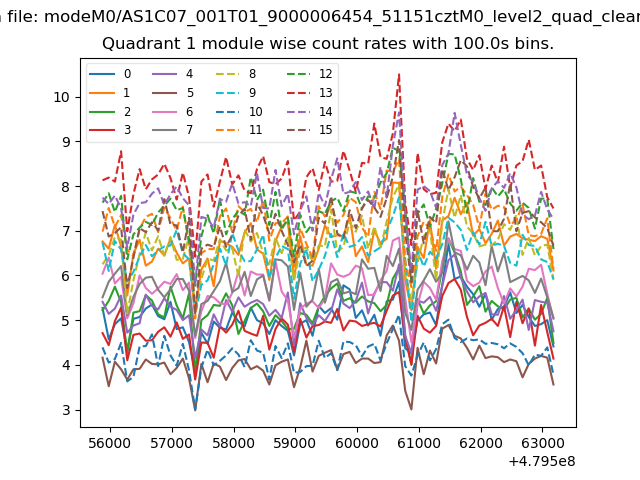 |
 |
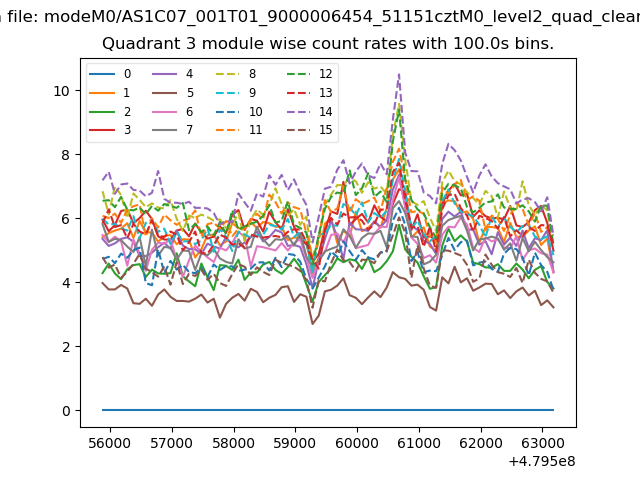
| Module-wise count rates for Quadrant C Data is divided into 100 sec bins |
 |
 |
| Module-wise count rates for Quadrant D Data is divided into 100 sec bins |
 |
 |
| Parameter | Plot |
|---|---|
| CZT HV Monitor | 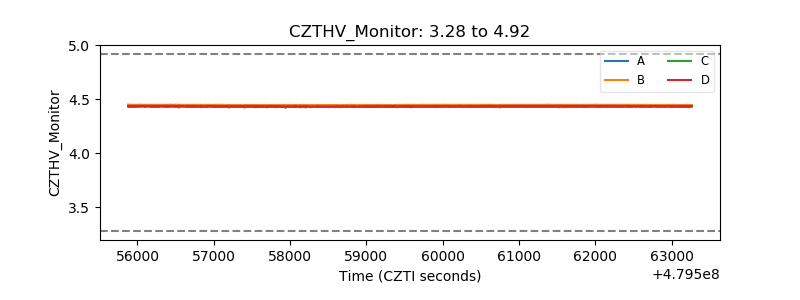 |
| D_VDD | 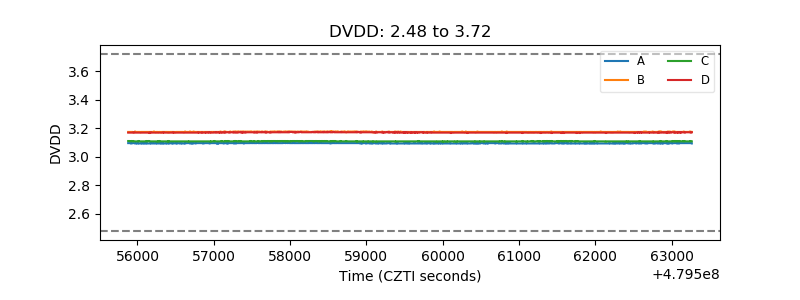 |
| Temperature 1 | 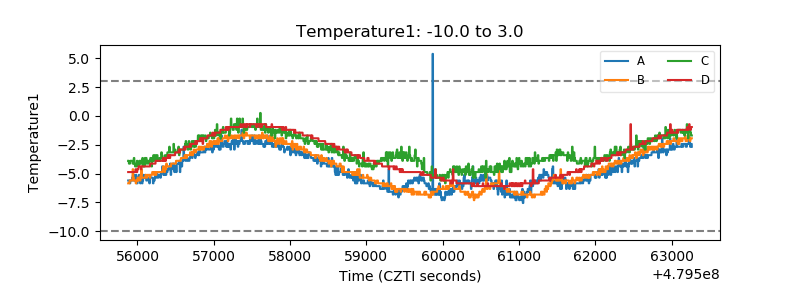 |
| Veto HV Monitor | 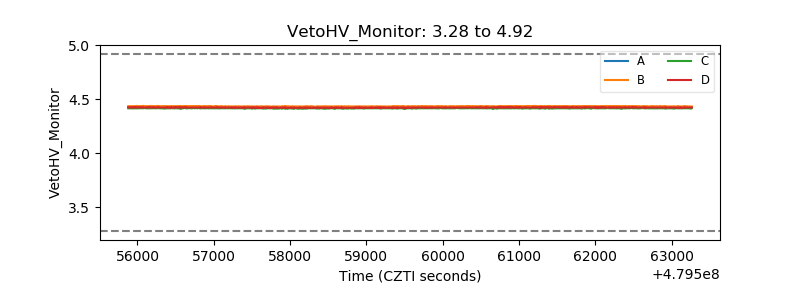 |
| Veto LLD | 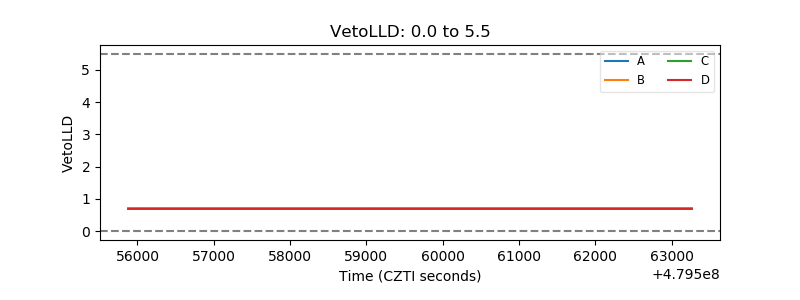 |
| Alpha Counter | 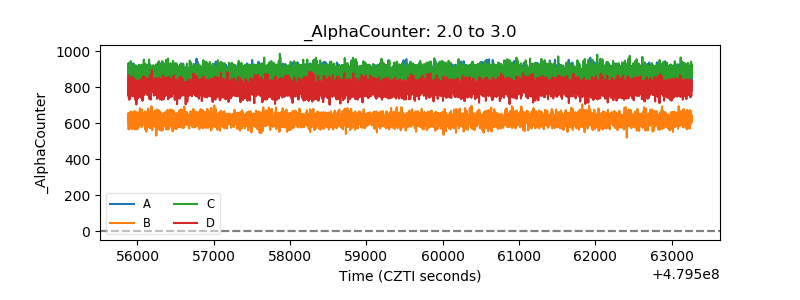 |
| _CPM_Rate | 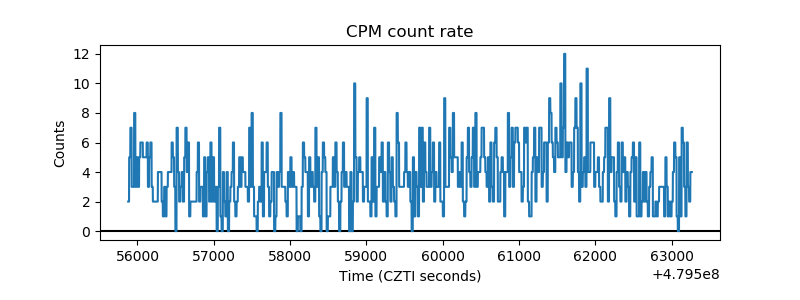 |
| CZT Counter | 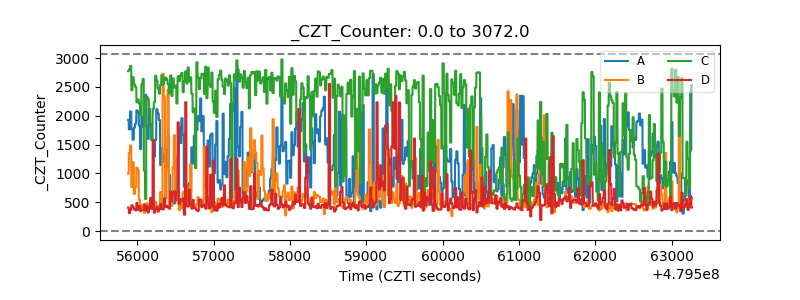 |
| +2.5 Volts monitor | 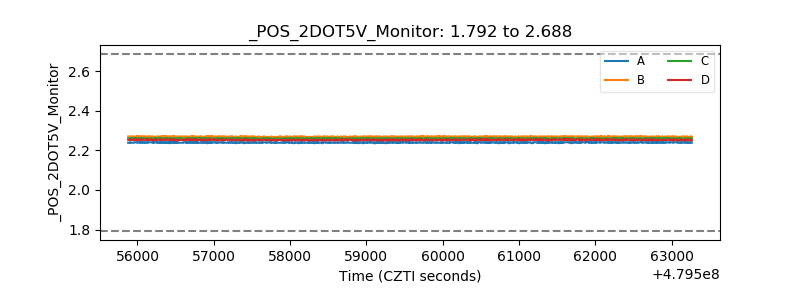 |
| +5 Volts monitor | 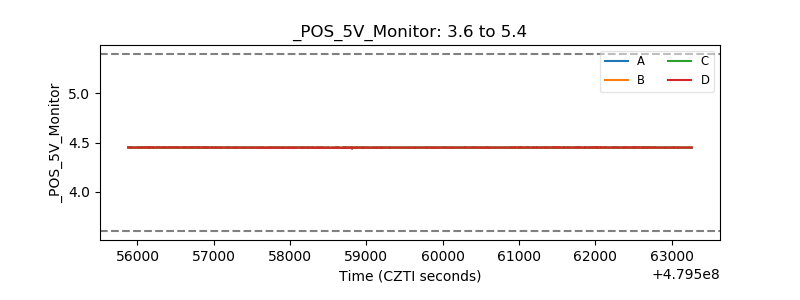 |
| _ROLL_ROT | 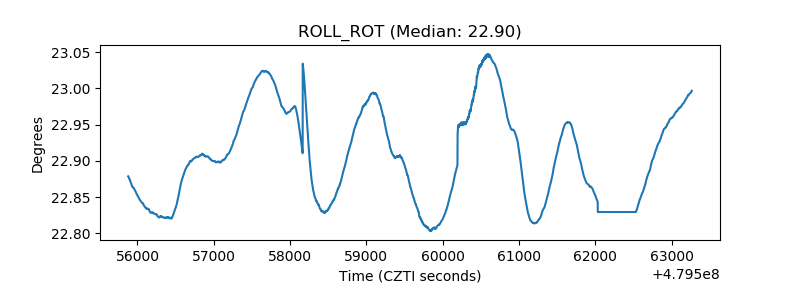 |
| _Roll_DEC | 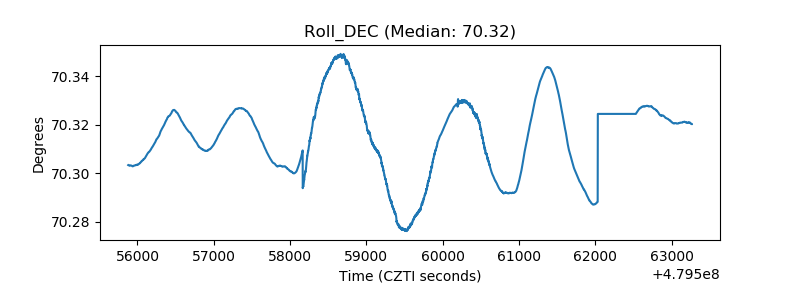 |
| _Roll_RA | 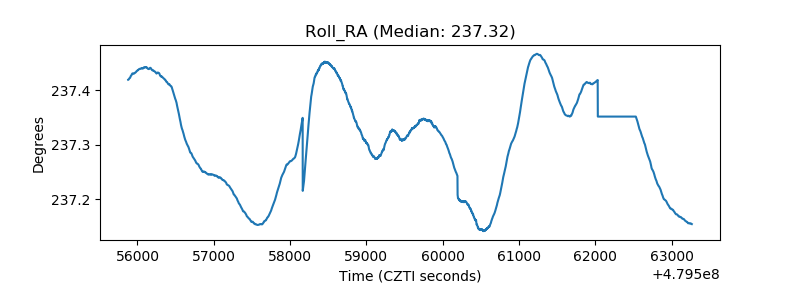 |
| Veto Counter | 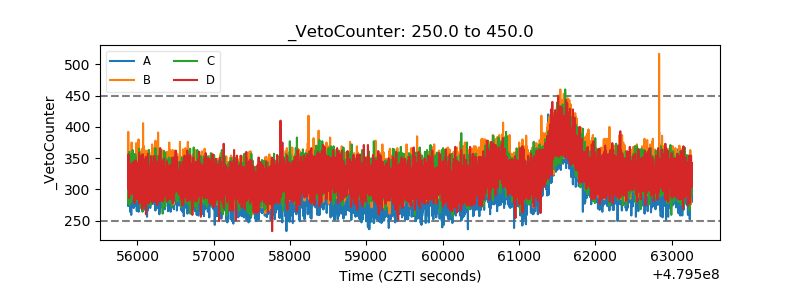 |