| Param | Original file | Final file |
|---|---|---|
| Filename | modeM0/AS1C07_001T01_9000006454_51152cztM0_level2.fits | modeM0/AS1C07_001T01_9000006454_51152cztM0_level2_quad_clean.evt |
| Size (bytes) | 817,136,640 | 93,389,760 |
| Size | 779.3 MB | 89.1 MB |
| Events in quadrant A | 6,353,149 | 667,912 |
| Events in quadrant B | 4,150,242 | 718,777 |
| Events in quadrant C | 13,405,904 | 373,426 |
| Events in quadrant D | 5,782,696 | 566,617 |
| Mode M0 | |||
|---|---|---|---|
| Quadrant | BADHDUFLAG | Total packets | Discarded packets |
| A | 0 | 23862 | 0 |
| B | 0 | 17406 | 0 |
| C | 0 | 44731 | 0 |
| D | 0 | 22169 | 0 |
| Mode SS | |||
|---|---|---|---|
| Quadrant | BADHDUFLAG | Total packets | Discarded packets |
| A | 0 | 144 | 0 |
| B | 0 | 144 | 0 |
| C | 0 | 144 | 0 |
| D | 0 | 144 | 0 |
| Quadrant | Total seconds | Saturated seconds | Saturation percentage |
|---|---|---|---|
| A | 7188 | 209 | 2.907624% |
| B | 7189 | 176 | 2.448185% |
| C | 7189 | 3443 | 47.892614% |
| D | 7189 | 667 | 9.278064% |
Noise dominated data is calculated using 1-second bins in cleaned event files. If a bin has >2000 counts, and if more than 50% of those come from <1% of pixels, then it is considered to be noise-dominated and hence unusable.
| Quadrant | # 1 sec bins | Bins with >0 counts | Bins with >2000 counts | High rate bins dominated by noise | Noise dominated (total time) | Noise dominated (detector-on time) | Marked lightcurve |
|---|---|---|---|---|---|---|---|
| A | 7188 | 7188 | 127 | 127 | 1.77% | 1.77% | 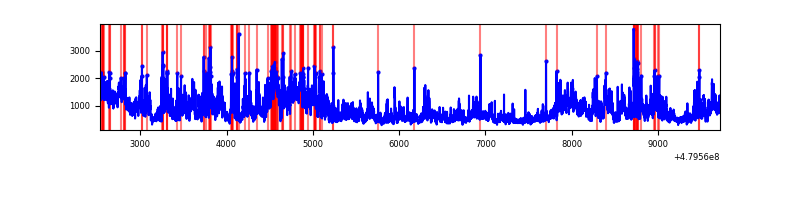 |
| B | 7189 | 7189 | 100 | 100 | 1.39% | 1.39% | 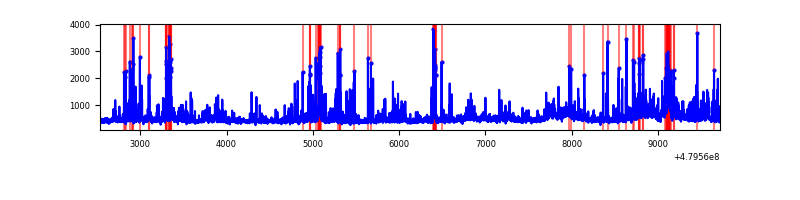 |
| C | 7188 | 7188 | 3405 | 3405 | 47.37% | 47.37% | 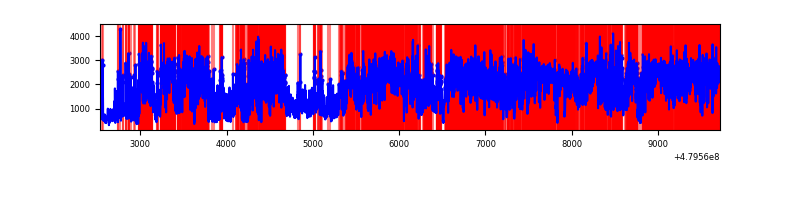 |
| D | 7189 | 7189 | 556 | 556 | 7.73% | 7.73% | 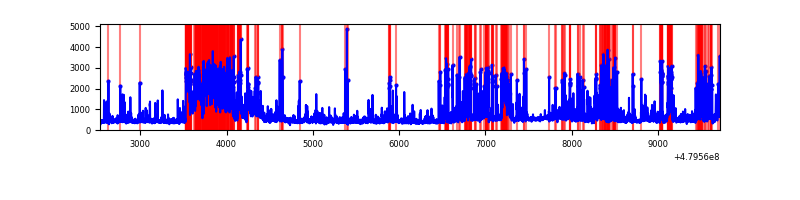 |
Top three noisy pixels from each quadrant. If the there are fewer than three noisy pixels in the level2.evt file, extra rows are filled as -1
| Pixel properties | Quadrant properties | ||||||
|---|---|---|---|---|---|---|---|
| Quadrant | DetID | PixID | Counts | Sigma | Mean | Median | Sigma |
| A | 12 | 80 | 1627916 | 8614.13 | 754 | 735 | 188.9 |
| A | 12 | 3 | 998861 | 5283.98 | 754 | 735 | 188.9 |
| A | 7 | 29 | 163531 | 861.83 | 754 | 735 | 188.9 |
| B | 5 | 185 | 295627 | 1838.54 | 746 | 719 | 160.4 |
| B | 4 | 171 | 206343 | 1281.92 | 746 | 719 | 160.4 |
| B | 10 | 247 | 165847 | 1029.46 | 746 | 719 | 160.4 |
| C | 12 | 247 | 7667213 | 45879.48 | 611 | 608 | 167.1 |
| C | 4 | 12 | 1281679 | 7666.35 | 611 | 608 | 167.1 |
| C | 4 | 13 | 508306 | 3038.23 | 611 | 608 | 167.1 |
| D | 12 | 2 | 1200256 | 6027.59 | 706 | 682 | 199.0 |
| D | 7 | 126 | 720797 | 3618.42 | 706 | 682 | 199.0 |
| D | 3 | 12 | 125810 | 628.74 | 706 | 682 | 199.0 |
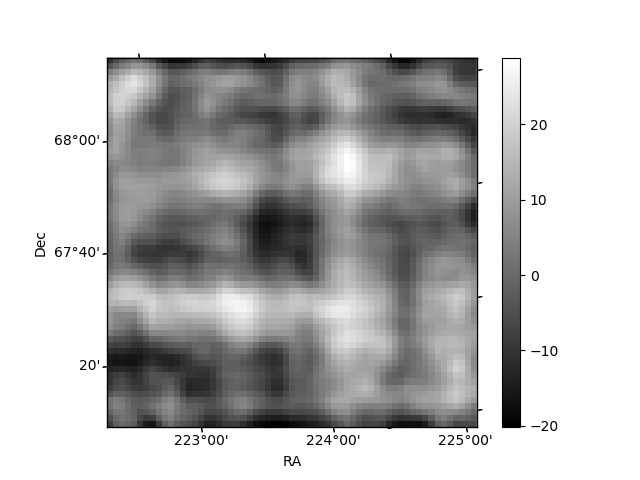
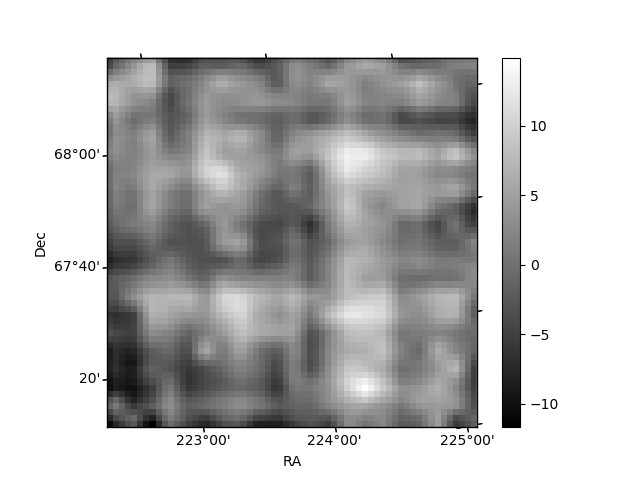
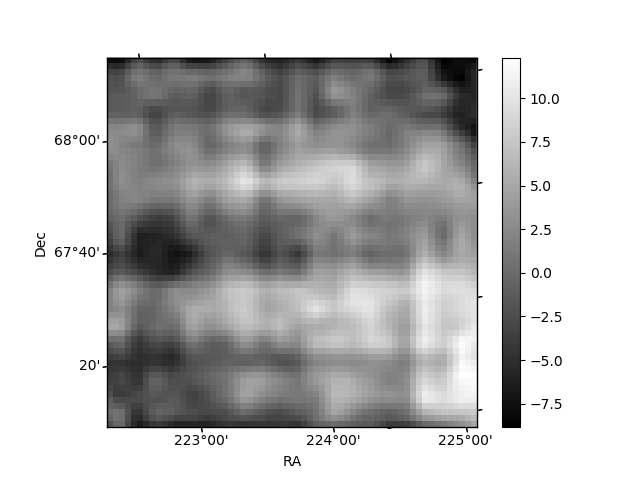
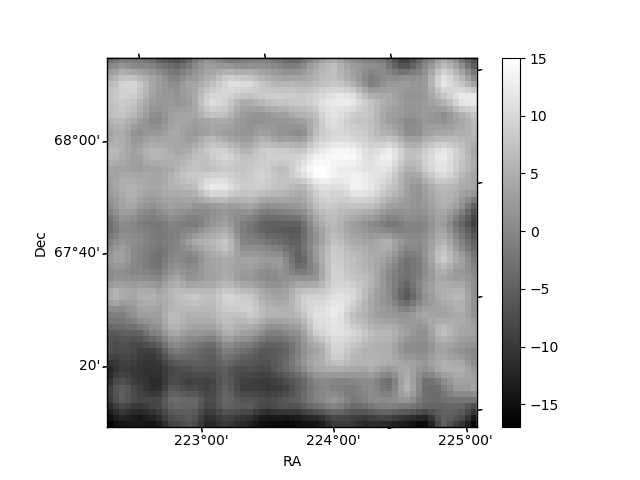
Histogram calculated using DETX and DETY for each event in the final _common_clean file
| Quadrant A | 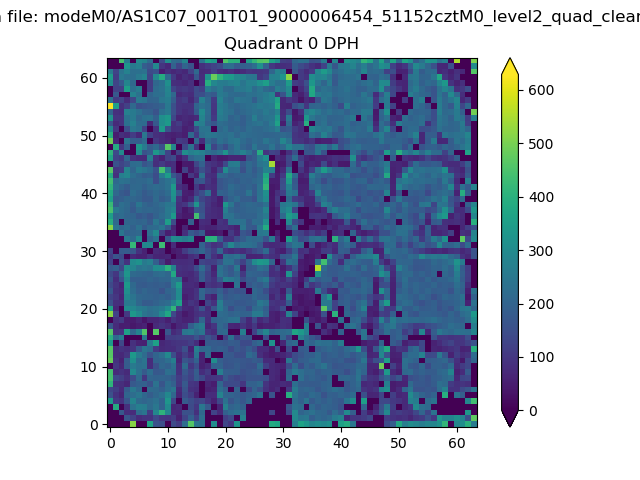 |
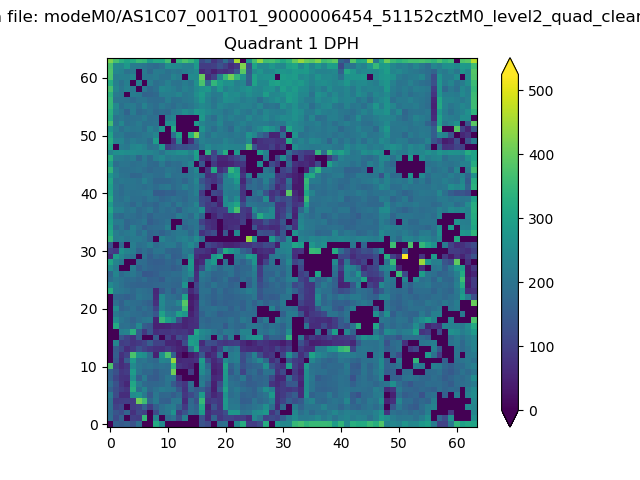 |
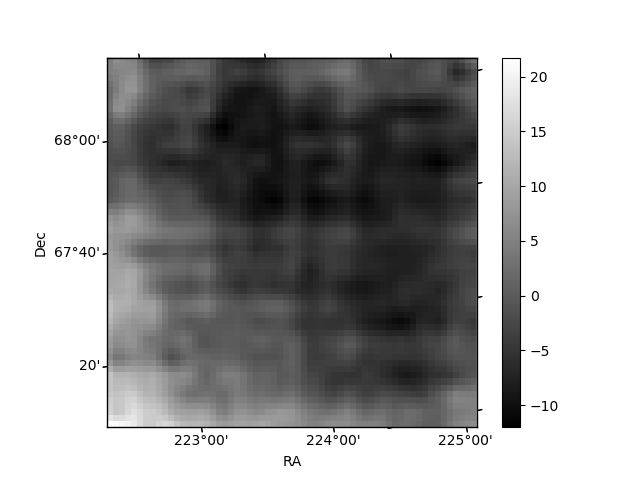
Quadrant B |
|---|---|---|---|
| Quadrant D | 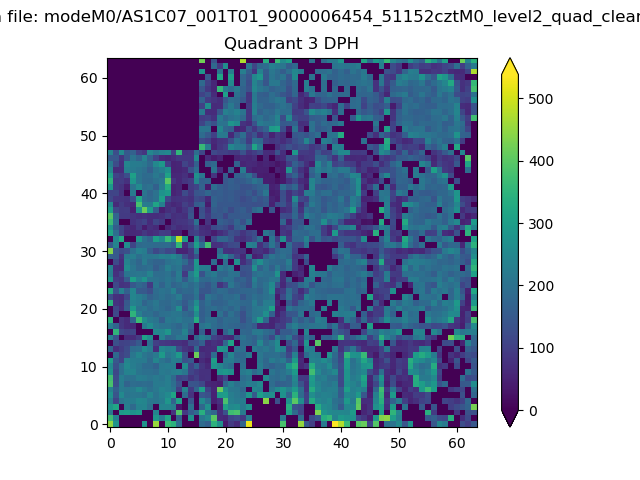 |
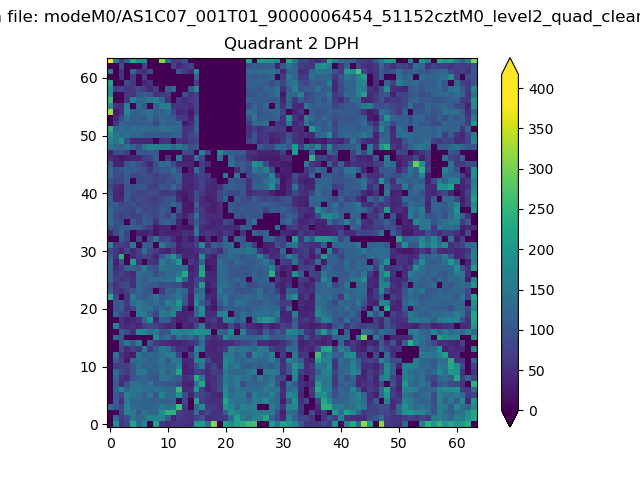 |
Quadrant C |
| Plot type | Count rate plots | Images |
|---|---|---|
| Comparison with Poisson distribution Blue bars denote a histogram of data divided into 1 sec bins. Red curve is a Poisson curve with rate = median count rate of data. |
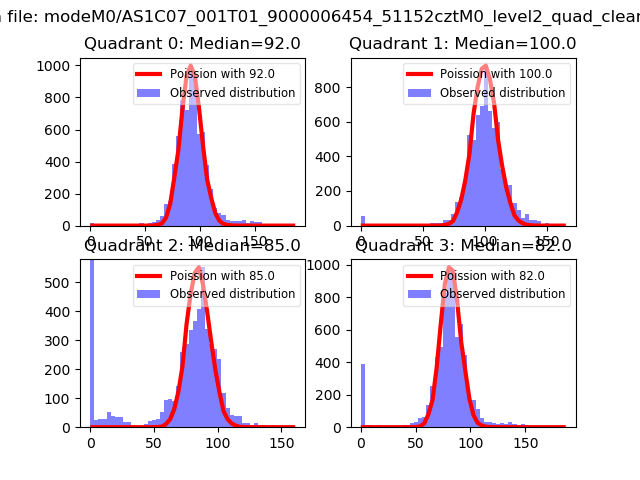 |
 |
| Quadrant-wise count rates Data is divided into 100 sec bins |
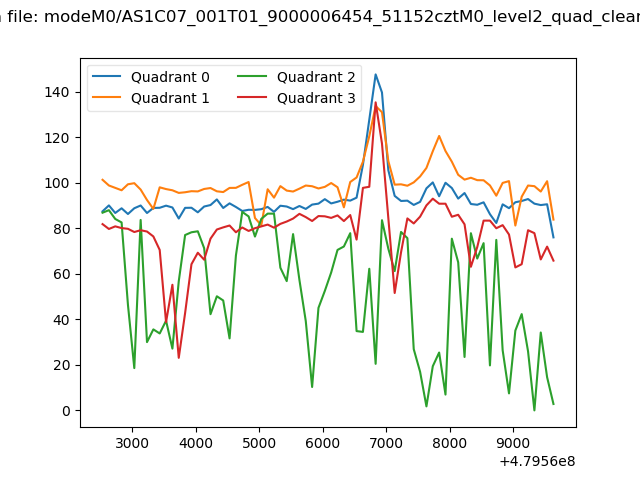 |
|
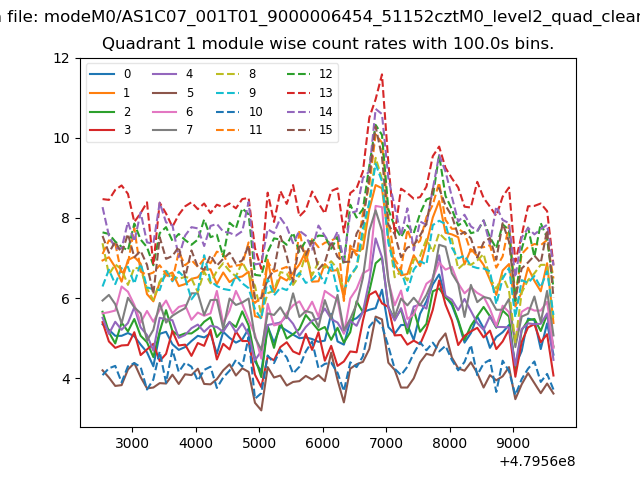
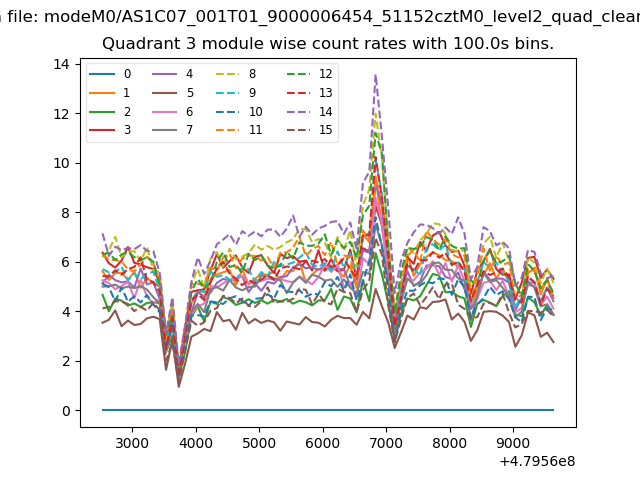
| Module-wise count rates for Quadrant A Data is divided into 100 sec bins |
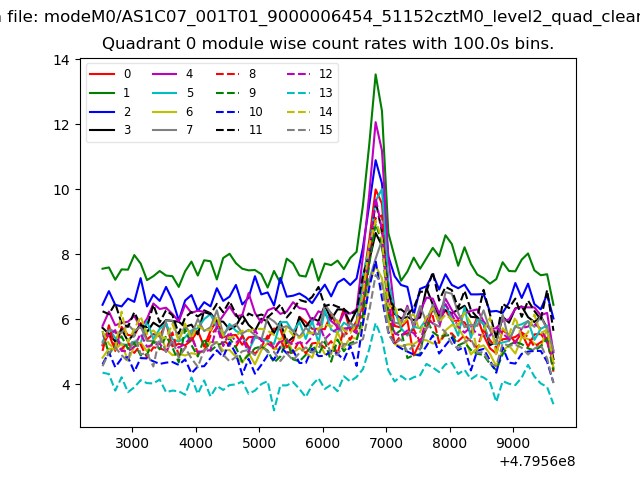 |
 |
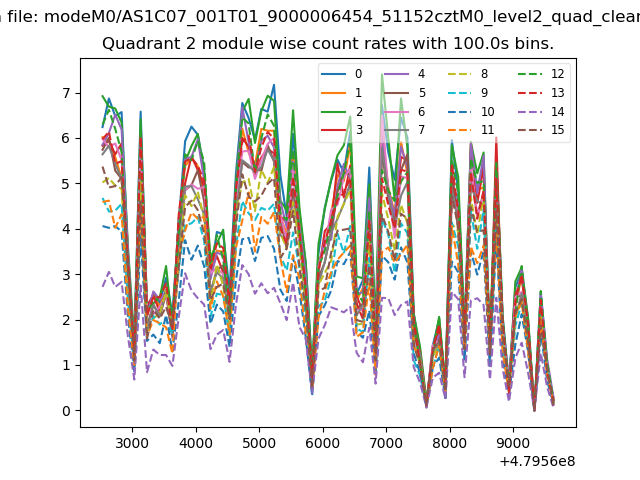
| Module-wise count rates for Quadrant B Data is divided into 100 sec bins |
 |
 |
| Module-wise count rates for Quadrant C Data is divided into 100 sec bins |
 |
 |
| Module-wise count rates for Quadrant D Data is divided into 100 sec bins |
 |
 |
| Parameter | Plot |
|---|---|
| CZT HV Monitor | 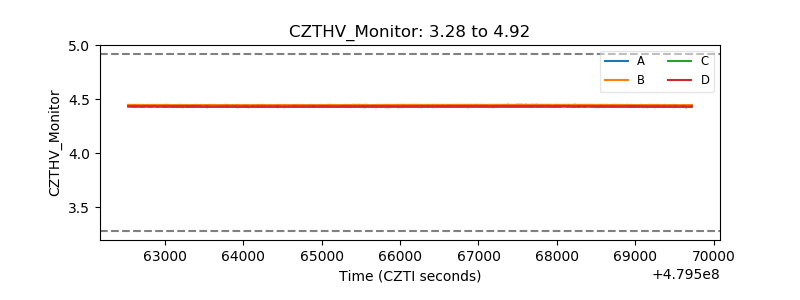 |
| D_VDD | 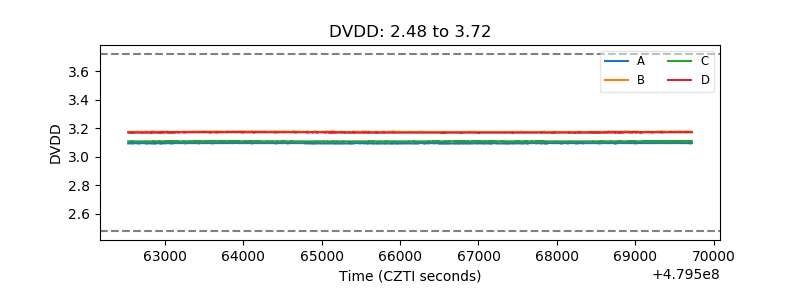 |
| Temperature 1 | 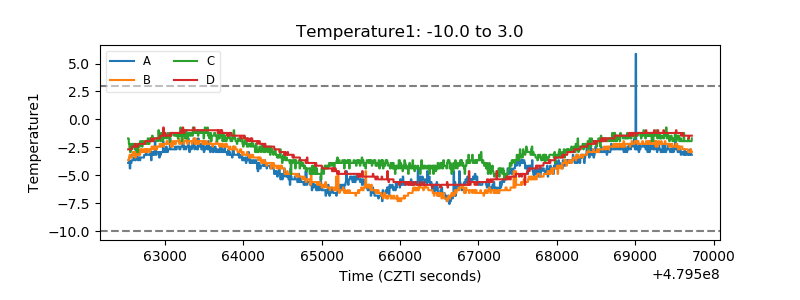 |
| Veto HV Monitor | 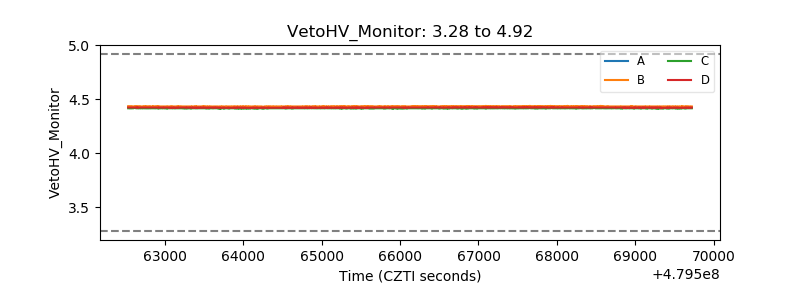 |
| Veto LLD | 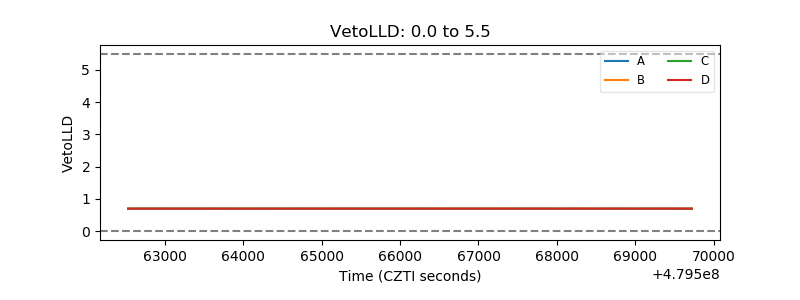 |
| Alpha Counter | 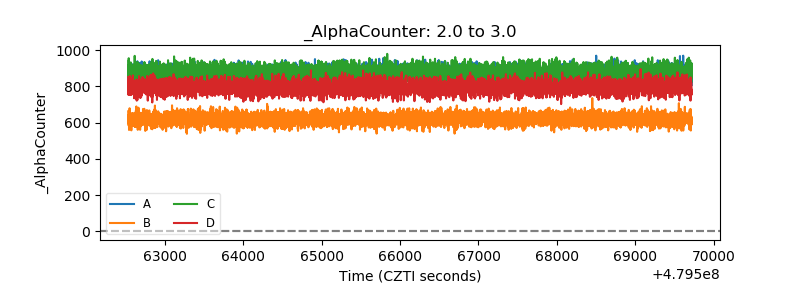 |
| _CPM_Rate | 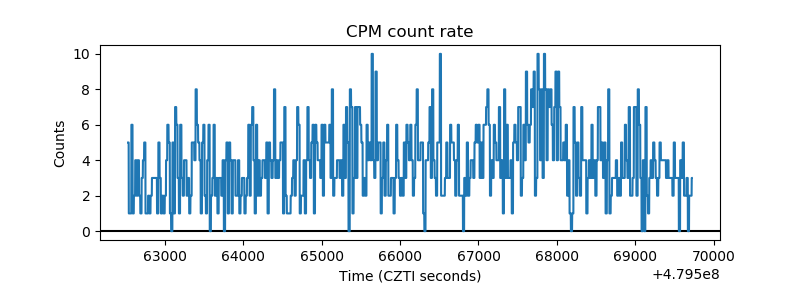 |
| CZT Counter | 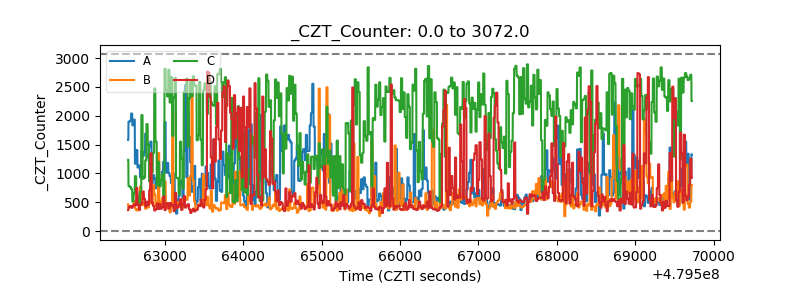 |
| +2.5 Volts monitor | 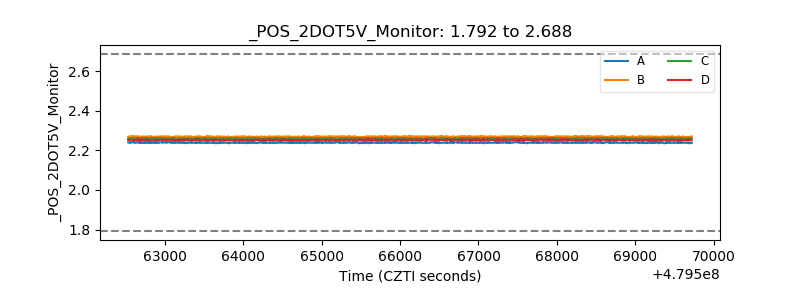 |
| +5 Volts monitor | 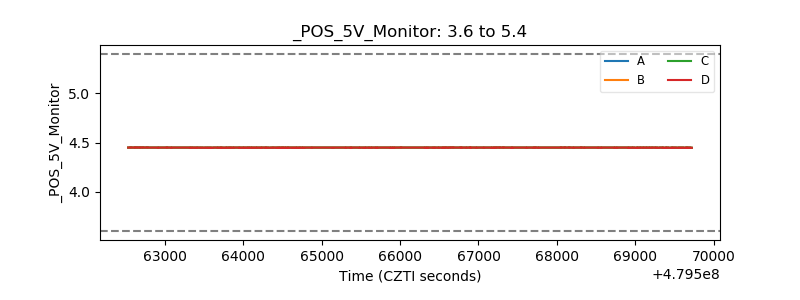 |
| _ROLL_ROT | 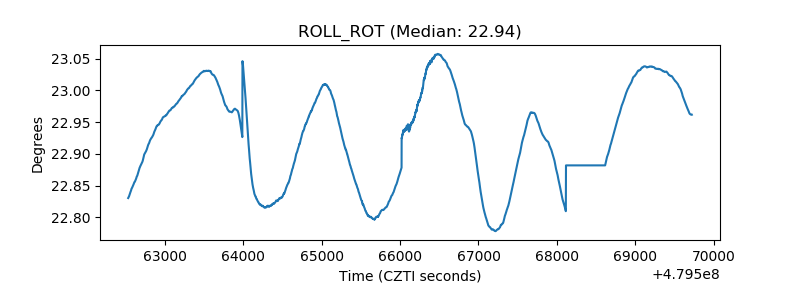 |
| _Roll_DEC | 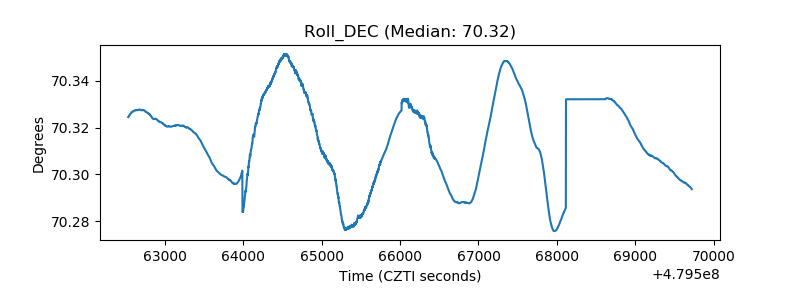 |
| _Roll_RA | 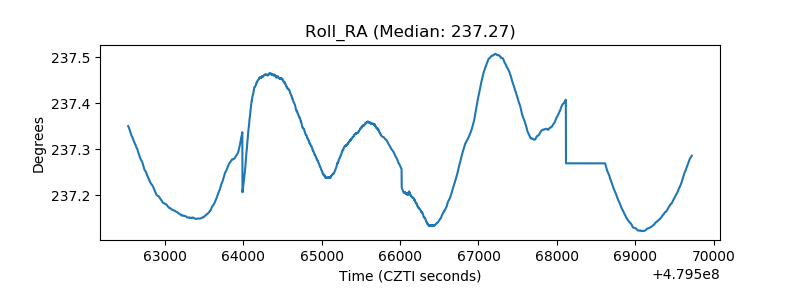 |
| Veto Counter | 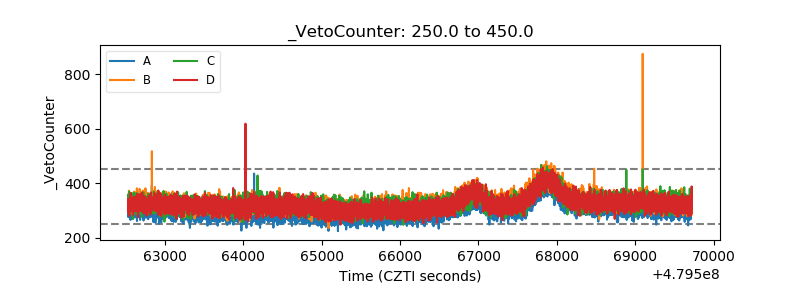 |