| Param | Original file | Final file |
|---|---|---|
| Filename | modeM0/AS1C07_001T01_9000006454_51155cztM0_level2.fits | modeM0/AS1C07_001T01_9000006454_51155cztM0_level2_quad_clean.evt |
| Size (bytes) | 2,069,061,120 | 235,699,200 |
| Size | 1.9 GB | 224.8 MB |
| Events in quadrant A | 17,218,969 | 1,611,770 |
| Events in quadrant B | 11,595,417 | 1,806,028 |
| Events in quadrant C | 30,858,011 | 1,075,880 |
| Events in quadrant D | 15,482,886 | 1,356,882 |
| Mode M0 | |||
|---|---|---|---|
| Quadrant | BADHDUFLAG | Total packets | Discarded packets |
| A | 0 | 64212 | 2 |
| B | 0 | 47544 | 2 |
| C | 0 | 104622 | 3 |
| D | 0 | 59006 | 2 |
| Mode SS | |||
|---|---|---|---|
| Quadrant | BADHDUFLAG | Total packets | Discarded packets |
| A | 0 | 378 | 0 |
| B | 0 | 378 | 0 |
| C | 0 | 378 | 0 |
| D | 0 | 378 | 0 |
| Mode M9 | |||
|---|---|---|---|
| Quadrant | BADHDUFLAG | Total packets | Discarded packets |
| A | 0 | 11 | 0 |
| B | 0 | 11 | 0 |
| C | 0 | 11 | 0 |
| D | 0 | 11 | 0 |
| Quadrant | Total seconds | Saturated seconds | Saturation percentage |
|---|---|---|---|
| A | 18635 | 1233 | 6.616582% |
| B | 18635 | 730 | 3.917360% |
| C | 18635 | 7065 | 37.912530% |
| D | 18635 | 1910 | 10.249530% |
Noise dominated data is calculated using 1-second bins in cleaned event files. If a bin has >2000 counts, and if more than 50% of those come from <1% of pixels, then it is considered to be noise-dominated and hence unusable.
| Quadrant | # 1 sec bins | Bins with >0 counts | Bins with >2000 counts | High rate bins dominated by noise | Noise dominated (total time) | Noise dominated (detector-on time) | Marked lightcurve |
|---|---|---|---|---|---|---|---|
| A | 19785 | 18637 | 687 | 687 | 3.47% | 3.69% | 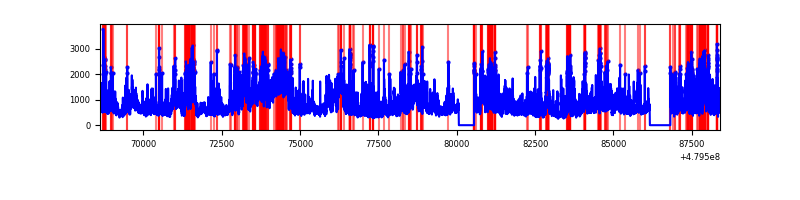 |
| B | 19785 | 18637 | 351 | 351 | 1.77% | 1.88% | 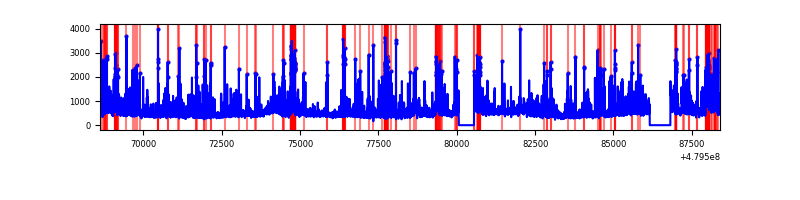 |
| C | 19785 | 18636 | 6788 | 6788 | 34.31% | 36.42% | 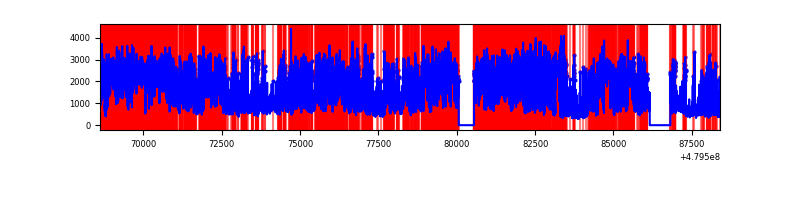 |
| D | 19785 | 18637 | 1719 | 1719 | 8.69% | 9.22% | 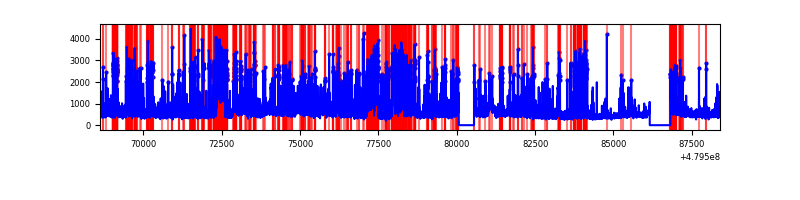 |
Top three noisy pixels from each quadrant. If the there are fewer than three noisy pixels in the level2.evt file, extra rows are filled as -1
| Pixel properties | Quadrant properties | ||||||
|---|---|---|---|---|---|---|---|
| Quadrant | DetID | PixID | Counts | Sigma | Mean | Median | Sigma |
| A | 12 | 80 | 4935502 | 10331.78 | 1935 | 1884 | 477.5 |
| A | 12 | 3 | 2502252 | 5236.17 | 1935 | 1884 | 477.5 |
| A | 7 | 29 | 350136 | 729.3 | 1935 | 1884 | 477.5 |
| B | 5 | 185 | 905522 | 2197.49 | 1940 | 1873 | 411.2 |
| B | 0 | 197 | 623615 | 1511.95 | 1940 | 1873 | 411.2 |
| B | 4 | 171 | 490272 | 1187.68 | 1940 | 1873 | 411.2 |
| C | 12 | 247 | 9733112 | 21196.27 | 1657 | 1640 | 459.1 |
| C | 4 | 12 | 6873597 | 14967.92 | 1657 | 1640 | 459.1 |
| C | 4 | 13 | 1566211 | 3407.82 | 1657 | 1640 | 459.1 |
| D | 15 | 184 | 2710122 | 5342.46 | 1833 | 1775 | 506.9 |
| D | 7 | 126 | 1036107 | 2040.31 | 1833 | 1775 | 506.9 |
| D | 7 | 60 | 763293 | 1502.16 | 1833 | 1775 | 506.9 |
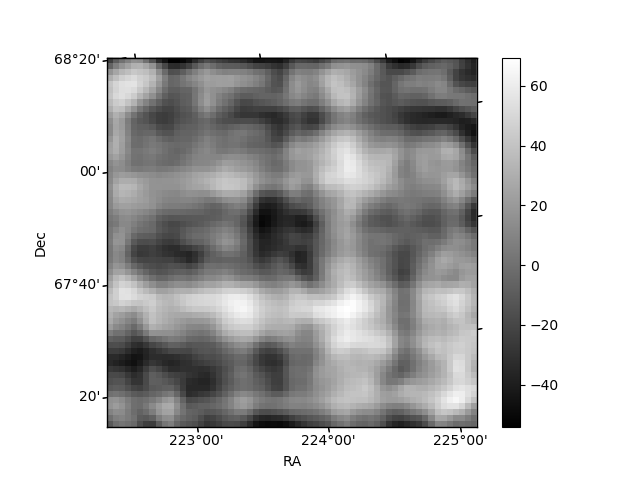
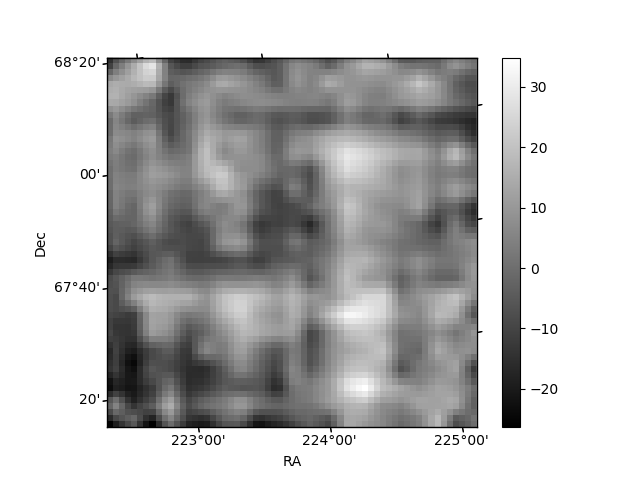
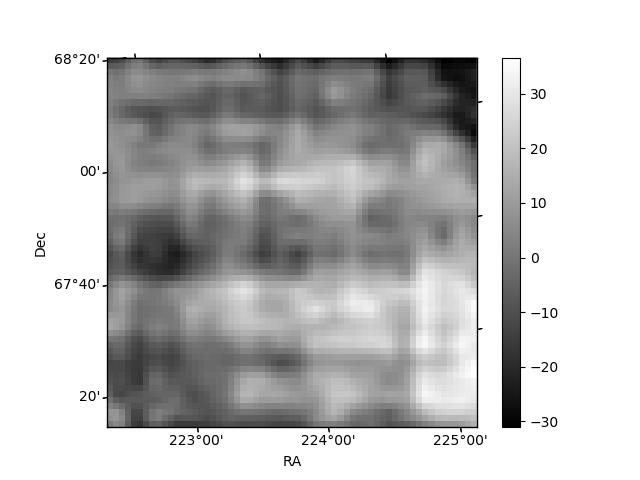
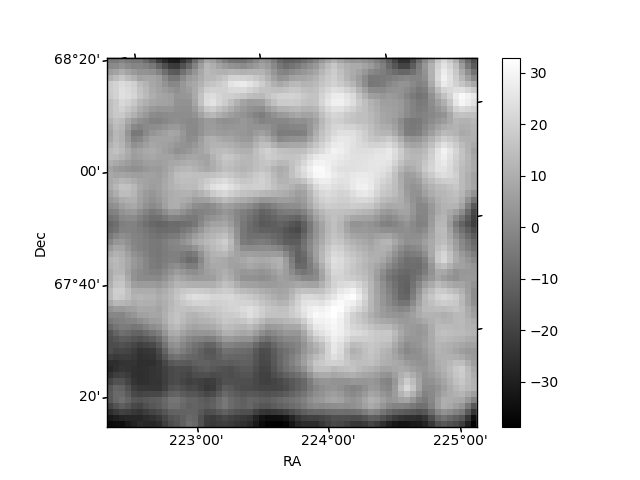
Histogram calculated using DETX and DETY for each event in the final _common_clean file
| Quadrant A | 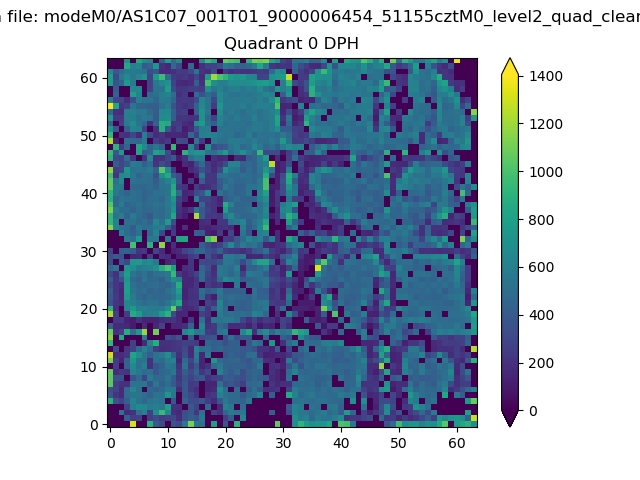 |
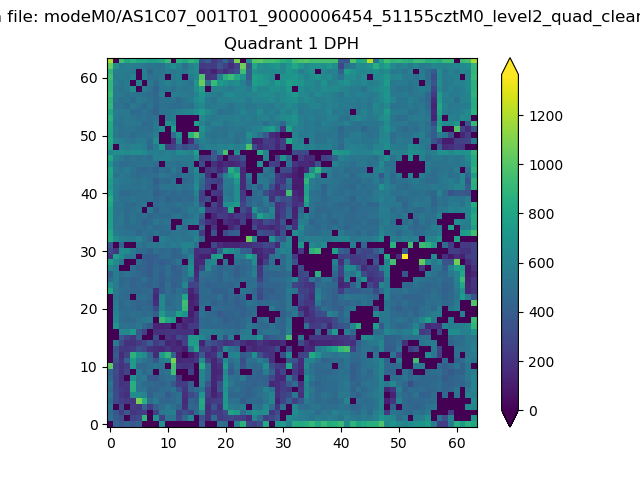 |
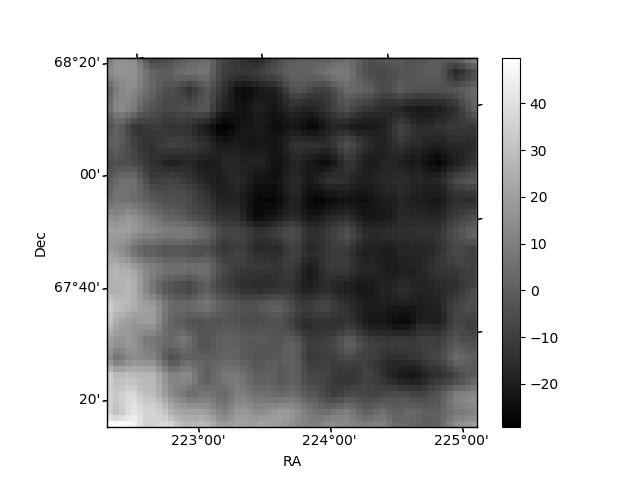
Quadrant B |
|---|---|---|---|
| Quadrant D | 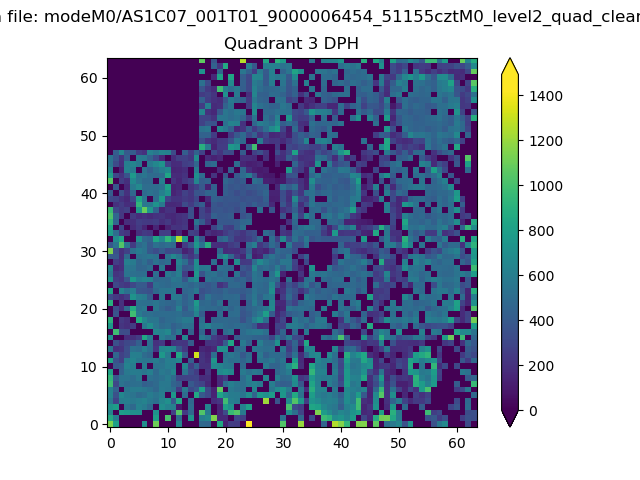 |
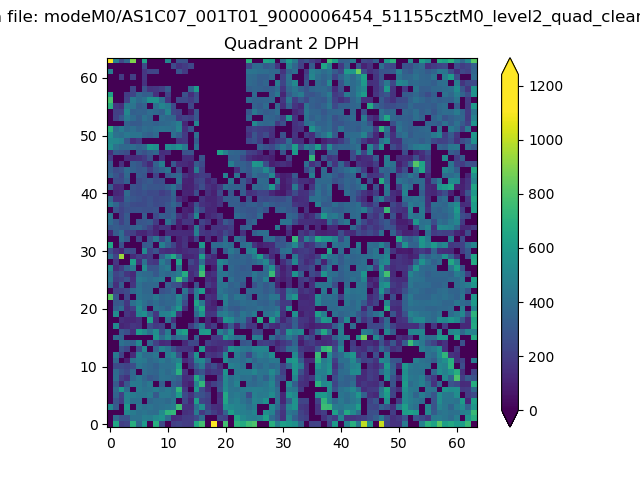 |
Quadrant C |
| Plot type | Count rate plots | Images |
|---|---|---|
| Comparison with Poisson distribution Blue bars denote a histogram of data divided into 1 sec bins. Red curve is a Poisson curve with rate = median count rate of data. |
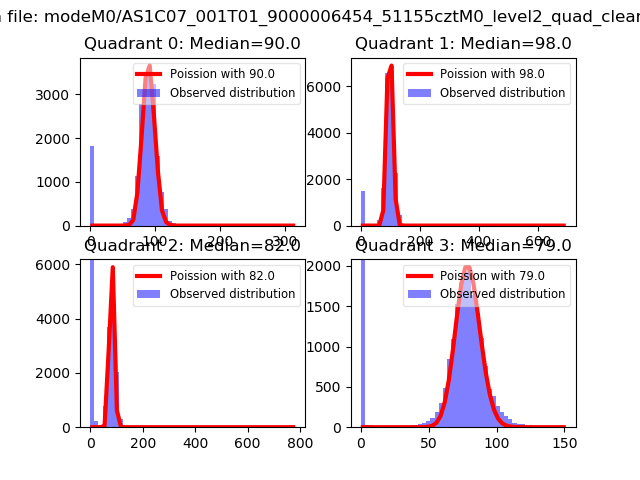 |
 |
| Quadrant-wise count rates Data is divided into 100 sec bins |
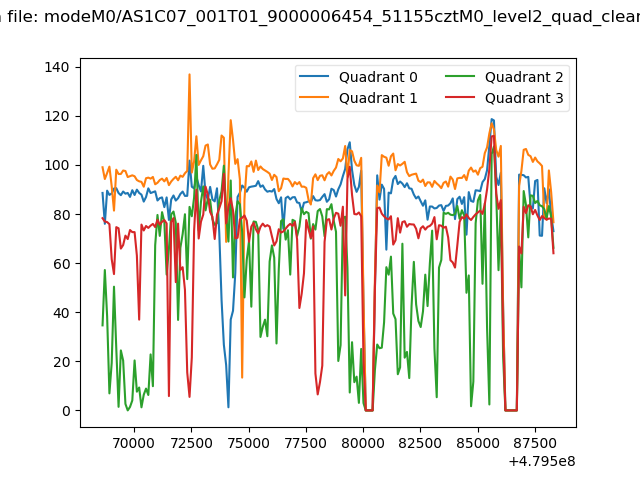 |
|
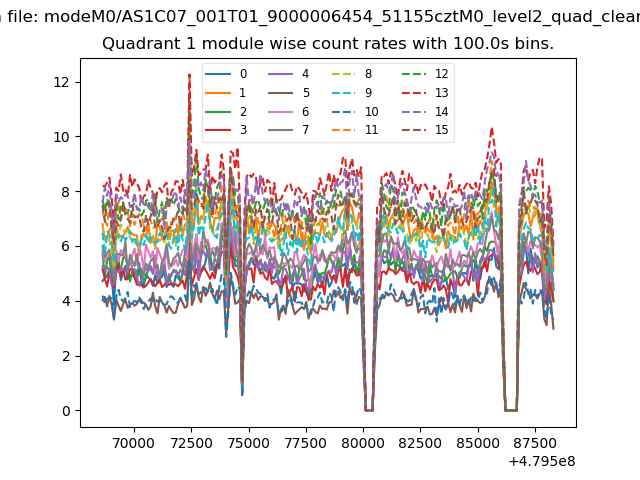
| Module-wise count rates for Quadrant A Data is divided into 100 sec bins |
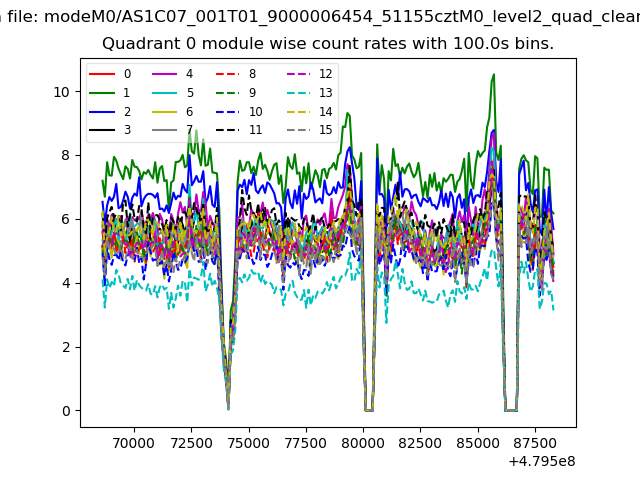 |
 |
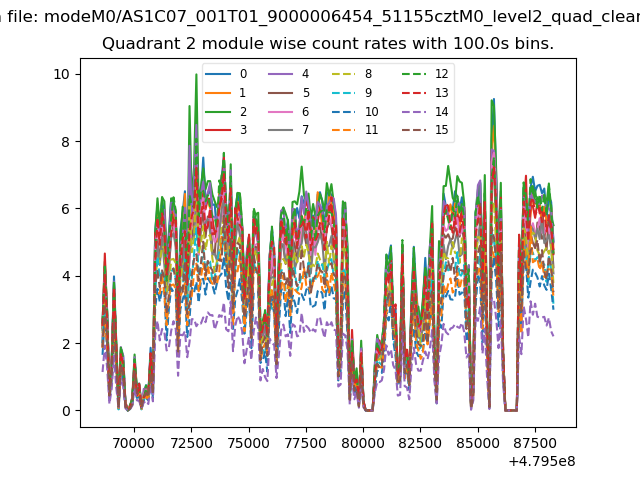
| Module-wise count rates for Quadrant B Data is divided into 100 sec bins |
 |
 |
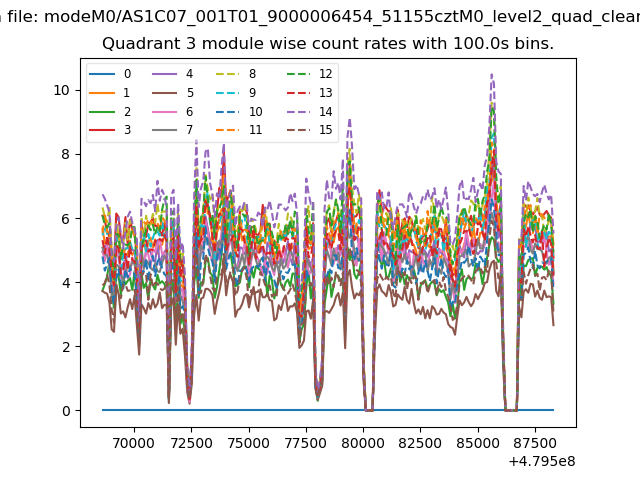
| Module-wise count rates for Quadrant C Data is divided into 100 sec bins |
 |
 |
| Module-wise count rates for Quadrant D Data is divided into 100 sec bins |
 |
 |
| Parameter | Plot |
|---|---|
| CZT HV Monitor | 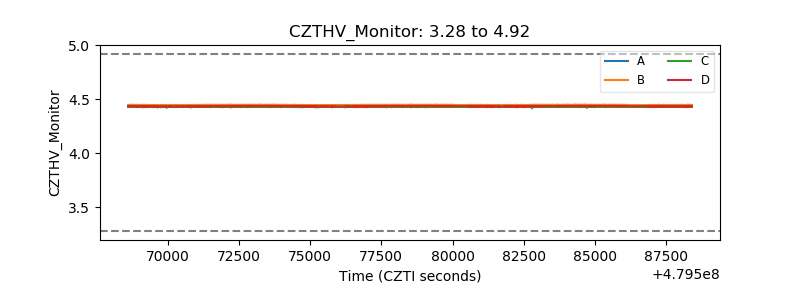 |
| D_VDD | 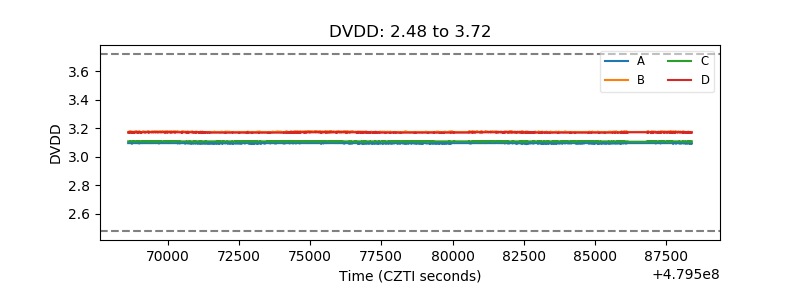 |
| Temperature 1 | 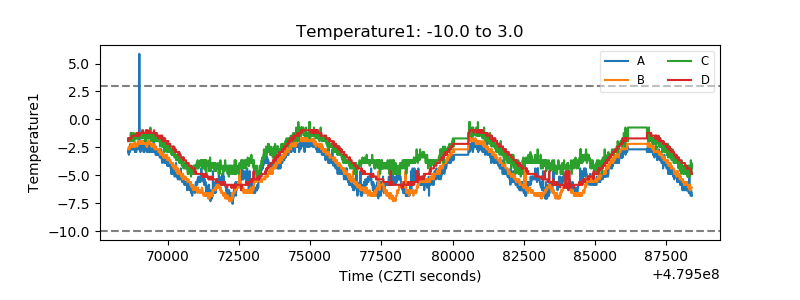 |
| Veto HV Monitor | 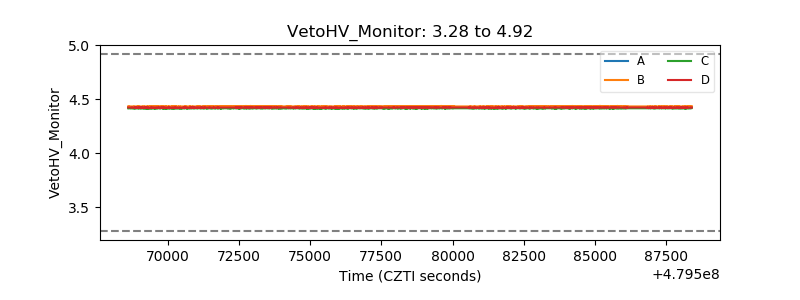 |
| Veto LLD | 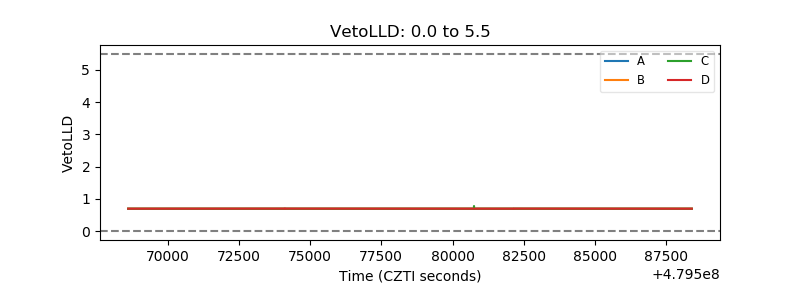 |
| Alpha Counter | 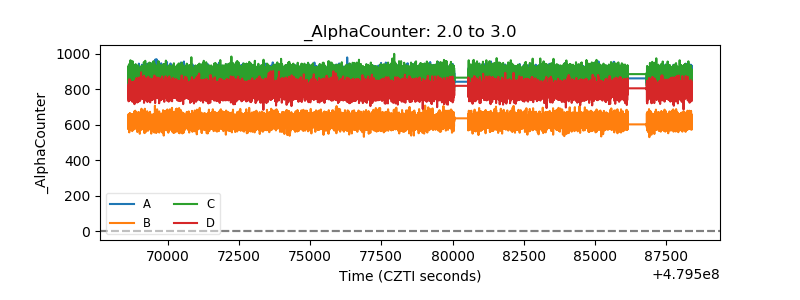 |
| _CPM_Rate | 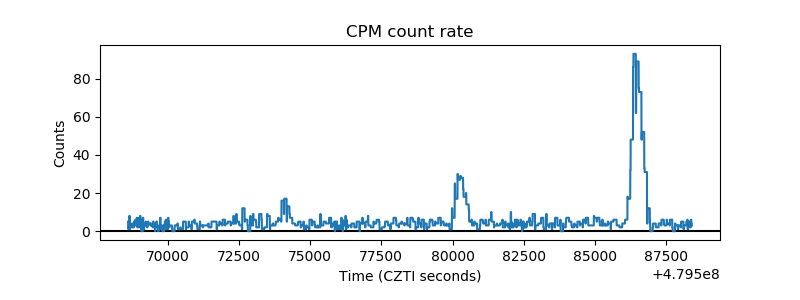 |
| CZT Counter | 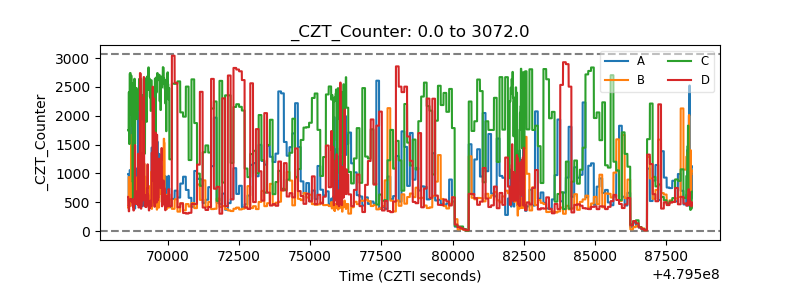 |
| +2.5 Volts monitor | 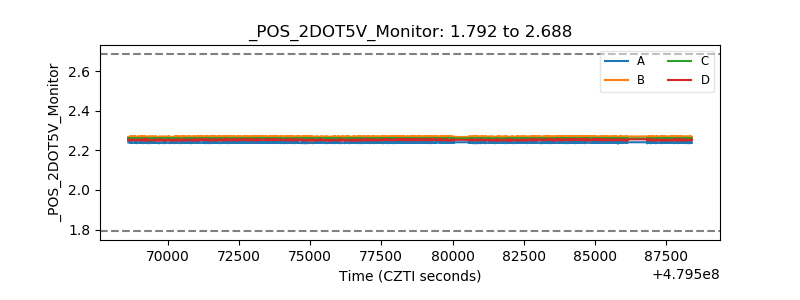 |
| +5 Volts monitor | 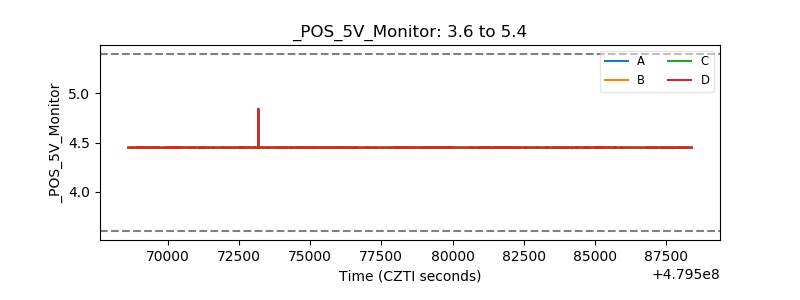 |
| _ROLL_ROT | 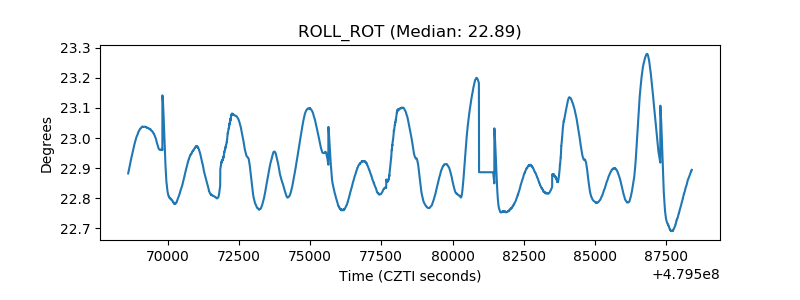 |
| _Roll_DEC | 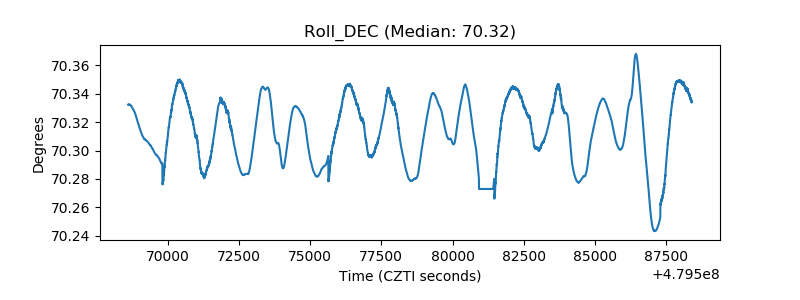 |
| _Roll_RA | 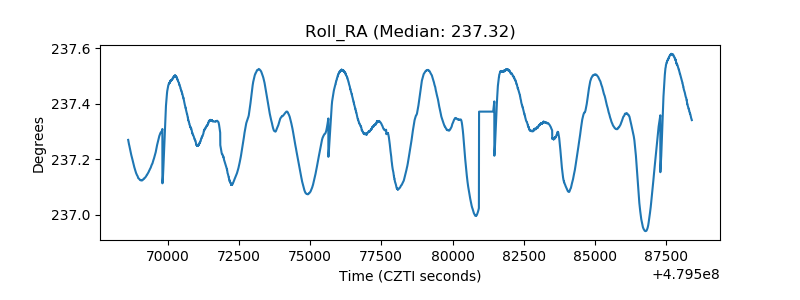 |
| Veto Counter | 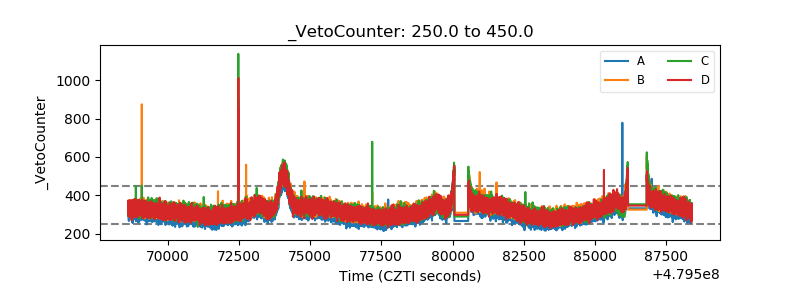 |