| Param | Original file | Final file |
|---|---|---|
| Filename | modeM0/AS1C07_001T01_9000006454_51156cztM0_level2.fits | modeM0/AS1C07_001T01_9000006454_51156cztM0_level2_quad_clean.evt |
| Size (bytes) | 646,747,200 | 98,605,440 |
| Size | 616.8 MB | 94.0 MB |
| Events in quadrant A | 6,845,100 | 622,461 |
| Events in quadrant B | 4,675,493 | 693,288 |
| Events in quadrant C | 7,890,122 | 592,271 |
| Events in quadrant D | 3,995,066 | 595,331 |
| Mode M0 | |||
|---|---|---|---|
| Quadrant | BADHDUFLAG | Total packets | Discarded packets |
| A | 0 | 25220 | 4 |
| B | 0 | 18858 | 2 |
| C | 0 | 28292 | 2 |
| D | 0 | 17018 | 2 |
| Mode SS | |||
|---|---|---|---|
| Quadrant | BADHDUFLAG | Total packets | Discarded packets |
| A | 0 | 142 | 0 |
| B | 0 | 142 | 0 |
| C | 0 | 142 | 0 |
| D | 0 | 142 | 0 |
| Mode M9 | |||
|---|---|---|---|
| Quadrant | BADHDUFLAG | Total packets | Discarded packets |
| A | 0 | 10 | 0 |
| B | 0 | 11 | 0 |
| C | 0 | 11 | 0 |
| D | 0 | 11 | 0 |
| Quadrant | Total seconds | Saturated seconds | Saturation percentage |
|---|---|---|---|
| A | 6916 | 594 | 8.588780% |
| B | 6916 | 268 | 3.875072% |
| C | 6916 | 821 | 11.871024% |
| D | 6916 | 194 | 2.805090% |
Noise dominated data is calculated using 1-second bins in cleaned event files. If a bin has >2000 counts, and if more than 50% of those come from <1% of pixels, then it is considered to be noise-dominated and hence unusable.
| Quadrant | # 1 sec bins | Bins with >0 counts | Bins with >2000 counts | High rate bins dominated by noise | Noise dominated (total time) | Noise dominated (detector-on time) | Marked lightcurve |
|---|---|---|---|---|---|---|---|
| A | 7781 | 6916 | 571 | 571 | 7.34% | 8.26% |  |
| B | 7781 | 6917 | 167 | 167 | 2.15% | 2.41% |  |
| C | 7780 | 6916 | 740 | 740 | 9.51% | 10.70% | 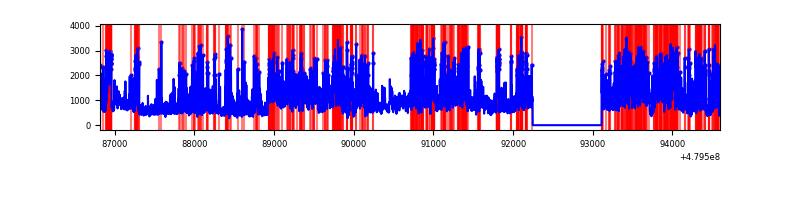 |
| D | 7781 | 6916 | 151 | 151 | 1.94% | 2.18% | 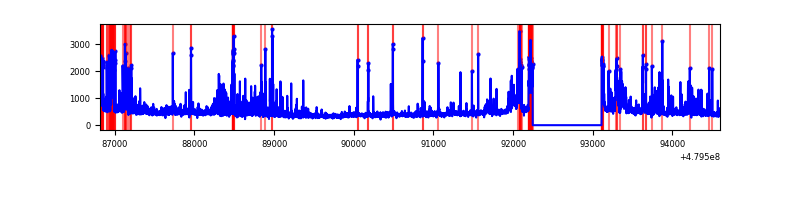 |
Top three noisy pixels from each quadrant. If the there are fewer than three noisy pixels in the level2.evt file, extra rows are filled as -1
| Pixel properties | Quadrant properties | ||||||
|---|---|---|---|---|---|---|---|
| Quadrant | DetID | PixID | Counts | Sigma | Mean | Median | Sigma |
| A | 12 | 3 | 1719994 | 9535.89 | 723 | 707 | 180.3 |
| A | 12 | 80 | 1580709 | 8763.36 | 723 | 707 | 180.3 |
| A | 12 | 194 | 200092 | 1105.87 | 723 | 707 | 180.3 |
| B | 0 | 197 | 782801 | 4990.91 | 726 | 701 | 156.7 |
| B | 5 | 185 | 230672 | 1467.54 | 726 | 701 | 156.7 |
| B | 5 | 172 | 173682 | 1103.87 | 726 | 701 | 156.7 |
| C | 10 | 171 | 2995449 | 15427.67 | 696 | 687 | 194.1 |
| C | 13 | 3 | 436945 | 2247.41 | 696 | 687 | 194.1 |
| C | 15 | 173 | 351027 | 1804.79 | 696 | 687 | 194.1 |
| D | 8 | 176 | 231315 | 1136.06 | 713 | 687 | 203.0 |
| D | 12 | 2 | 183289 | 899.49 | 713 | 687 | 203.0 |
| D | 10 | 172 | 163837 | 803.67 | 713 | 687 | 203.0 |
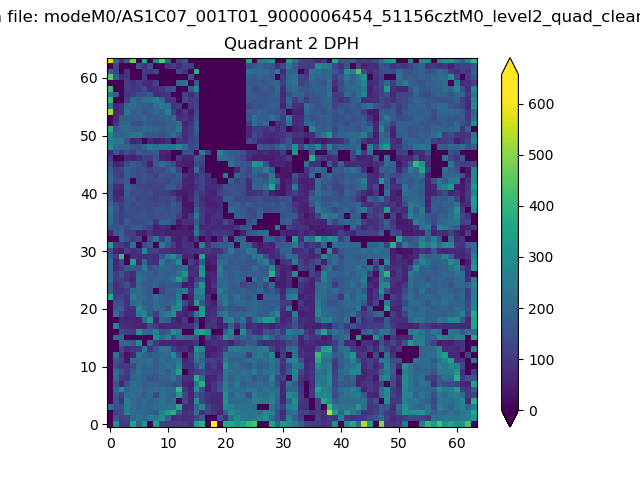
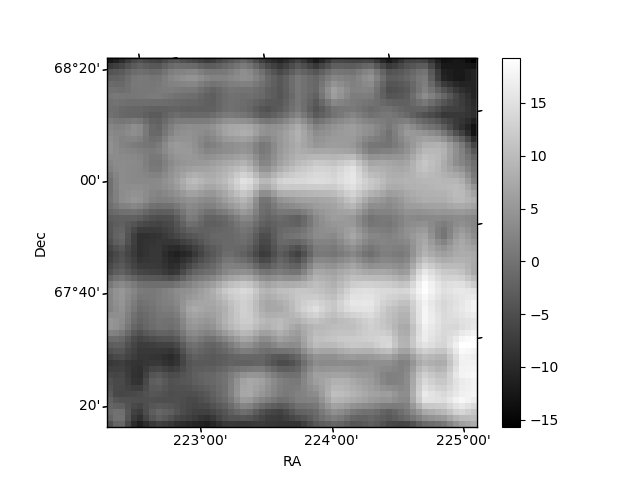
Histogram calculated using DETX and DETY for each event in the final _common_clean file
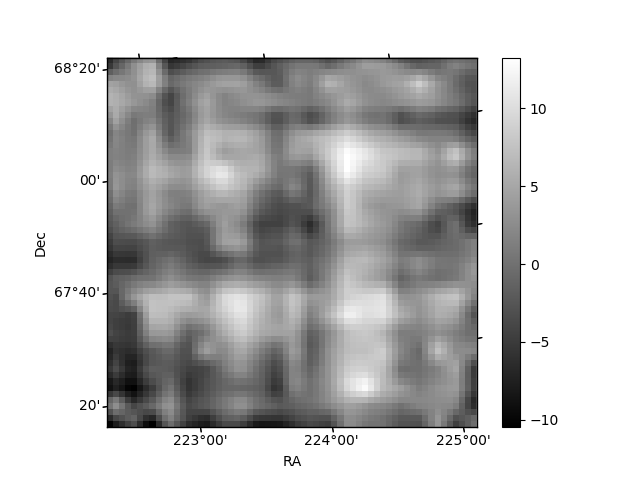
| Quadrant A | 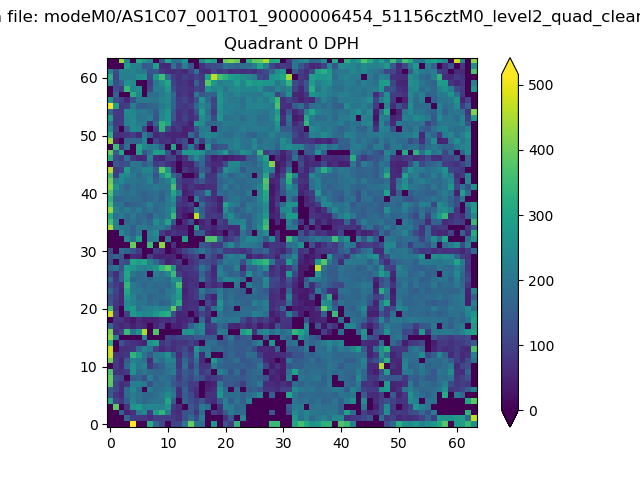 |
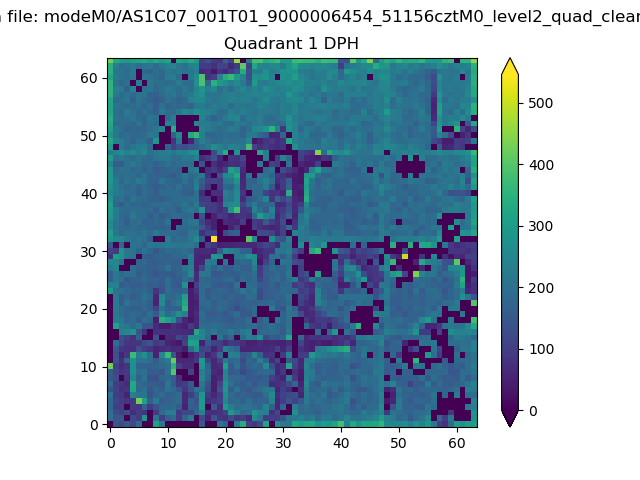 |
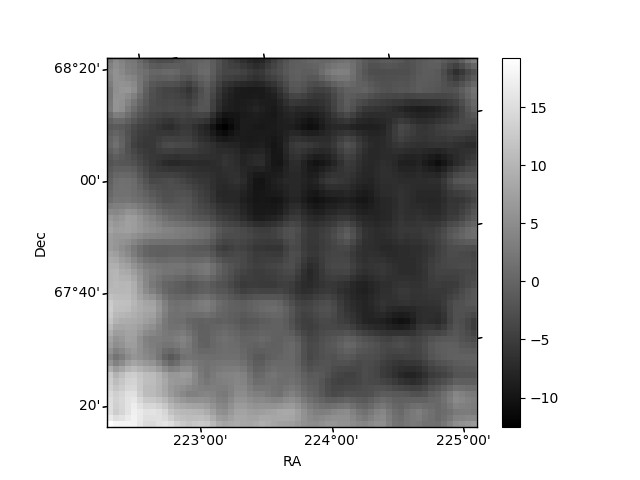
Quadrant B |
|---|---|---|---|
| Quadrant D |  |
 |
Quadrant C |
| Plot type | Count rate plots | Images |
|---|---|---|
| Comparison with Poisson distribution Blue bars denote a histogram of data divided into 1 sec bins. Red curve is a Poisson curve with rate = median count rate of data. |
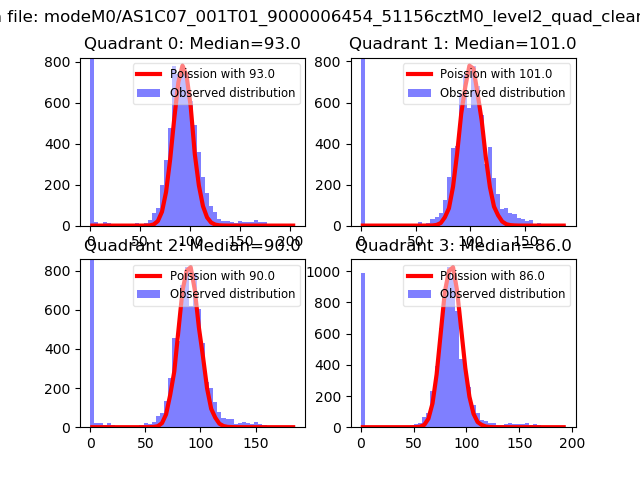 |
 |
| Quadrant-wise count rates Data is divided into 100 sec bins |
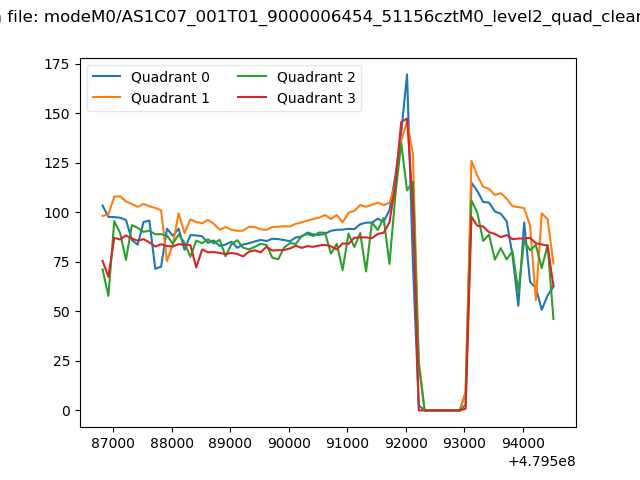 |
|
| Module-wise count rates for Quadrant A Data is divided into 100 sec bins |
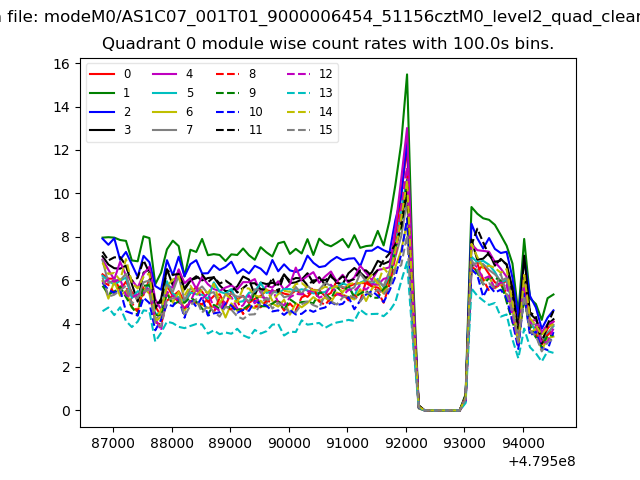 |
 |
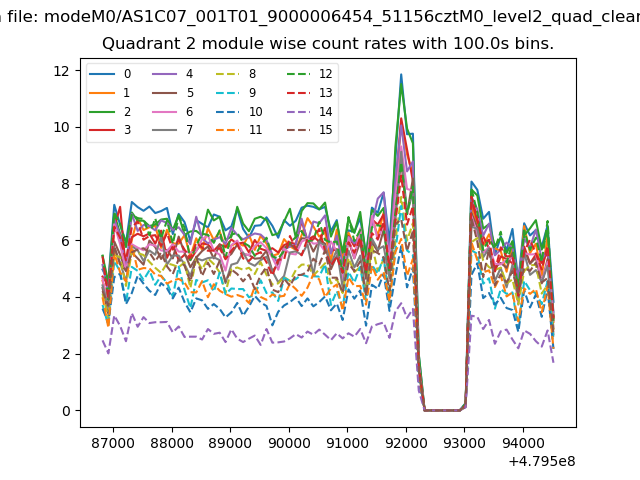
| Module-wise count rates for Quadrant B Data is divided into 100 sec bins |
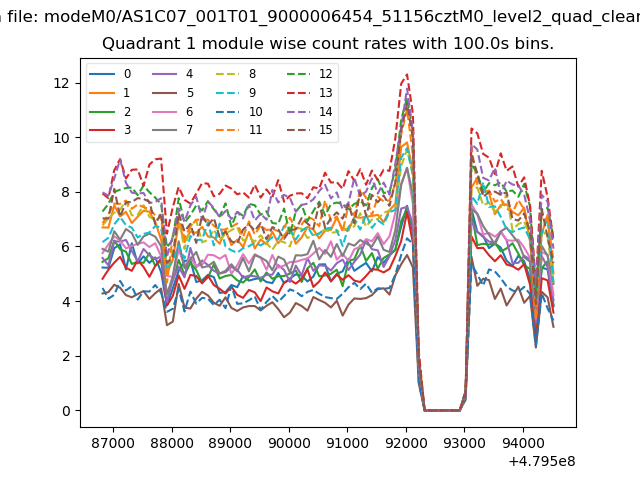 |
 |
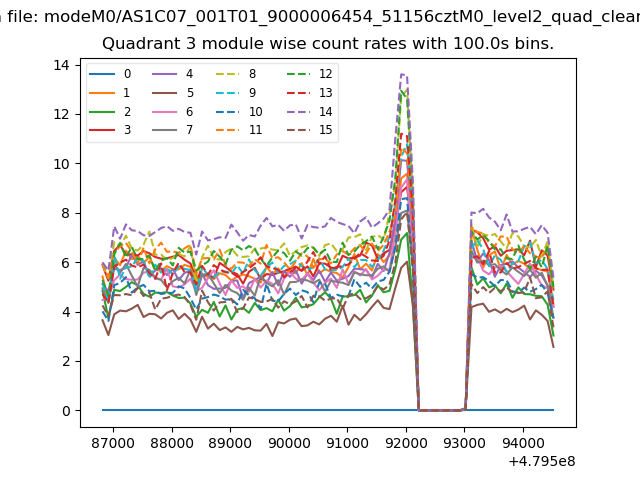
| Module-wise count rates for Quadrant C Data is divided into 100 sec bins |
 |
 |
| Module-wise count rates for Quadrant D Data is divided into 100 sec bins |
 |
 |
| Parameter | Plot |
|---|---|
| CZT HV Monitor | 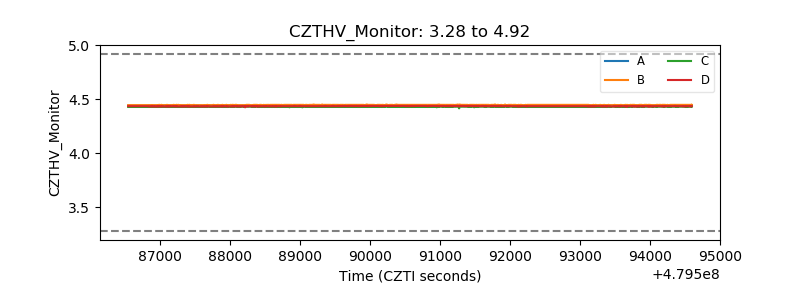 |
| D_VDD | 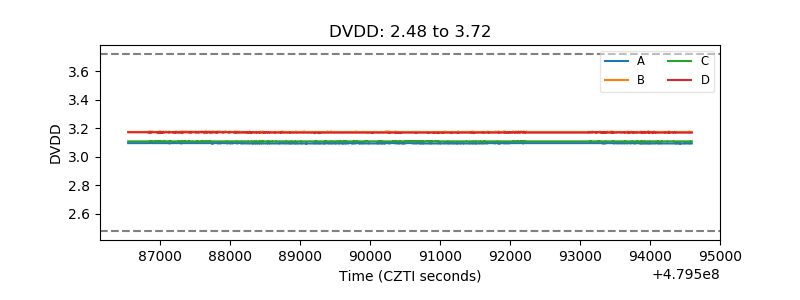 |
| Temperature 1 | 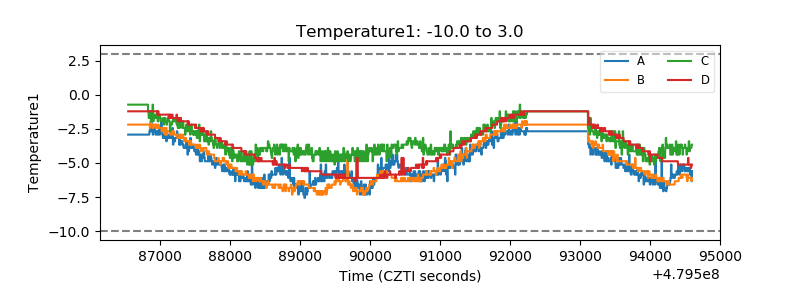 |
| Veto HV Monitor | 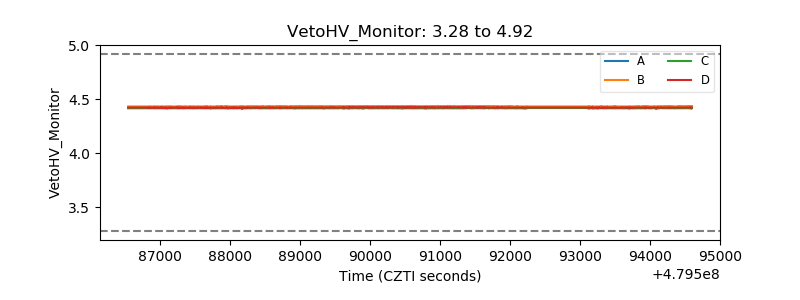 |
| Veto LLD | 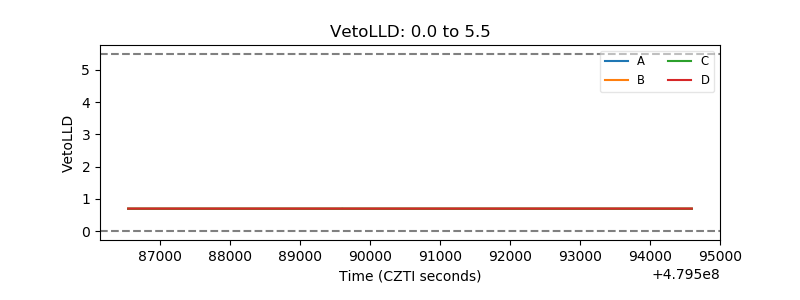 |
| Alpha Counter | 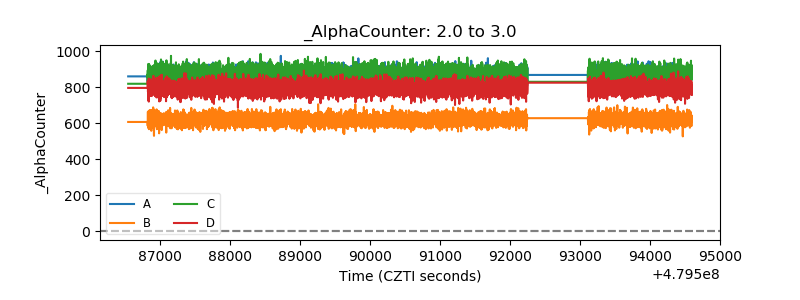 |
| _CPM_Rate | 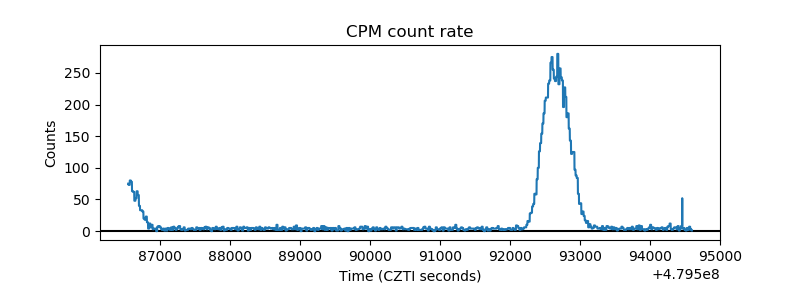 |
| CZT Counter | 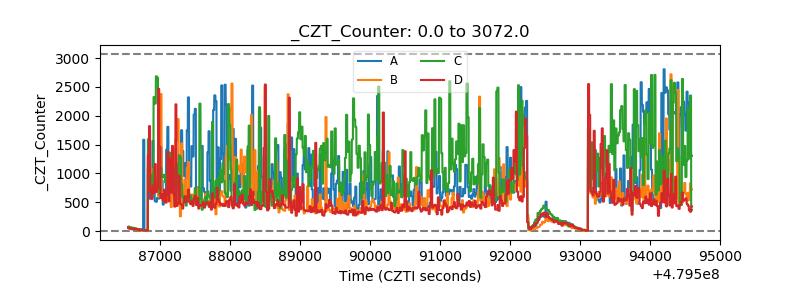 |
| +2.5 Volts monitor | 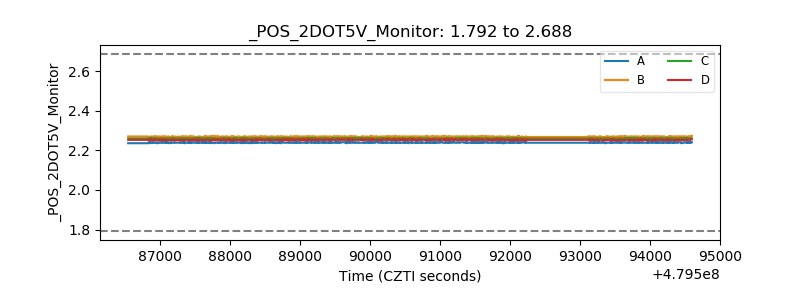 |
| +5 Volts monitor | 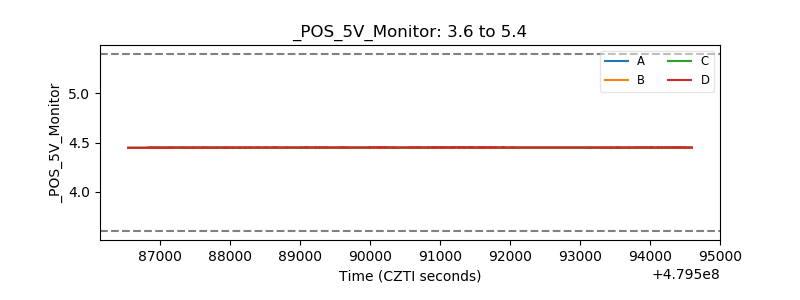 |
| _ROLL_ROT | 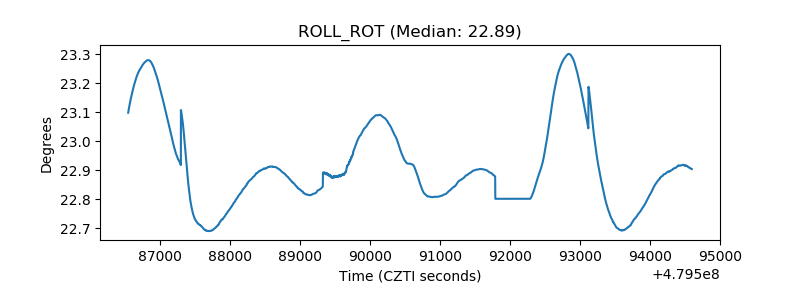 |
| _Roll_DEC | 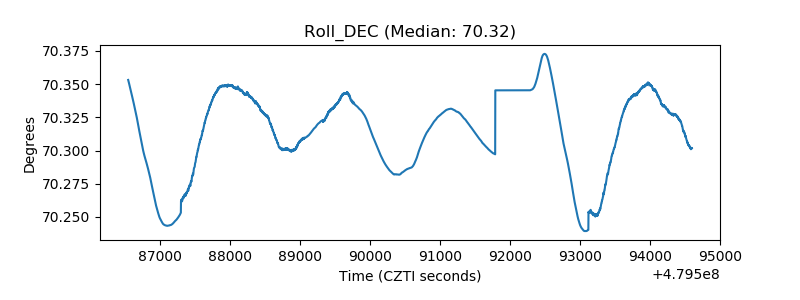 |
| _Roll_RA | 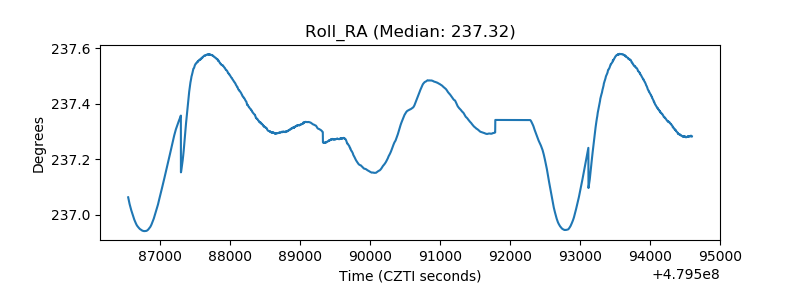 |
| Veto Counter | 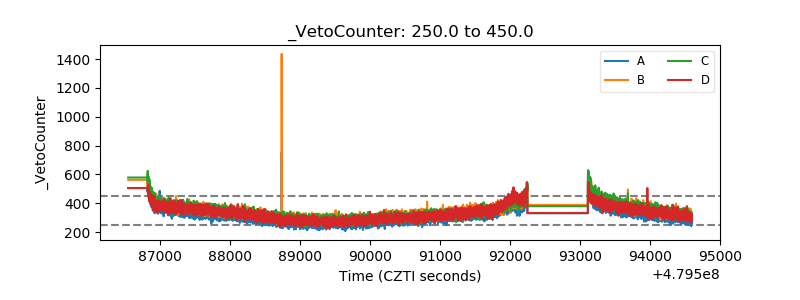 |