| Param | Original file | Final file |
|---|---|---|
| Filename | modeM0/AS1C07_001T01_9000006454_51159cztM0_level2.fits | modeM0/AS1C07_001T01_9000006454_51159cztM0_level2_quad_clean.evt |
| Size (bytes) | 656,838,720 | 96,117,120 |
| Size | 626.4 MB | 91.7 MB |
| Events in quadrant A | 10,182,540 | 494,724 |
| Events in quadrant B | 4,929,188 | 681,905 |
| Events in quadrant C | 4,910,122 | 636,438 |
| Events in quadrant D | 3,770,987 | 628,933 |
| Mode M0 | |||
|---|---|---|---|
| Quadrant | BADHDUFLAG | Total packets | Discarded packets |
| A | 0 | 34936 | 2 |
| B | 0 | 19473 | 2 |
| C | 0 | 19414 | 4 |
| D | 0 | 16105 | 2 |
| Mode SS | |||
|---|---|---|---|
| Quadrant | BADHDUFLAG | Total packets | Discarded packets |
| A | 0 | 136 | 0 |
| B | 0 | 136 | 0 |
| C | 0 | 136 | 0 |
| D | 0 | 136 | 0 |
| Mode M9 | |||
|---|---|---|---|
| Quadrant | BADHDUFLAG | Total packets | Discarded packets |
| A | 0 | 21 | 0 |
| B | 0 | 21 | 0 |
| C | 0 | 21 | 0 |
| D | 0 | 21 | 0 |
| Quadrant | Total seconds | Saturated seconds | Saturation percentage |
|---|---|---|---|
| A | 6725 | 2213 | 32.907063% |
| B | 6726 | 455 | 6.764793% |
| C | 6725 | 357 | 5.308550% |
| D | 6725 | 89 | 1.323420% |
Noise dominated data is calculated using 1-second bins in cleaned event files. If a bin has >2000 counts, and if more than 50% of those come from <1% of pixels, then it is considered to be noise-dominated and hence unusable.
| Quadrant | # 1 sec bins | Bins with >0 counts | Bins with >2000 counts | High rate bins dominated by noise | Noise dominated (total time) | Noise dominated (detector-on time) | Marked lightcurve |
|---|---|---|---|---|---|---|---|
| A | 8769 | 6724 | 2015 | 2015 | 22.98% | 29.97% | 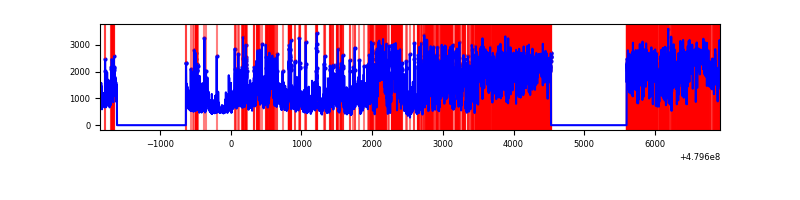 |
| B | 8771 | 6726 | 236 | 236 | 2.69% | 3.51% | 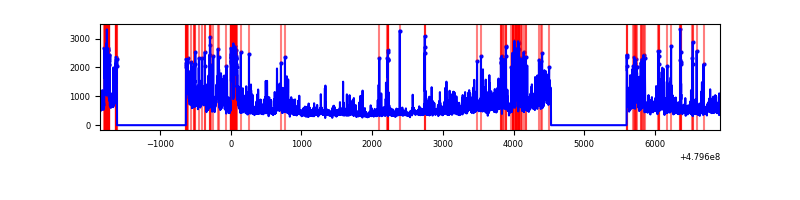 |
| C | 8770 | 6726 | 298 | 298 | 3.40% | 4.43% | 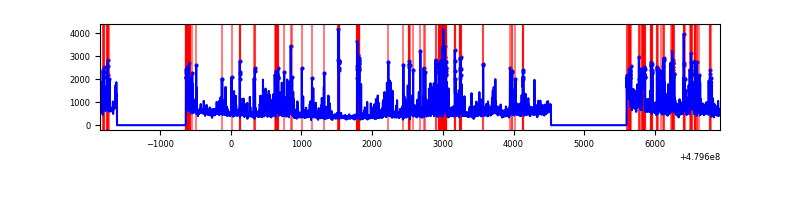 |
| D | 8770 | 6727 | 73 | 73 | 0.83% | 1.09% | 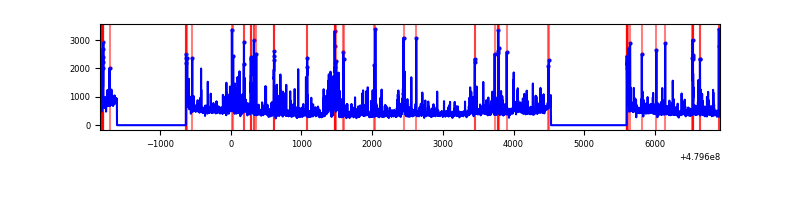 |
Top three noisy pixels from each quadrant. If the there are fewer than three noisy pixels in the level2.evt file, extra rows are filled as -1
| Pixel properties | Quadrant properties | ||||||
|---|---|---|---|---|---|---|---|
| Quadrant | DetID | PixID | Counts | Sigma | Mean | Median | Sigma |
| A | 14 | 254 | 3558857 | 22405.96 | 627 | 611 | 158.8 |
| A | 12 | 3 | 1694634 | 10667.11 | 627 | 611 | 158.8 |
| A | 12 | 80 | 1485067 | 9347.49 | 627 | 611 | 158.8 |
| B | 0 | 197 | 354503 | 2399.35 | 699 | 677 | 147.5 |
| B | 5 | 185 | 308610 | 2088.14 | 699 | 677 | 147.5 |
| B | 10 | 60 | 256032 | 1731.6 | 699 | 677 | 147.5 |
| C | 10 | 171 | 606466 | 3018.47 | 707 | 698 | 200.7 |
| C | 13 | 3 | 454445 | 2260.97 | 707 | 698 | 200.7 |
| C | 4 | 12 | 214286 | 1064.28 | 707 | 698 | 200.7 |
| D | 8 | 176 | 221029 | 1109.74 | 703 | 678 | 198.6 |
| D | 6 | 42 | 202285 | 1015.34 | 703 | 678 | 198.6 |
| D | 2 | 216 | 97959 | 489.93 | 703 | 678 | 198.6 |
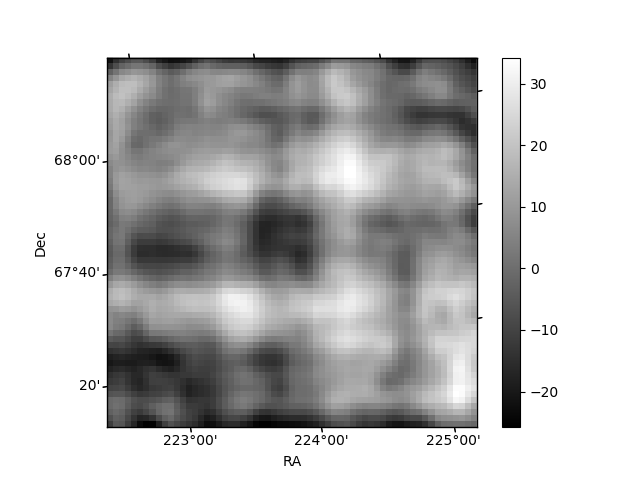
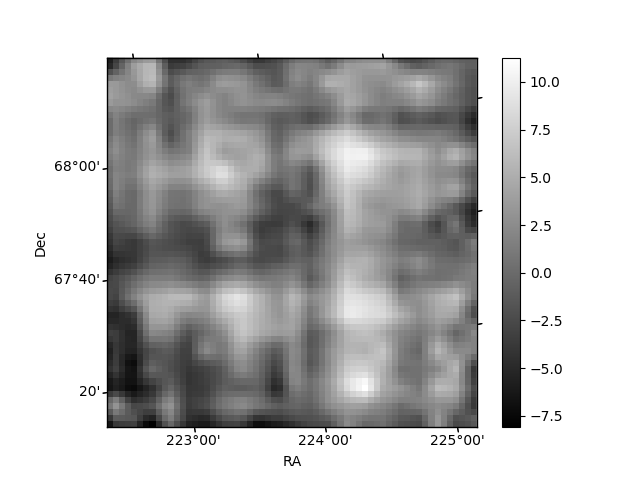
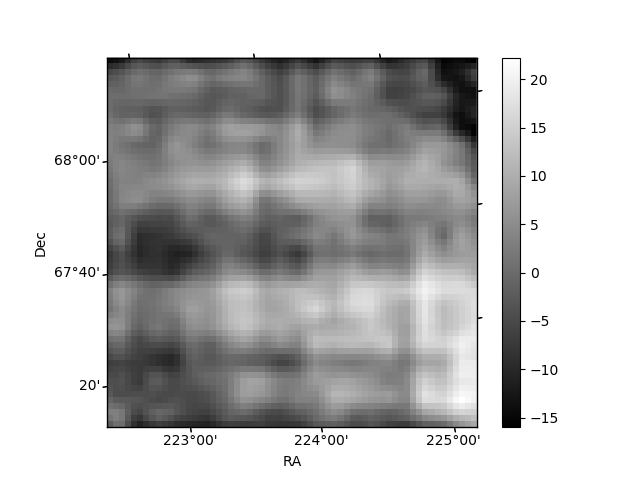
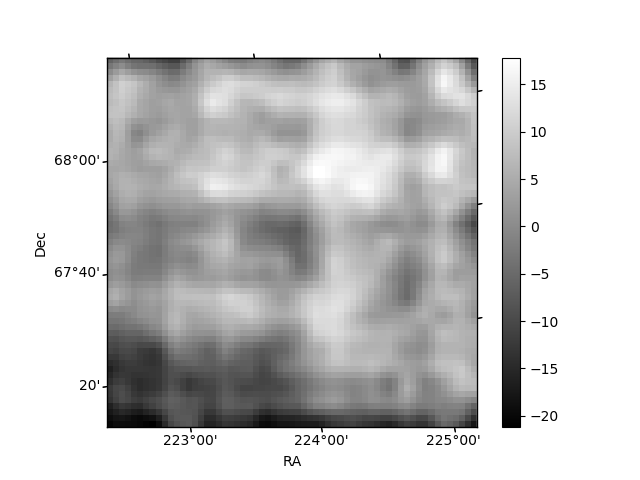
Histogram calculated using DETX and DETY for each event in the final _common_clean file
| Quadrant A | 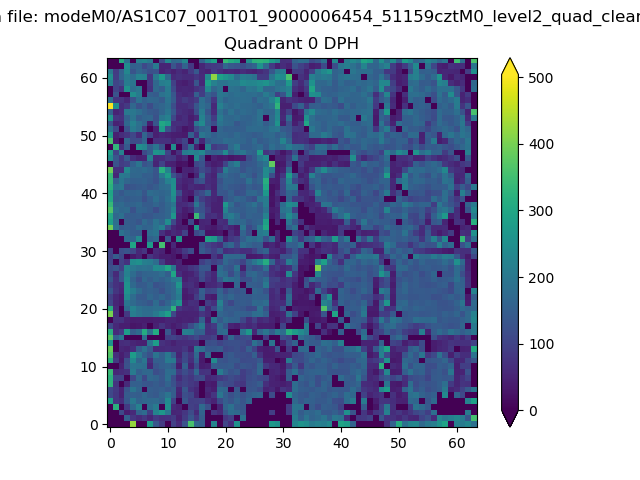 |
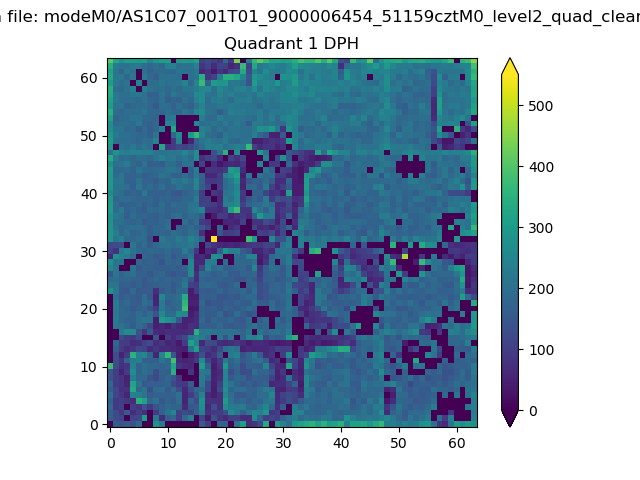 |
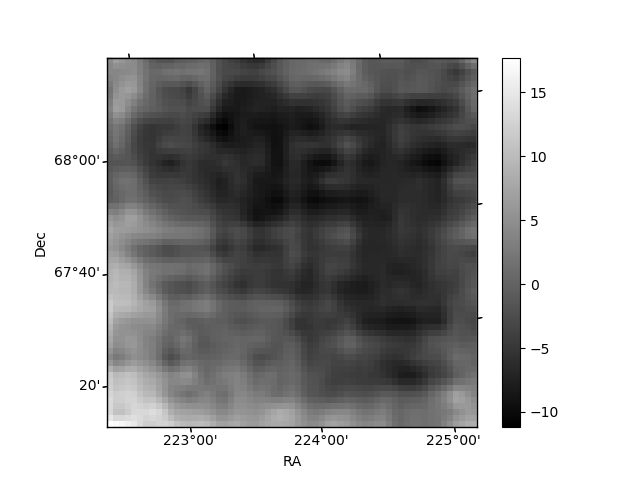
Quadrant B |
|---|---|---|---|
| Quadrant D | 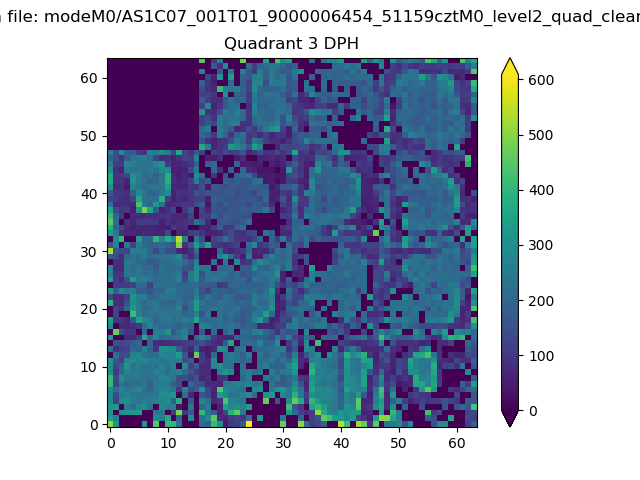 |
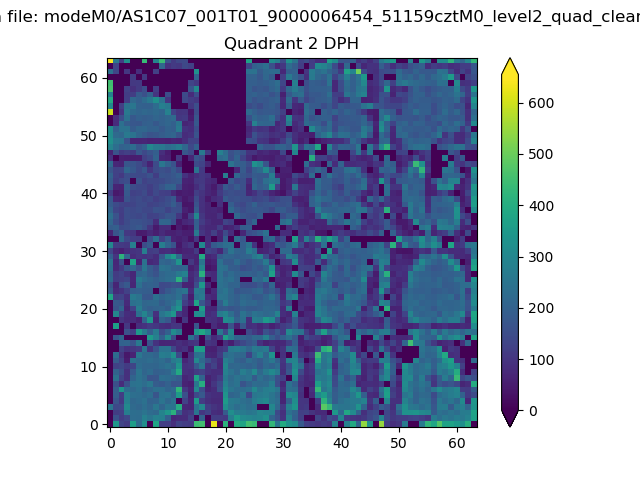 |
Quadrant C |
| Plot type | Count rate plots | Images |
|---|---|---|
| Comparison with Poisson distribution Blue bars denote a histogram of data divided into 1 sec bins. Red curve is a Poisson curve with rate = median count rate of data. |
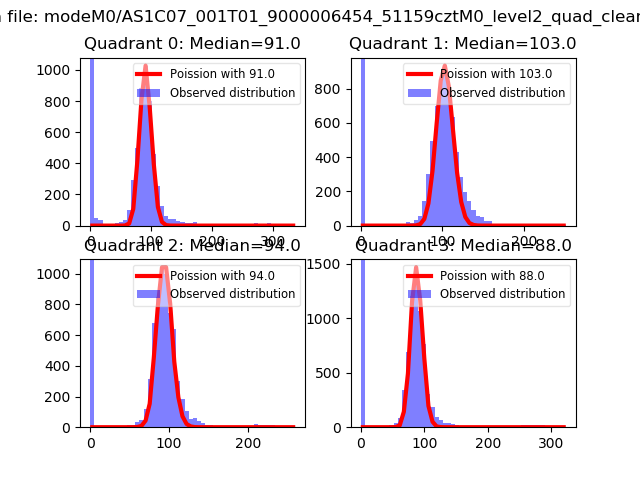 |
 |
| Quadrant-wise count rates Data is divided into 100 sec bins |
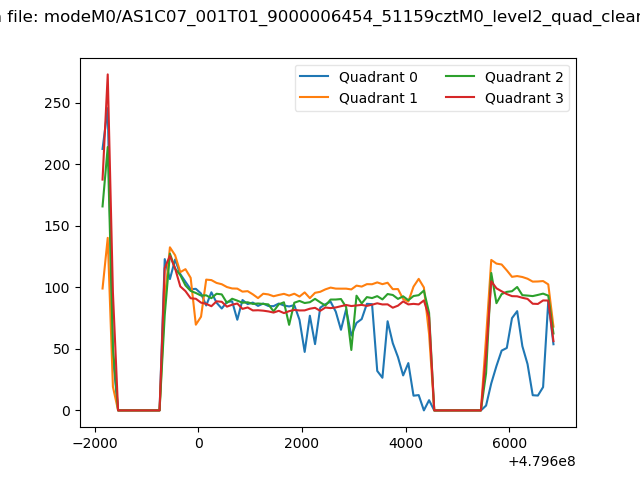 |
|
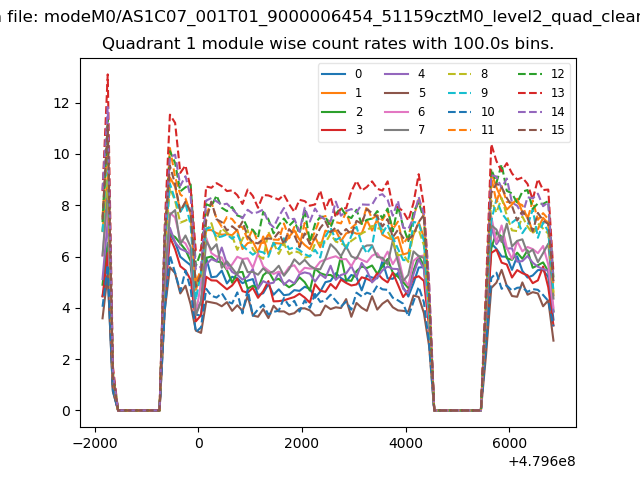
| Module-wise count rates for Quadrant A Data is divided into 100 sec bins |
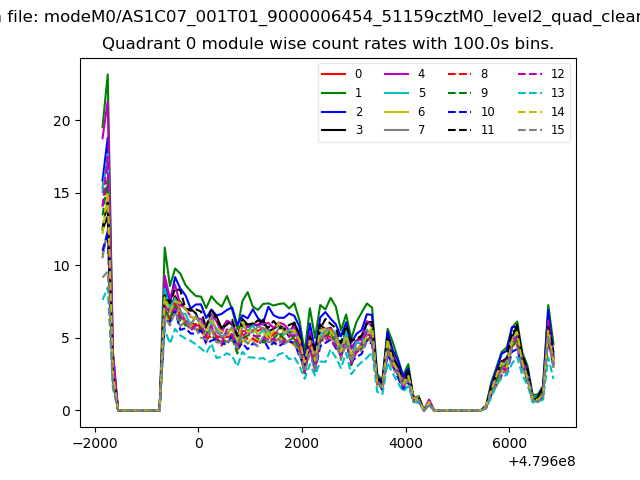 |
 |
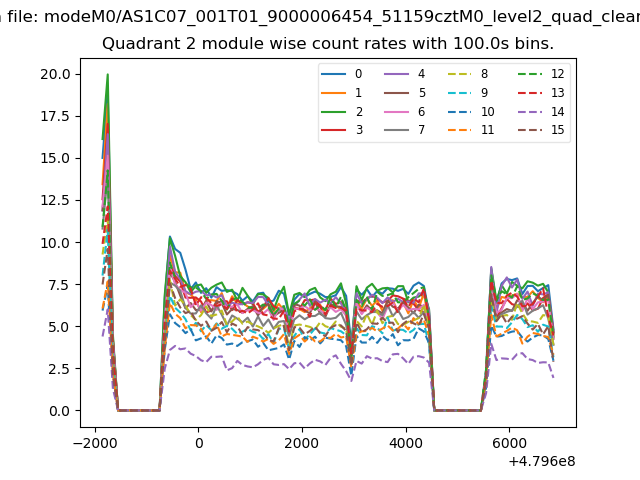
| Module-wise count rates for Quadrant B Data is divided into 100 sec bins |
 |
 |
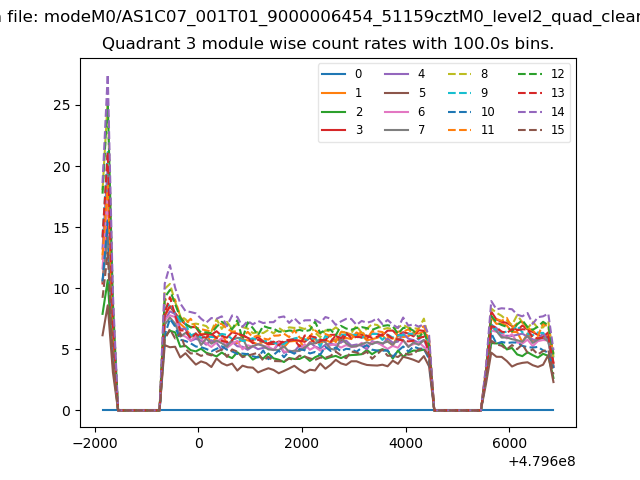
| Module-wise count rates for Quadrant C Data is divided into 100 sec bins |
 |
 |
| Module-wise count rates for Quadrant D Data is divided into 100 sec bins |
 |
 |
| Parameter | Plot |
|---|---|
| CZT HV Monitor | 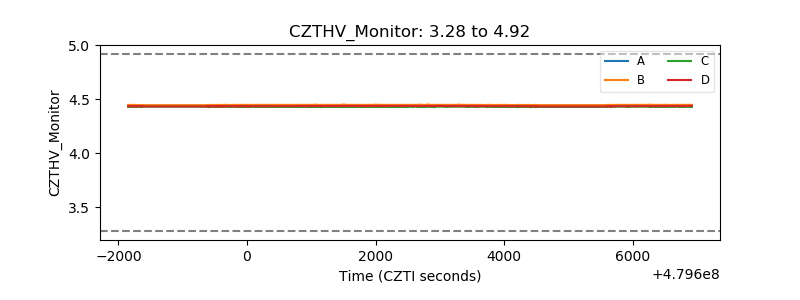 |
| D_VDD | 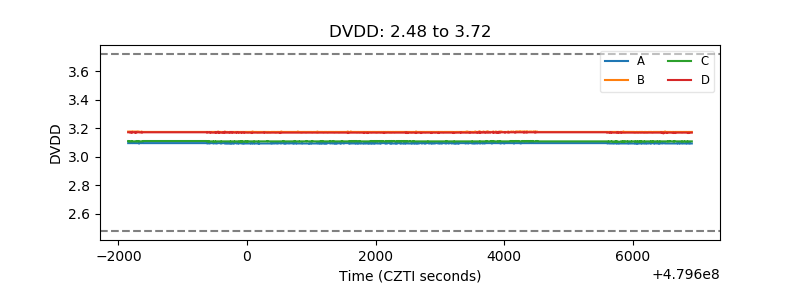 |
| Temperature 1 | 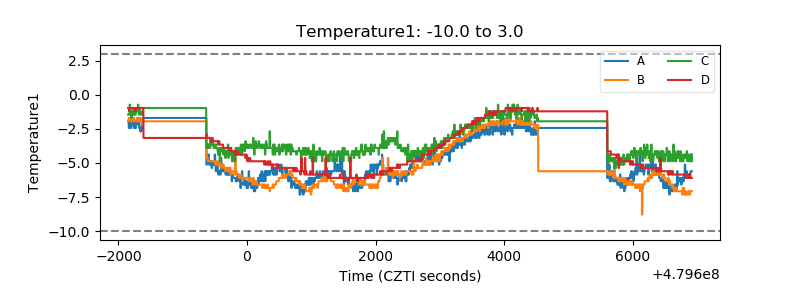 |
| Veto HV Monitor | 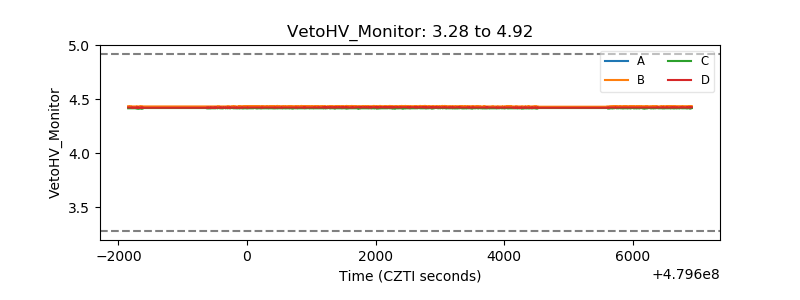 |
| Veto LLD | 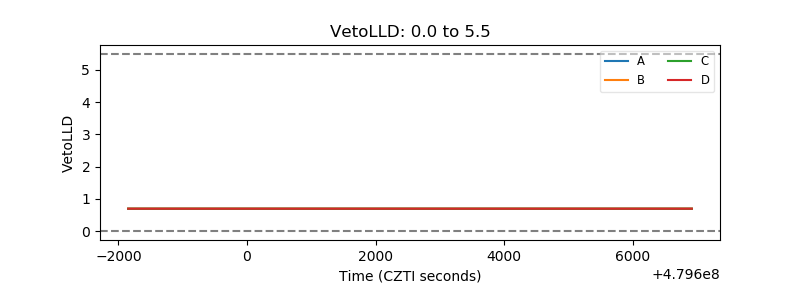 |
| Alpha Counter | 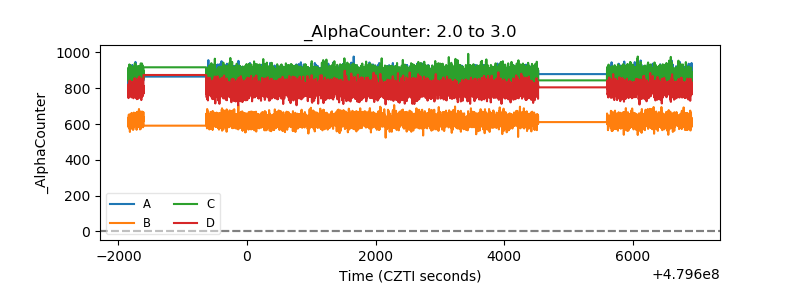 |
| _CPM_Rate | 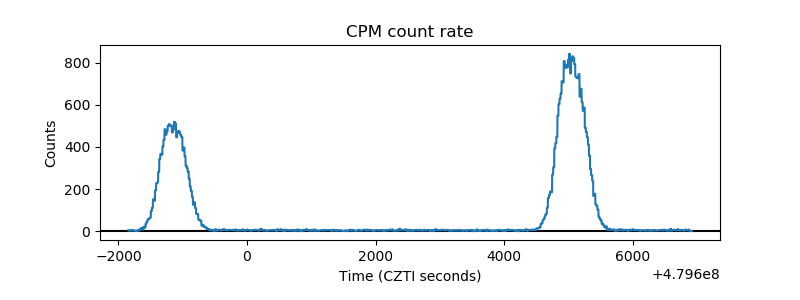 |
| CZT Counter | 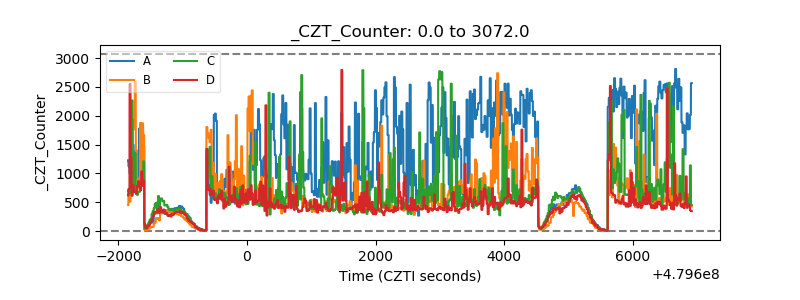 |
| +2.5 Volts monitor | 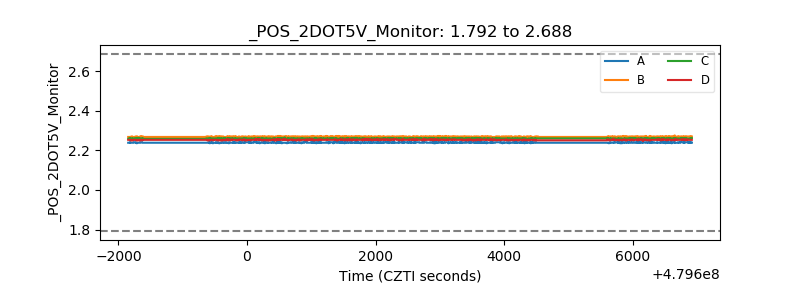 |
| +5 Volts monitor | 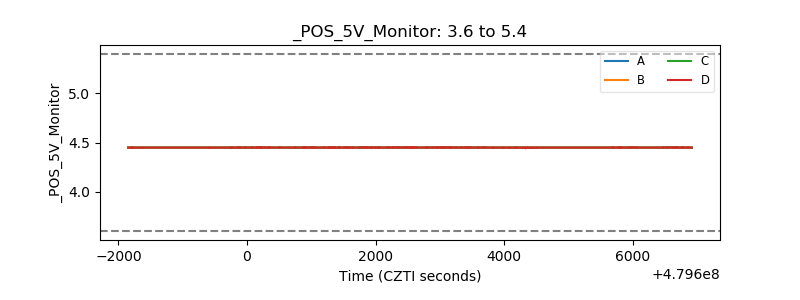 |
| _ROLL_ROT | 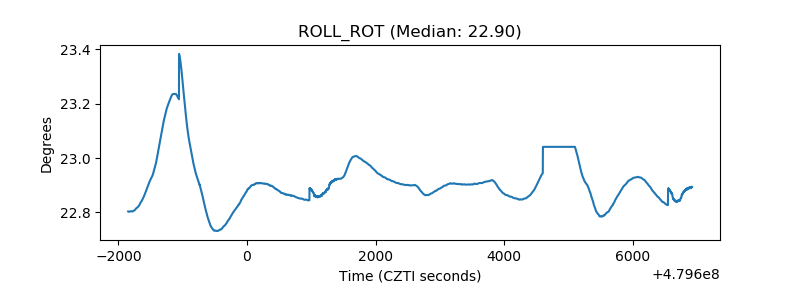 |
| _Roll_DEC | 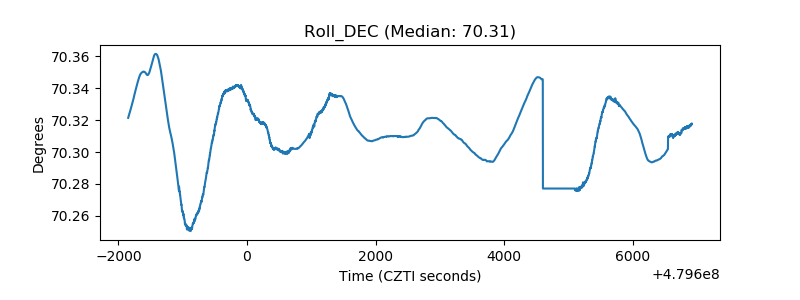 |
| _Roll_RA | 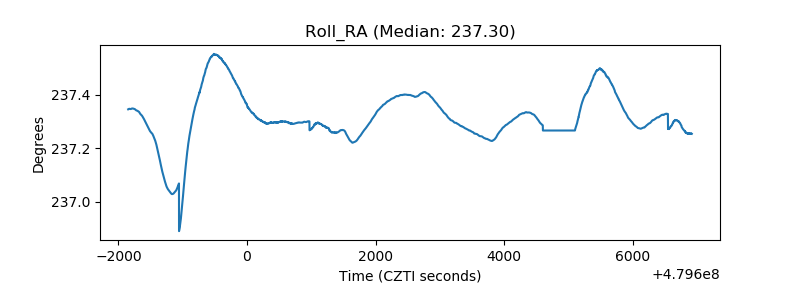 |
| Veto Counter | 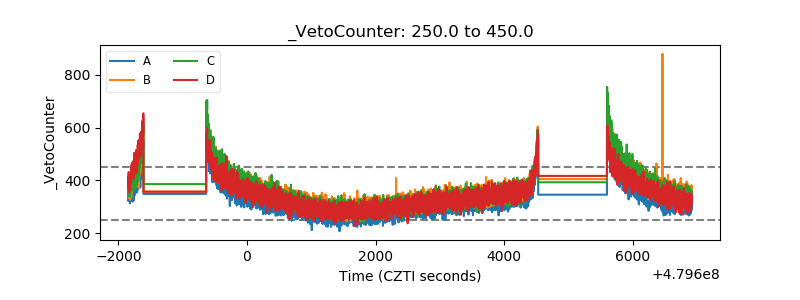 |