| Param | Original file | Final file |
|---|---|---|
| Filename | modeM0/AS1C07_001T01_9000006454_51160cztM0_level2.fits | modeM0/AS1C07_001T01_9000006454_51160cztM0_level2_quad_clean.evt |
| Size (bytes) | 751,944,960 | 89,000,640 |
| Size | 717.1 MB | 84.9 MB |
| Events in quadrant A | 12,970,506 | 325,320 |
| Events in quadrant B | 5,013,277 | 698,112 |
| Events in quadrant C | 5,151,085 | 621,634 |
| Events in quadrant D | 4,175,096 | 577,617 |
| Mode M0 | |||
|---|---|---|---|
| Quadrant | BADHDUFLAG | Total packets | Discarded packets |
| A | 0 | 43140 | 2 |
| B | 0 | 19635 | 2 |
| C | 0 | 20140 | 2 |
| D | 0 | 17526 | 2 |
| Mode SS | |||
|---|---|---|---|
| Quadrant | BADHDUFLAG | Total packets | Discarded packets |
| A | 0 | 138 | 0 |
| B | 0 | 138 | 0 |
| C | 0 | 138 | 0 |
| D | 0 | 138 | 0 |
| Mode M9 | |||
|---|---|---|---|
| Quadrant | BADHDUFLAG | Total packets | Discarded packets |
| A | 0 | 15 | 0 |
| B | 0 | 16 | 0 |
| C | 0 | 16 | 0 |
| D | 0 | 16 | 0 |
| Quadrant | Total seconds | Saturated seconds | Saturation percentage |
|---|---|---|---|
| A | 6772 | 3733 | 55.124040% |
| B | 6772 | 301 | 4.444773% |
| C | 6772 | 355 | 5.242174% |
| D | 6772 | 309 | 4.562906% |
Noise dominated data is calculated using 1-second bins in cleaned event files. If a bin has >2000 counts, and if more than 50% of those come from <1% of pixels, then it is considered to be noise-dominated and hence unusable.
| Quadrant | # 1 sec bins | Bins with >0 counts | Bins with >2000 counts | High rate bins dominated by noise | Noise dominated (total time) | Noise dominated (detector-on time) | Marked lightcurve |
|---|---|---|---|---|---|---|---|
| A | 7892 | 6772 | 3573 | 3573 | 45.27% | 52.76% | 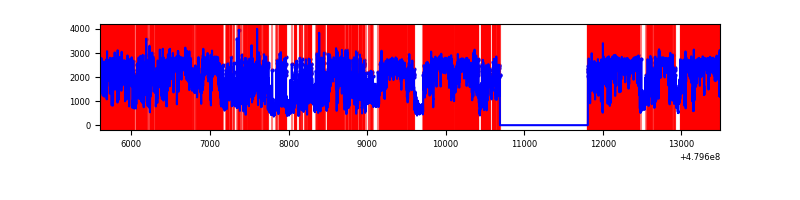 |
| B | 7892 | 6773 | 186 | 186 | 2.36% | 2.75% | 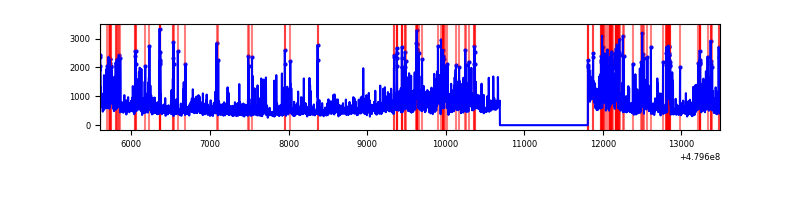 |
| C | 7892 | 6773 | 315 | 315 | 3.99% | 4.65% | 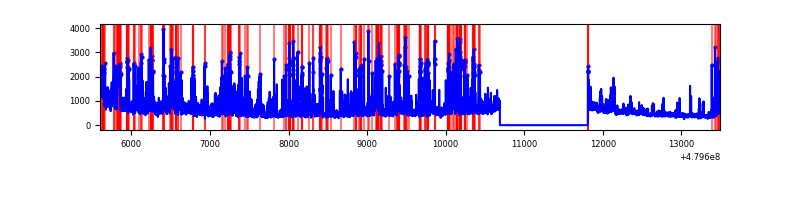 |
| D | 7892 | 6773 | 297 | 297 | 3.76% | 4.39% | 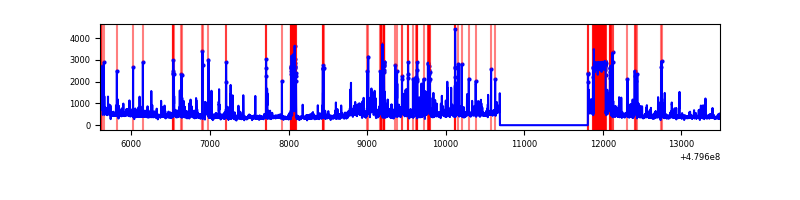 |
Top three noisy pixels from each quadrant. If the there are fewer than three noisy pixels in the level2.evt file, extra rows are filled as -1
| Pixel properties | Quadrant properties | ||||||
|---|---|---|---|---|---|---|---|
| Quadrant | DetID | PixID | Counts | Sigma | Mean | Median | Sigma |
| A | 14 | 254 | 5471634 | 40855.66 | 536 | 524 | 133.9 |
| A | 12 | 80 | 2608325 | 19473.82 | 536 | 524 | 133.9 |
| A | 12 | 3 | 1996515 | 14905.12 | 536 | 524 | 133.9 |
| B | 0 | 197 | 468464 | 3174.94 | 701 | 677 | 147.3 |
| B | 8 | 128 | 445616 | 3019.86 | 701 | 677 | 147.3 |
| B | 10 | 60 | 323009 | 2187.71 | 701 | 677 | 147.3 |
| C | 10 | 171 | 731537 | 3780.92 | 688 | 682 | 193.3 |
| C | 13 | 3 | 249629 | 1287.87 | 688 | 682 | 193.3 |
| C | 4 | 12 | 237933 | 1227.37 | 688 | 682 | 193.3 |
| D | 8 | 176 | 558559 | 2979.92 | 661 | 636 | 187.2 |
| D | 2 | 62 | 476156 | 2539.8 | 661 | 636 | 187.2 |
| D | 15 | 107 | 151805 | 807.41 | 661 | 636 | 187.2 |
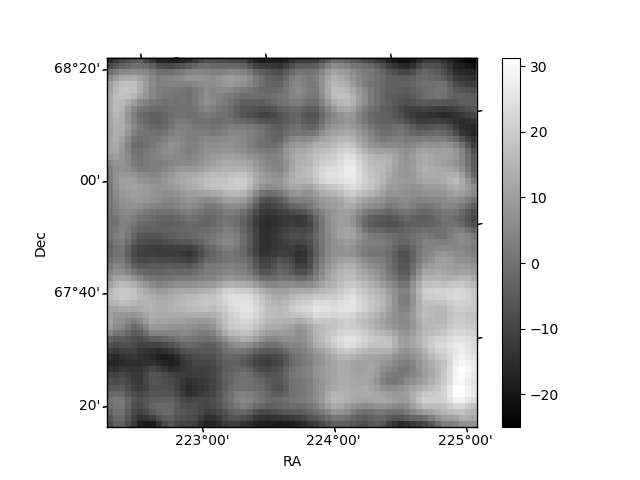
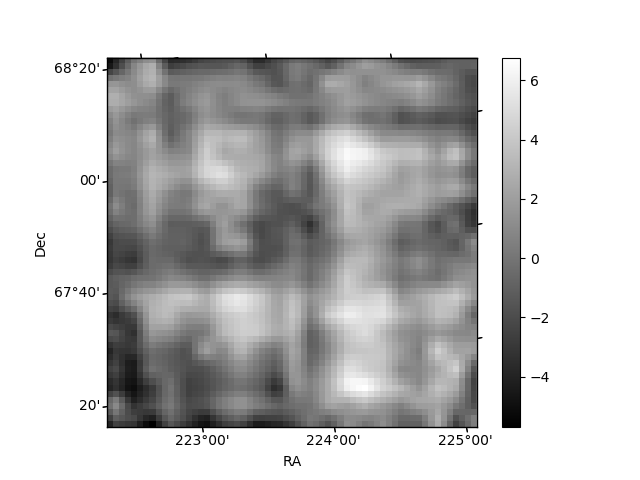
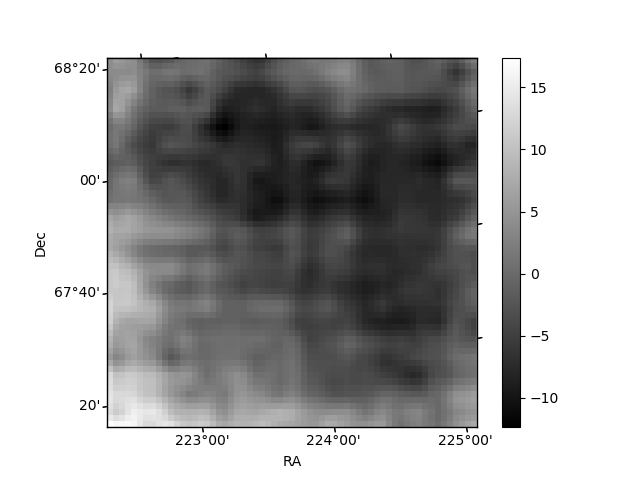
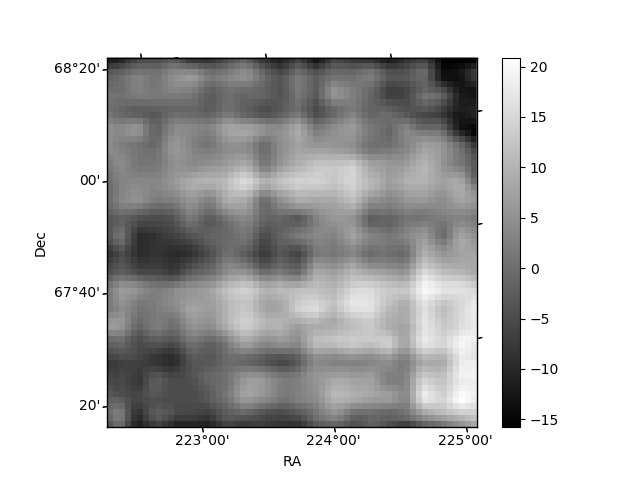
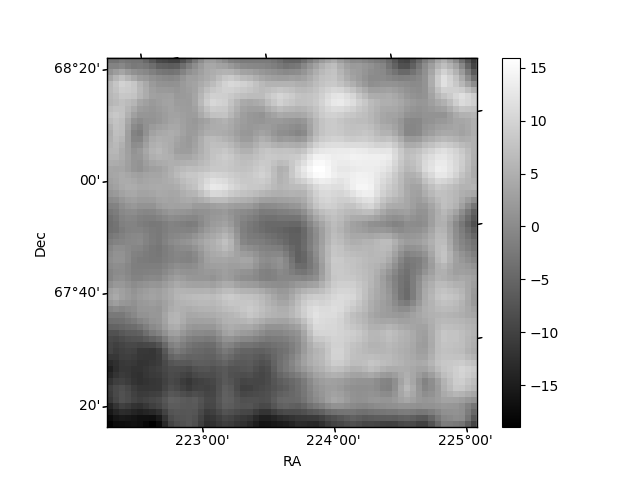
Histogram calculated using DETX and DETY for each event in the final _common_clean file
| Quadrant A | 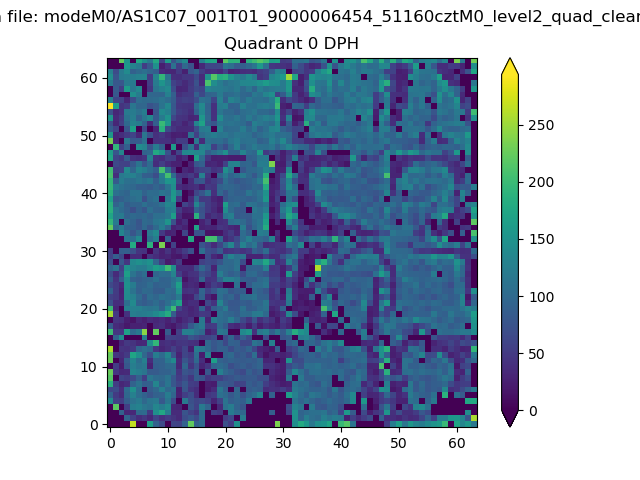 |
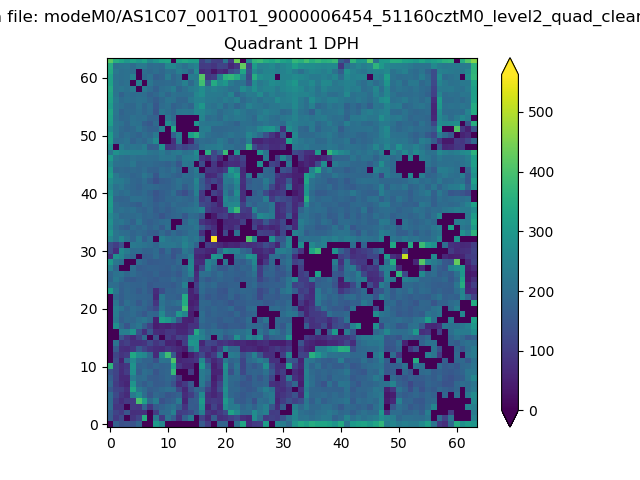 |
Quadrant B |
|---|---|---|---|
| Quadrant D | 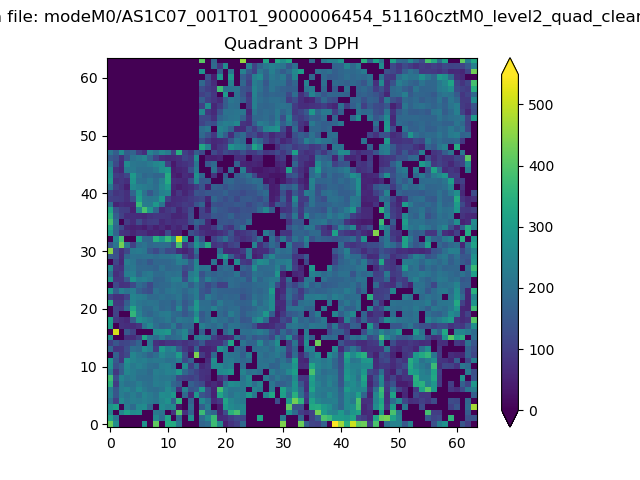 |
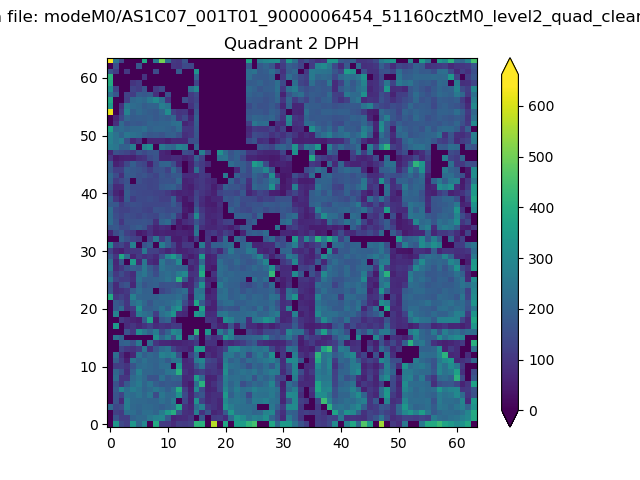 |
Quadrant C |
| Plot type | Count rate plots | Images |
|---|---|---|
| Comparison with Poisson distribution Blue bars denote a histogram of data divided into 1 sec bins. Red curve is a Poisson curve with rate = median count rate of data. |
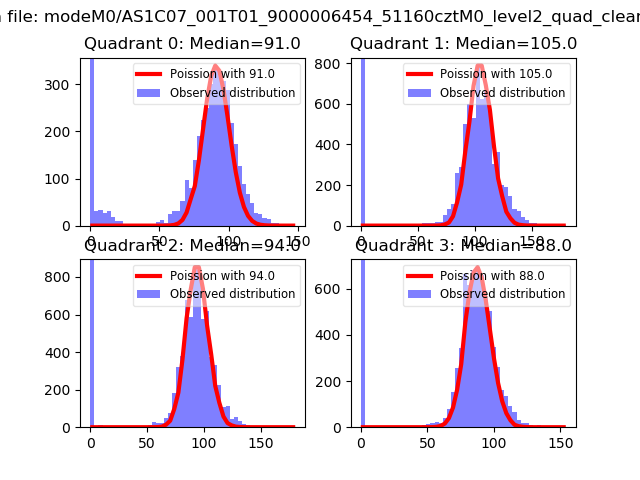 |
 |
| Quadrant-wise count rates Data is divided into 100 sec bins |
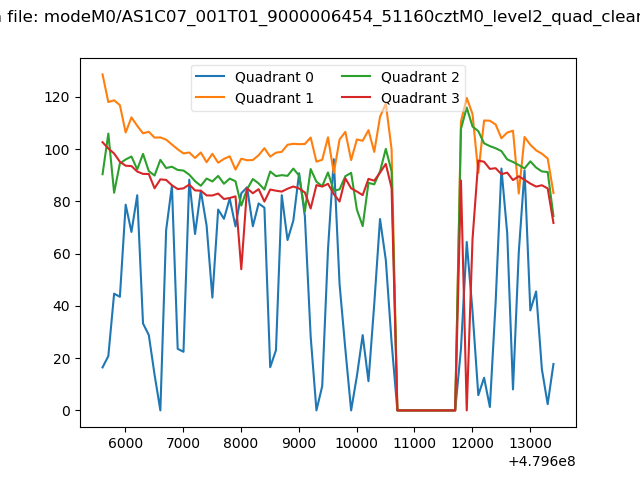 |
|
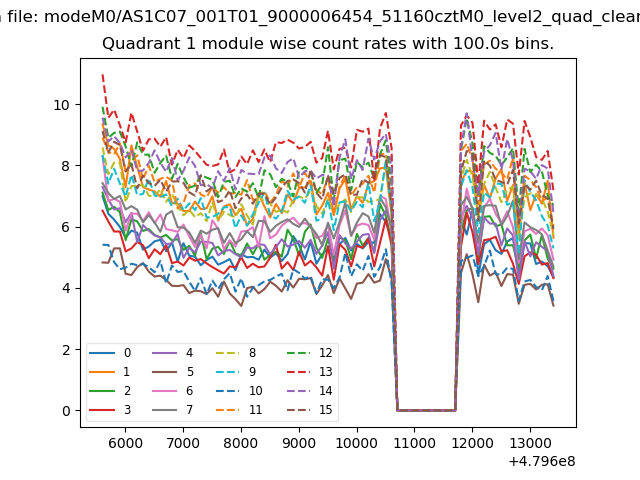
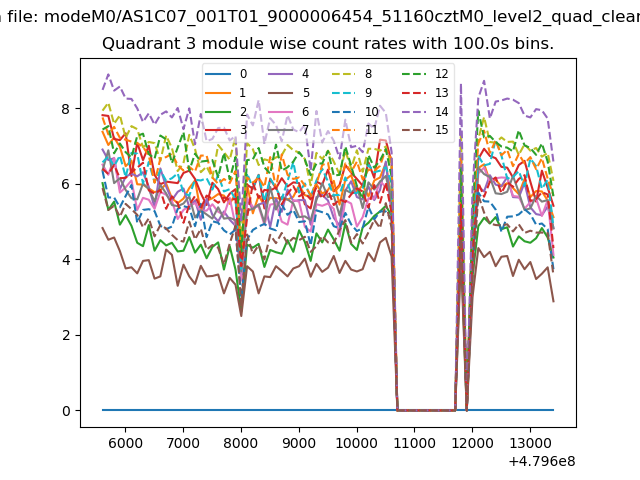
| Module-wise count rates for Quadrant A Data is divided into 100 sec bins |
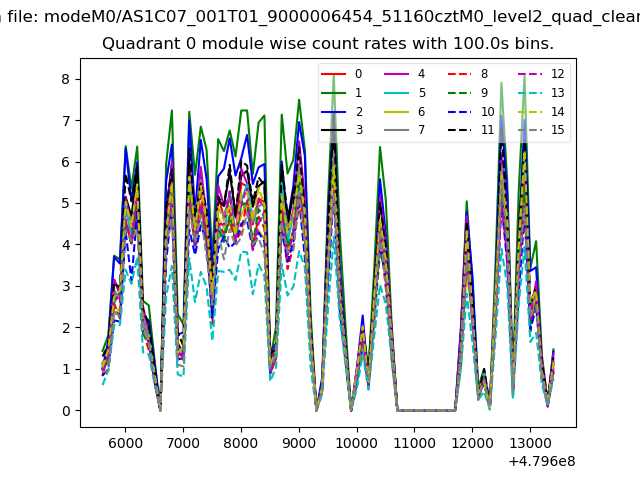 |
 |
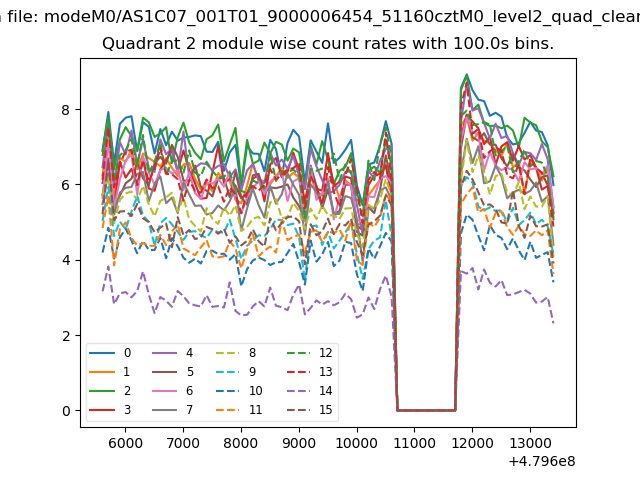
| Module-wise count rates for Quadrant B Data is divided into 100 sec bins |
 |
 |
| Module-wise count rates for Quadrant C Data is divided into 100 sec bins |
 |
 |
| Module-wise count rates for Quadrant D Data is divided into 100 sec bins |
 |
 |
| Parameter | Plot |
|---|---|
| CZT HV Monitor | 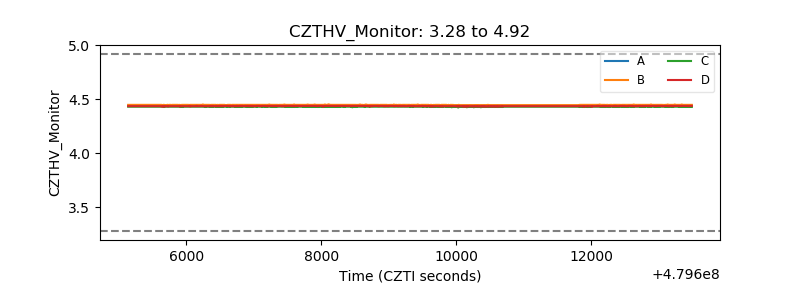 |
| D_VDD | 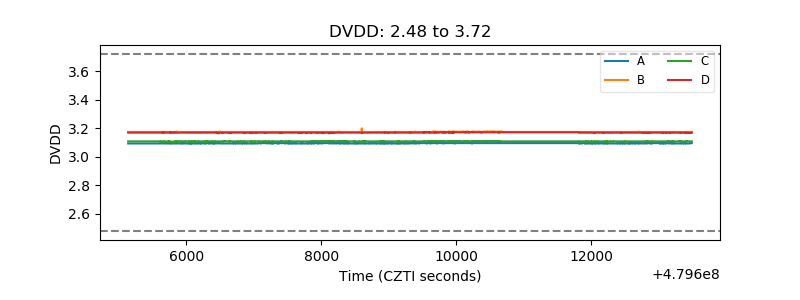 |
| Temperature 1 | 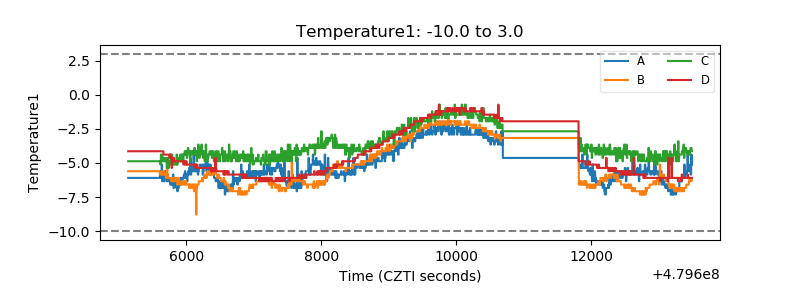 |
| Veto HV Monitor | 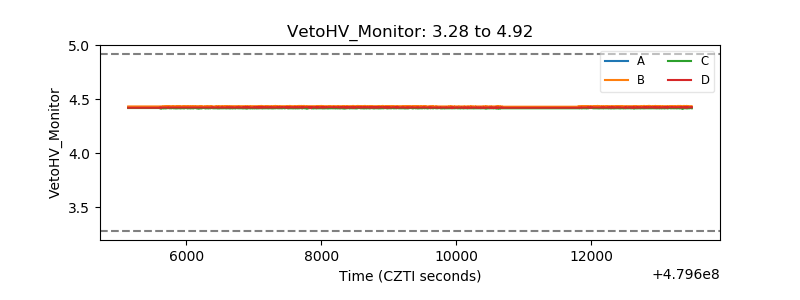 |
| Veto LLD | 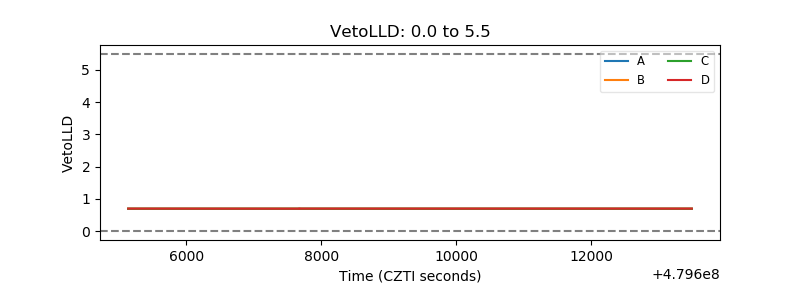 |
| Alpha Counter | 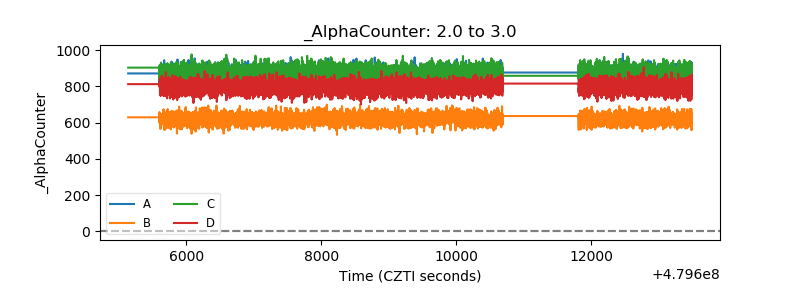 |
| _CPM_Rate | 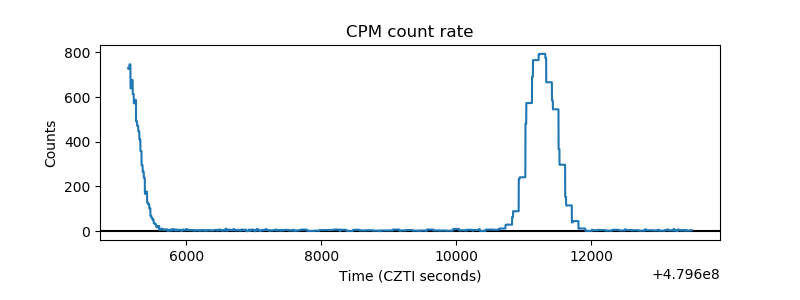 |
| CZT Counter | 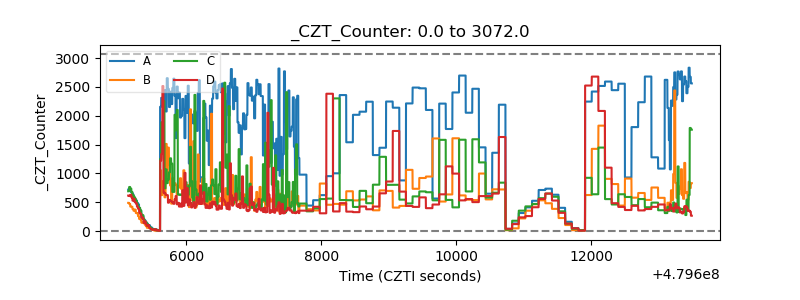 |
| +2.5 Volts monitor | 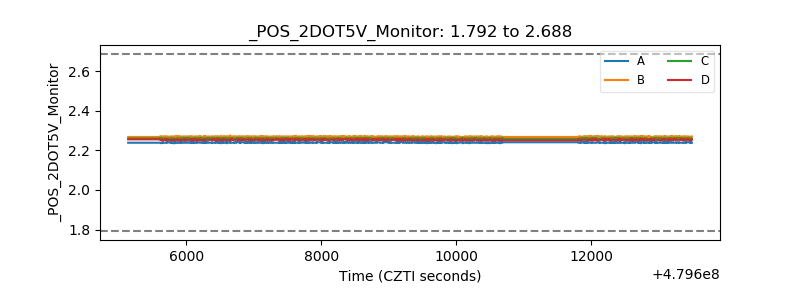 |
| +5 Volts monitor | 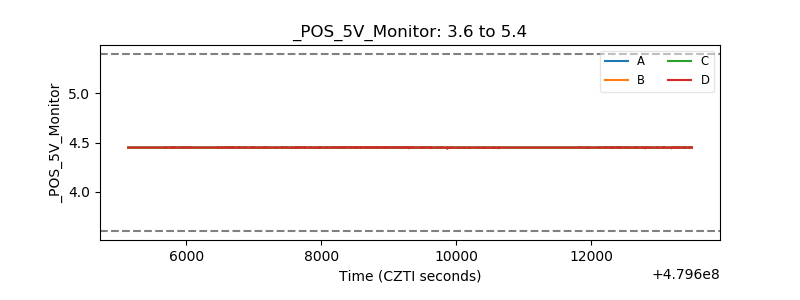 |
| _ROLL_ROT | 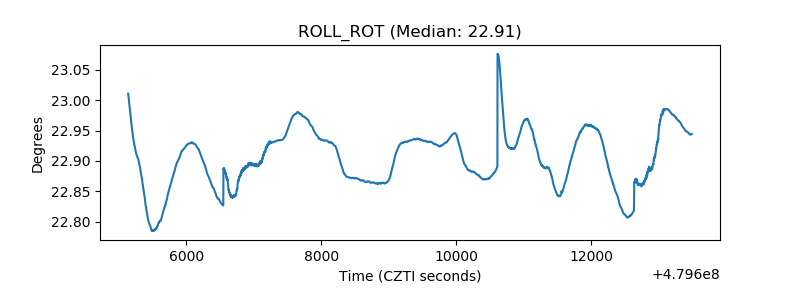 |
| _Roll_DEC | 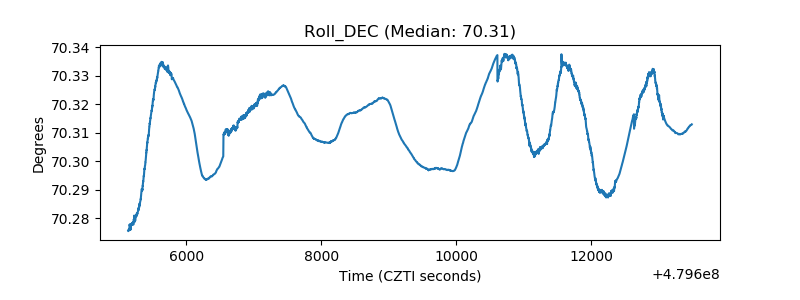 |
| _Roll_RA | 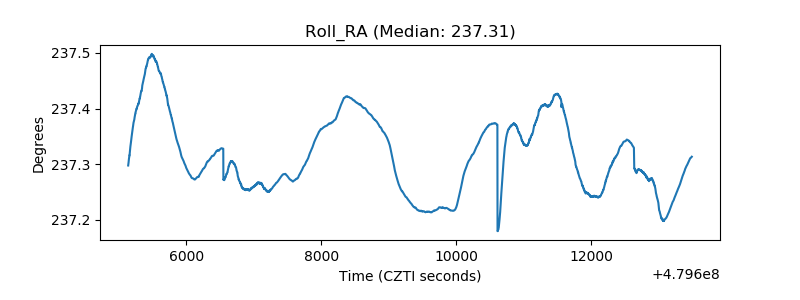 |
| Veto Counter | 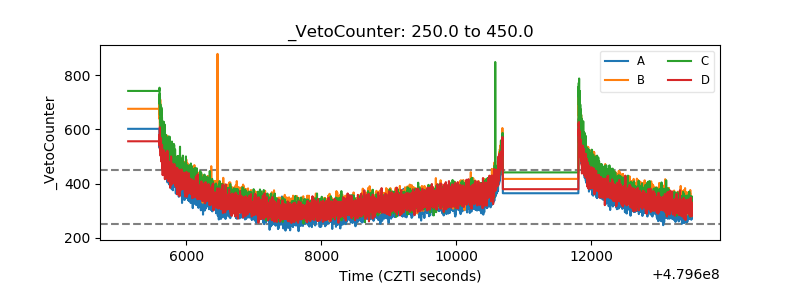 |