| Param | Original file | Final file |
|---|---|---|
| Filename | modeM0/AS1C07_001T01_9000006454_51161cztM0_level2.fits | modeM0/AS1C07_001T01_9000006454_51161cztM0_level2_quad_clean.evt |
| Size (bytes) | 712,638,720 | 88,125,120 |
| Size | 679.6 MB | 84.0 MB |
| Events in quadrant A | 11,860,382 | 372,410 |
| Events in quadrant B | 4,433,697 | 676,581 |
| Events in quadrant C | 4,134,083 | 612,992 |
| Events in quadrant D | 5,443,171 | 548,749 |
| Mode M0 | |||
|---|---|---|---|
| Quadrant | BADHDUFLAG | Total packets | Discarded packets |
| A | 0 | 39769 | 1 |
| B | 0 | 17672 | 1 |
| C | 0 | 16915 | 1 |
| D | 0 | 21035 | 1 |
| Mode SS | |||
|---|---|---|---|
| Quadrant | BADHDUFLAG | Total packets | Discarded packets |
| A | 0 | 132 | 0 |
| B | 0 | 132 | 0 |
| C | 0 | 132 | 0 |
| D | 0 | 132 | 0 |
| Mode M9 | |||
|---|---|---|---|
| Quadrant | BADHDUFLAG | Total packets | Discarded packets |
| A | 0 | 11 | 0 |
| B | 0 | 11 | 0 |
| C | 0 | 11 | 0 |
| D | 0 | 11 | 0 |
| Quadrant | Total seconds | Saturated seconds | Saturation percentage |
|---|---|---|---|
| A | 6564 | 3070 | 46.770262% |
| B | 6564 | 273 | 4.159049% |
| C | 6564 | 179 | 2.726996% |
| D | 6564 | 373 | 5.682511% |
Noise dominated data is calculated using 1-second bins in cleaned event files. If a bin has >2000 counts, and if more than 50% of those come from <1% of pixels, then it is considered to be noise-dominated and hence unusable.
| Quadrant | # 1 sec bins | Bins with >0 counts | Bins with >2000 counts | High rate bins dominated by noise | Noise dominated (total time) | Noise dominated (detector-on time) | Marked lightcurve |
|---|---|---|---|---|---|---|---|
| A | 7653 | 6564 | 3038 | 3038 | 39.70% | 46.28% | 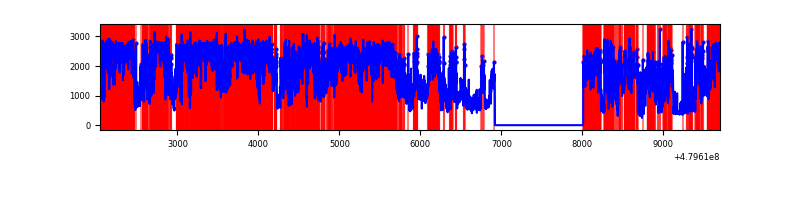 |
| B | 7654 | 6564 | 173 | 173 | 2.26% | 2.64% | 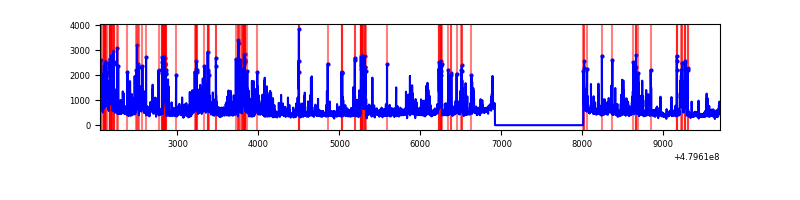 |
| C | 7654 | 6564 | 130 | 130 | 1.70% | 1.98% | 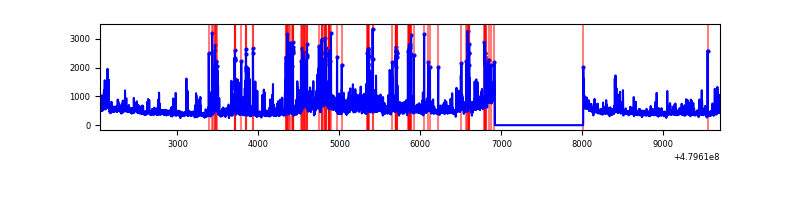 |
| D | 7654 | 6564 | 307 | 307 | 4.01% | 4.68% | 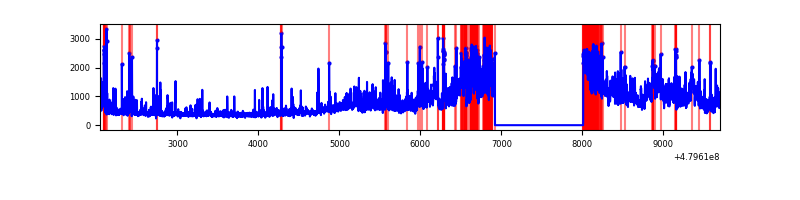 |
Top three noisy pixels from each quadrant. If the there are fewer than three noisy pixels in the level2.evt file, extra rows are filled as -1
| Pixel properties | Quadrant properties | ||||||
|---|---|---|---|---|---|---|---|
| Quadrant | DetID | PixID | Counts | Sigma | Mean | Median | Sigma |
| A | 12 | 80 | 4234502 | 30281.85 | 561 | 547 | 139.8 |
| A | 14 | 254 | 3644419 | 26061.5 | 561 | 547 | 139.8 |
| A | 12 | 3 | 1144060 | 8178.57 | 561 | 547 | 139.8 |
| B | 10 | 60 | 563626 | 3877.01 | 677 | 653 | 145.2 |
| B | 8 | 128 | 427341 | 2938.46 | 677 | 653 | 145.2 |
| B | 4 | 171 | 130105 | 891.49 | 677 | 653 | 145.2 |
| C | 13 | 3 | 262526 | 1426.28 | 663 | 658 | 183.6 |
| C | 4 | 13 | 226670 | 1230.99 | 663 | 658 | 183.6 |
| C | 10 | 171 | 207639 | 1127.34 | 663 | 658 | 183.6 |
| D | 8 | 176 | 2183640 | 12147.39 | 635 | 614 | 179.7 |
| D | 7 | 80 | 279023 | 1549.2 | 635 | 614 | 179.7 |
| D | 10 | 172 | 97916 | 541.43 | 635 | 614 | 179.7 |
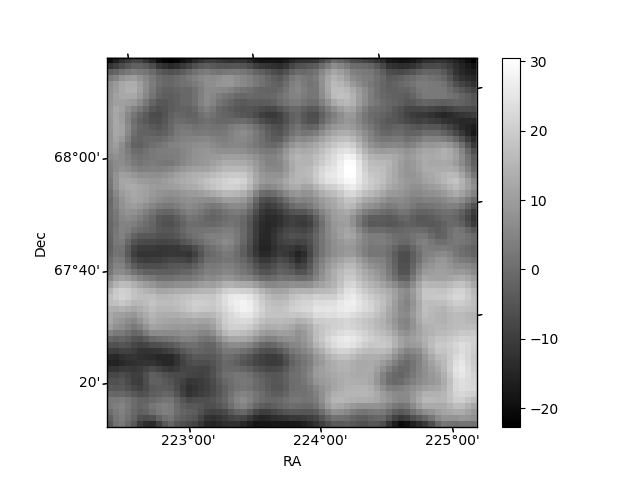
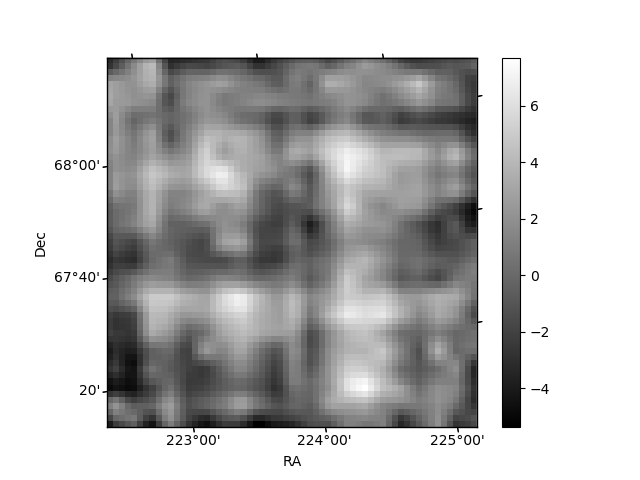
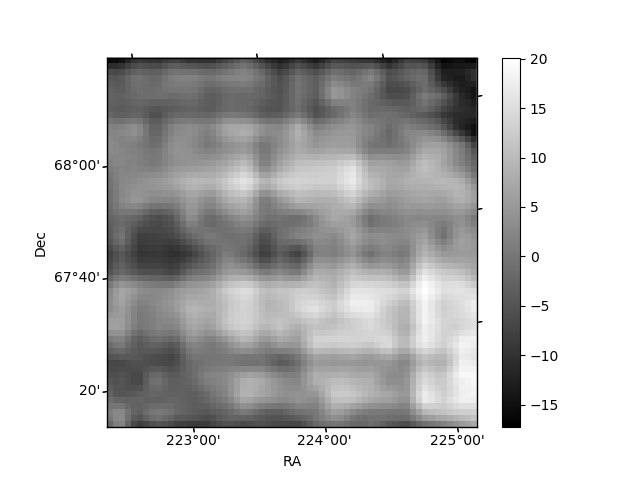
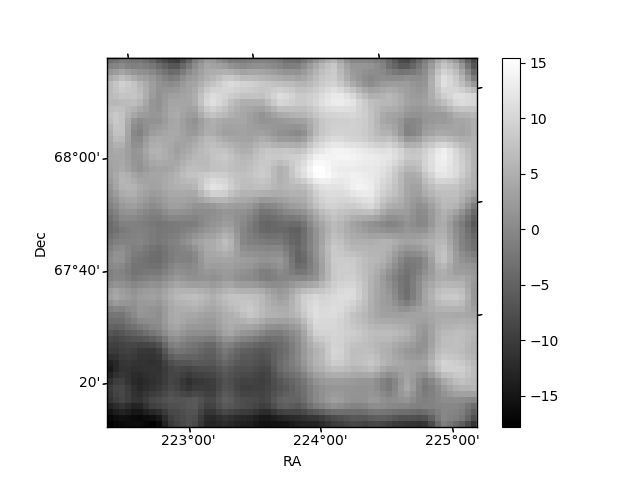
Histogram calculated using DETX and DETY for each event in the final _common_clean file
| Quadrant A | 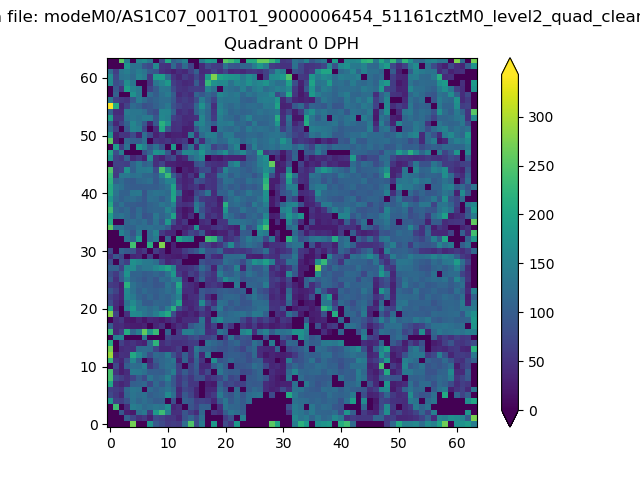 |
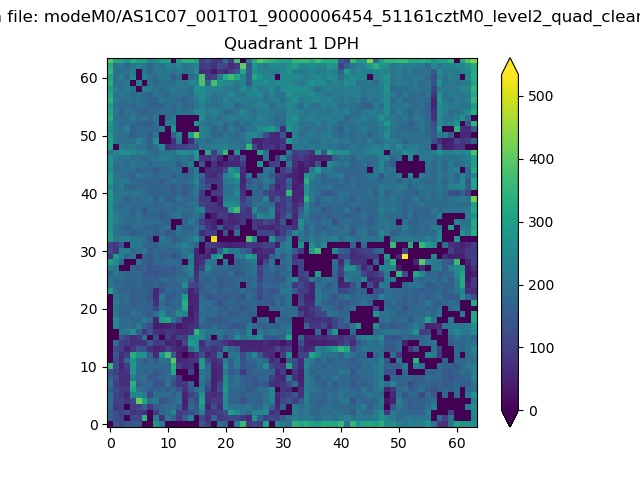 |
Quadrant B |
|---|---|---|---|
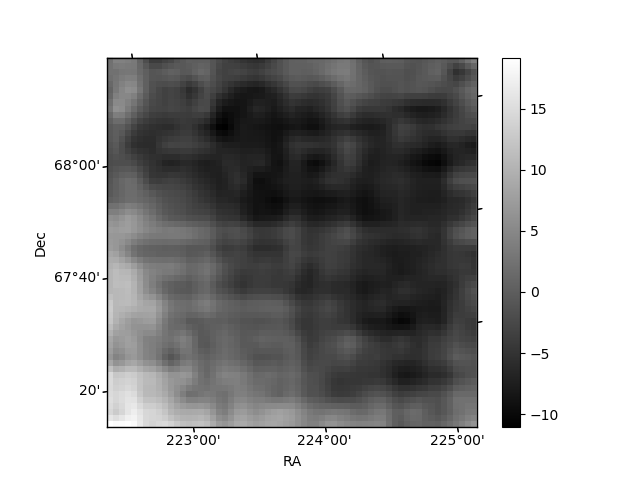
| Quadrant D | 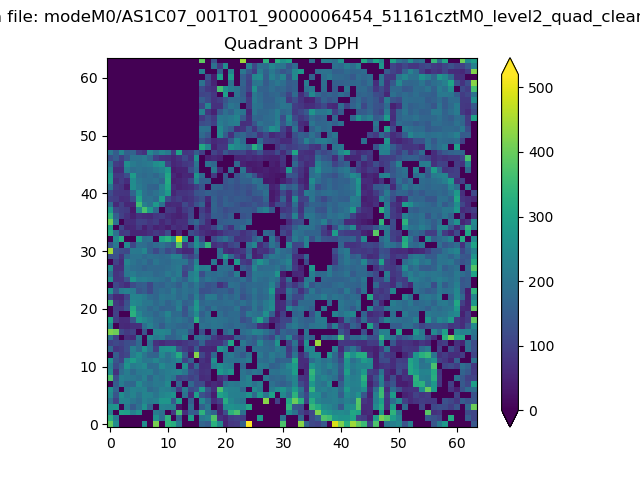 |
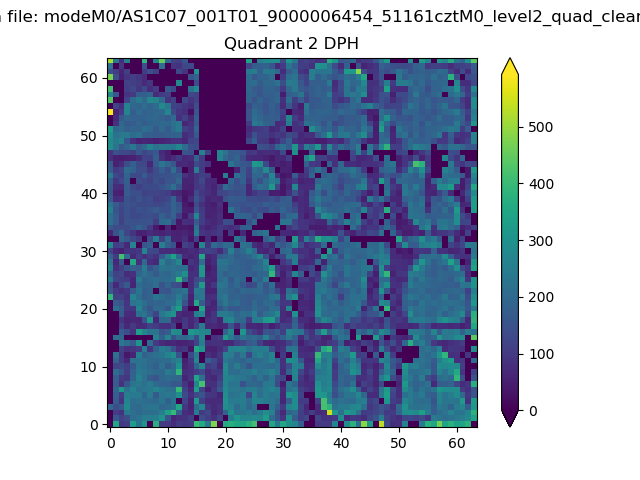 |
Quadrant C |
| Plot type | Count rate plots | Images |
|---|---|---|
| Comparison with Poisson distribution Blue bars denote a histogram of data divided into 1 sec bins. Red curve is a Poisson curve with rate = median count rate of data. |
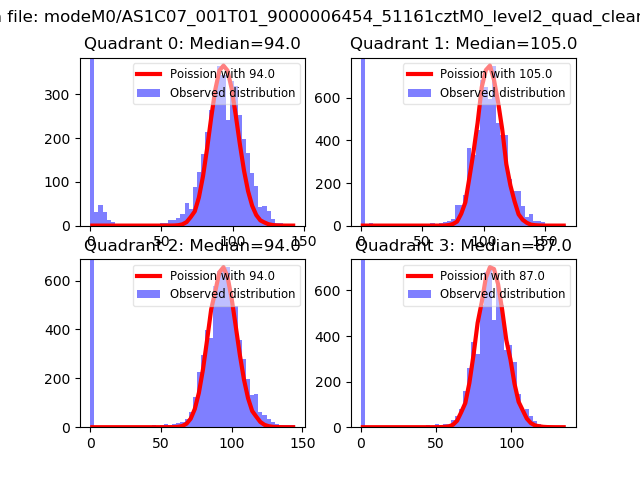 |
 |
| Quadrant-wise count rates Data is divided into 100 sec bins |
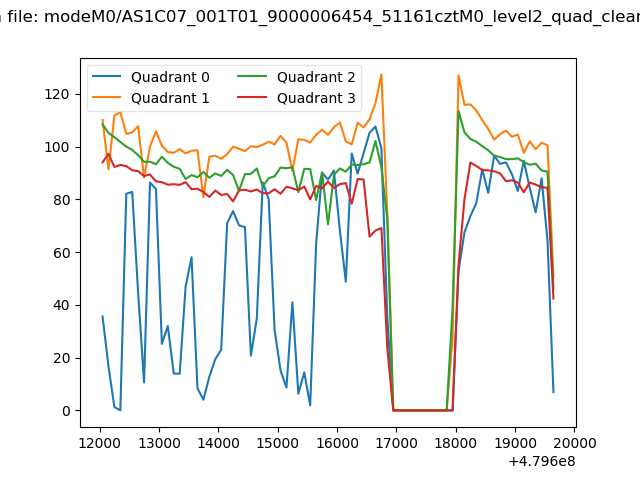 |
|
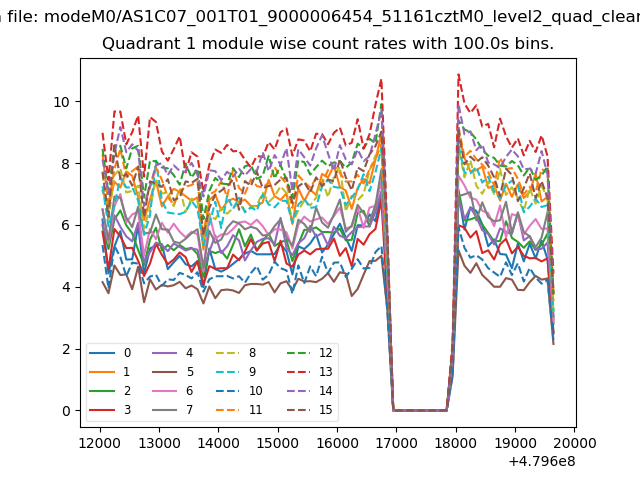
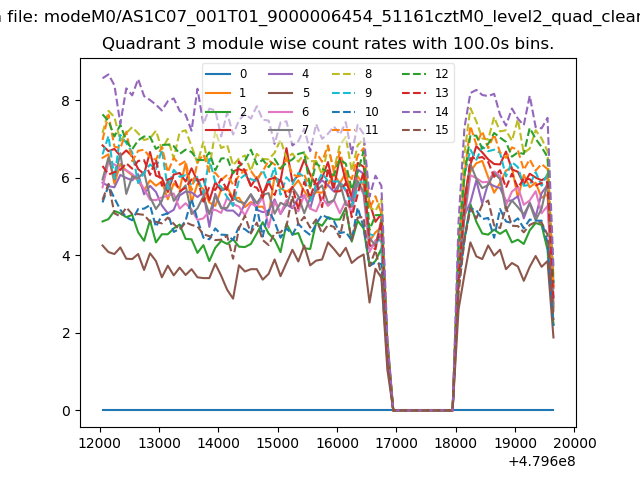
| Module-wise count rates for Quadrant A Data is divided into 100 sec bins |
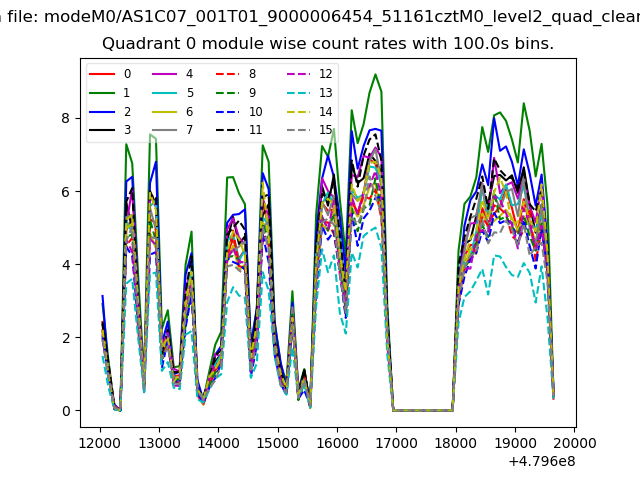 |
 |
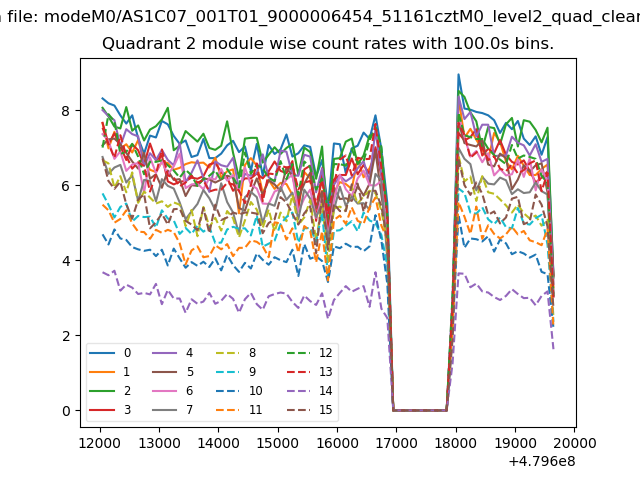
| Module-wise count rates for Quadrant B Data is divided into 100 sec bins |
 |
 |
| Module-wise count rates for Quadrant C Data is divided into 100 sec bins |
 |
 |
| Module-wise count rates for Quadrant D Data is divided into 100 sec bins |
 |
 |
| Parameter | Plot |
|---|---|
| CZT HV Monitor | 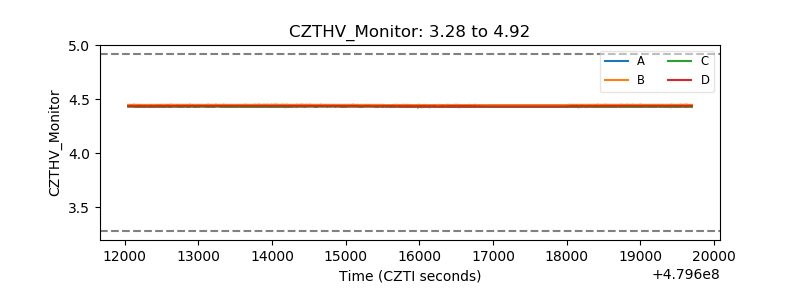 |
| D_VDD | 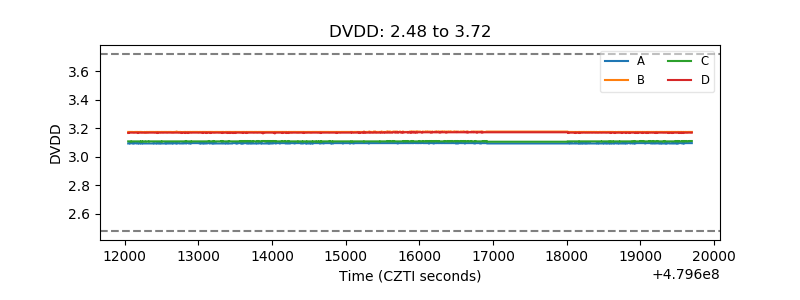 |
| Temperature 1 | 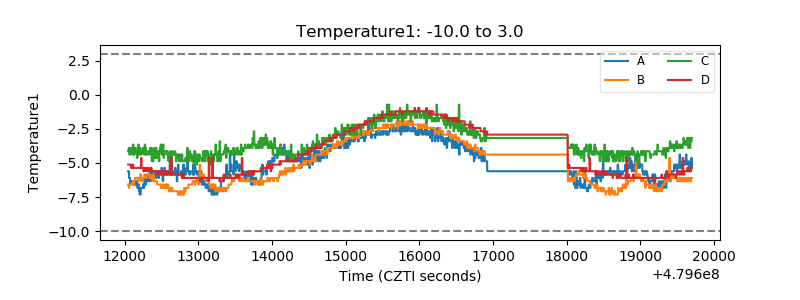 |
| Veto HV Monitor | 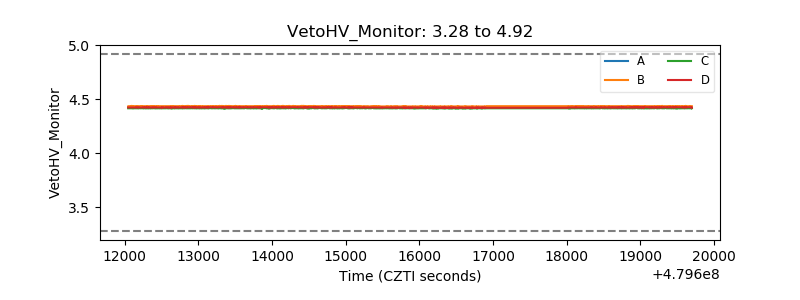 |
| Veto LLD | 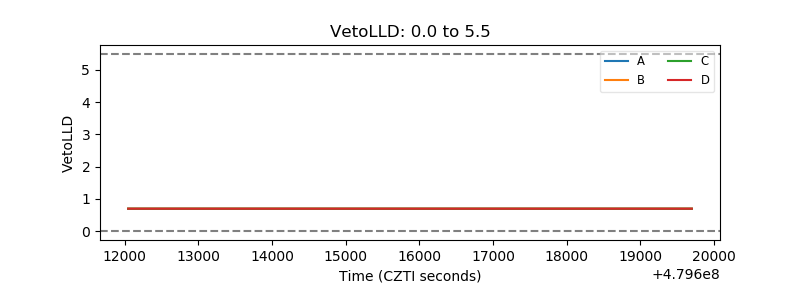 |
| Alpha Counter | 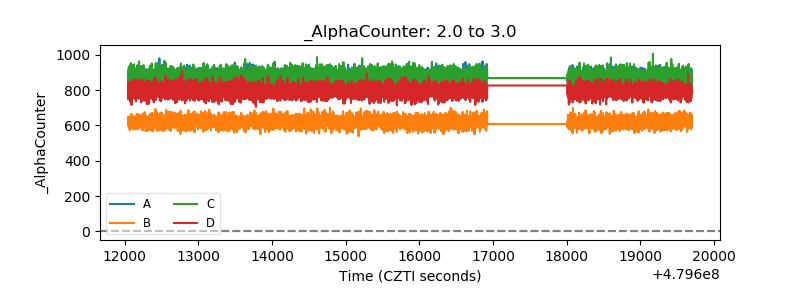 |
| _CPM_Rate | 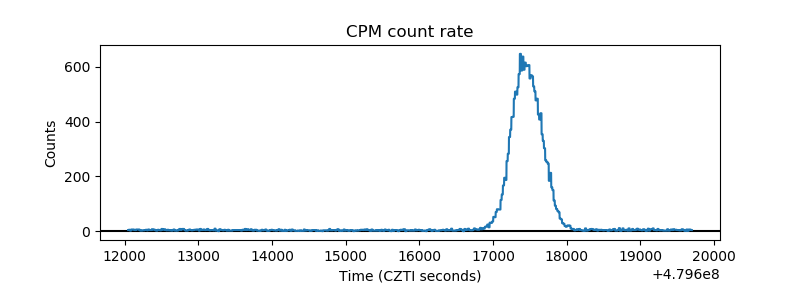 |
| CZT Counter | 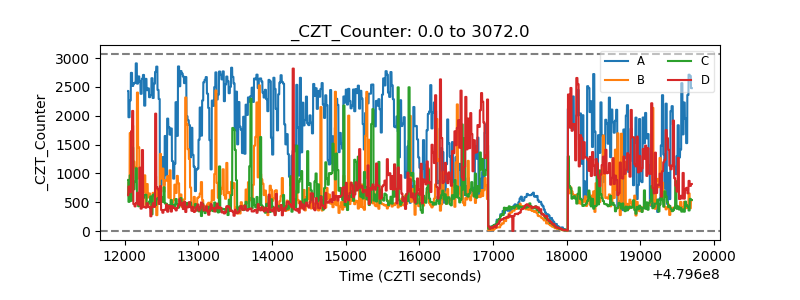 |
| +2.5 Volts monitor | 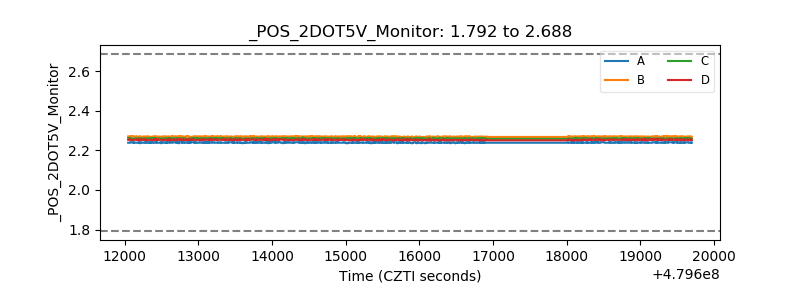 |
| +5 Volts monitor | 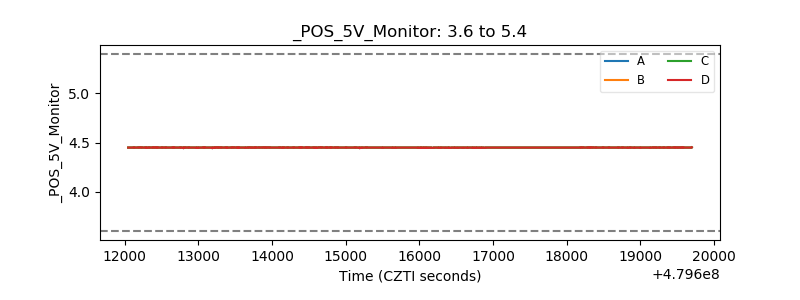 |
| _ROLL_ROT | 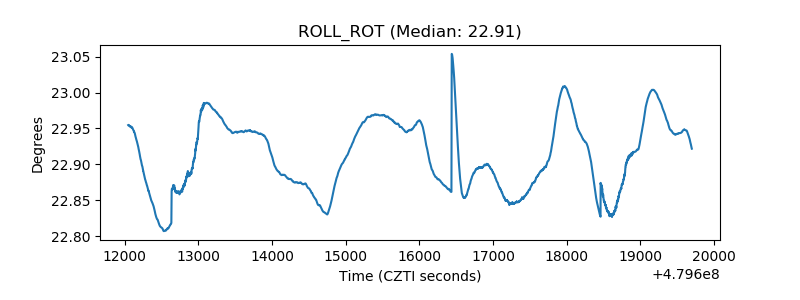 |
| _Roll_DEC | 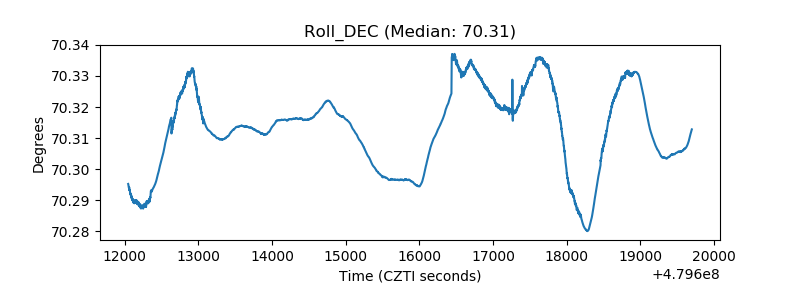 |
| _Roll_RA | 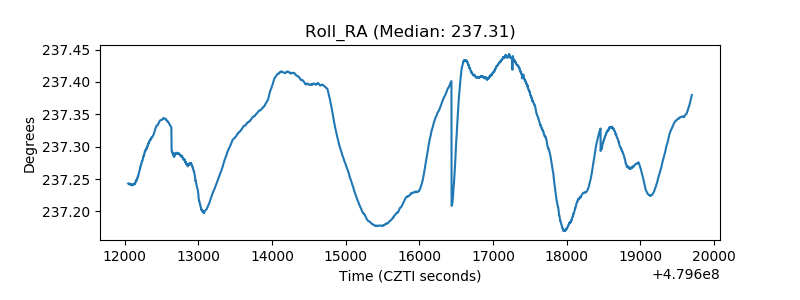 |
| Veto Counter | 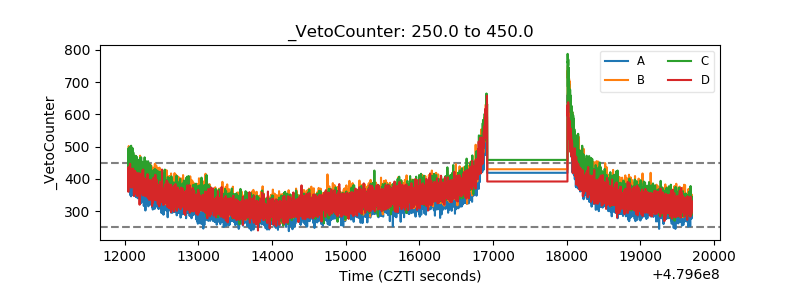 |