| Param | Original file | Final file |
|---|---|---|
| Filename | modeM0/AS1C07_001T01_9000006454_51162cztM0_level2.fits | modeM0/AS1C07_001T01_9000006454_51162cztM0_level2_quad_clean.evt |
| Size (bytes) | 36,956,160 | 4,680,000 |
| Size | 35.2 MB | 4.5 MB |
| Events in quadrant A | 347,603 | 13,394 |
| Events in quadrant B | 320,441 | 38,084 |
| Events in quadrant C | 337,243 | 32,807 |
| Events in quadrant D | 324,729 | 18,885 |
| Mode M0 | |||
|---|---|---|---|
| Quadrant | BADHDUFLAG | Total packets | Discarded packets |
| A | 0 | 12663 | 11412 |
| B | 0 | 6007 | 4704 |
| C | 0 | 6175 | 4812 |
| D | 0 | 10786 | 9574 |
| Mode SS | |||
|---|---|---|---|
| Quadrant | BADHDUFLAG | Total packets | Discarded packets |
| A | 0 | 48 | 39 |
| B | 0 | 45 | 37 |
| C | 0 | 50 | 38 |
| D | 0 | 47 | 33 |
| Mode M9 | |||
|---|---|---|---|
| Quadrant | BADHDUFLAG | Total packets | Discarded packets |
| A | 0 | 15 | 9 |
| B | 0 | 11 | 7 |
| C | 0 | 10 | 4 |
| D | 0 | 12 | 7 |
| Quadrant | Total seconds | Saturated seconds | Saturation percentage |
|---|---|---|---|
| A | 320 | 53 | 16.562500% |
| B | 539 | 7 | 1.298701% |
| C | 530 | 9 | 1.698113% |
| D | 362 | 12 | 3.314917% |
Noise dominated data is calculated using 1-second bins in cleaned event files. If a bin has >2000 counts, and if more than 50% of those come from <1% of pixels, then it is considered to be noise-dominated and hence unusable.
| Quadrant | # 1 sec bins | Bins with >0 counts | Bins with >2000 counts | High rate bins dominated by noise | Noise dominated (total time) | Noise dominated (detector-on time) | Marked lightcurve |
|---|---|---|---|---|---|---|---|
| A | 2943 | 482 | 44 | 44 | 1.50% | 9.13% | 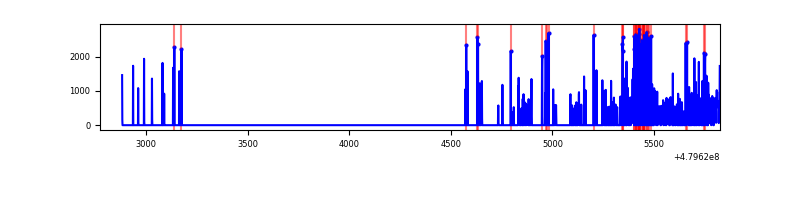 |
| B | 3052 | 803 | 0 | 0 | 0.00% | 0.00% | 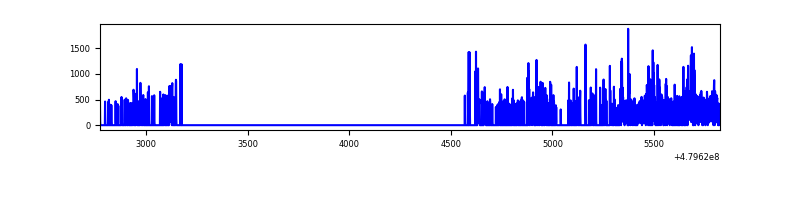 |
| C | 3015 | 812 | 3 | 3 | 0.10% | 0.37% | 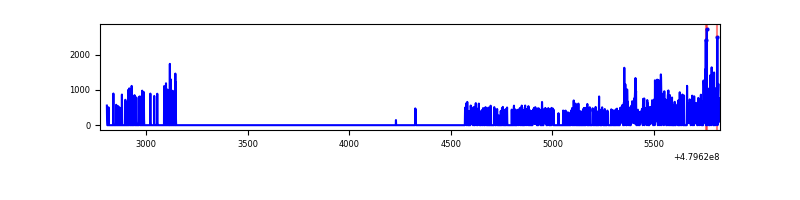 |
| D | 3011 | 556 | 6 | 6 | 0.20% | 1.08% | 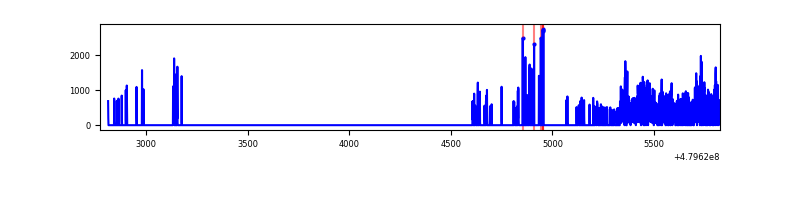 |
Top three noisy pixels from each quadrant. If the there are fewer than three noisy pixels in the level2.evt file, extra rows are filled as -1
| Pixel properties | Quadrant properties | ||||||
|---|---|---|---|---|---|---|---|
| Quadrant | DetID | PixID | Counts | Sigma | Mean | Median | Sigma |
| A | 14 | 254 | 153416 | 17199.96 | 29 | 28 | 8.9 |
| A | 12 | 3 | 55665 | 6238.78 | 29 | 28 | 8.9 |
| A | 12 | 194 | 6848 | 764.75 | 29 | 28 | 8.9 |
| B | 10 | 60 | 44659 | 3170.49 | 55 | 53 | 14.1 |
| B | 8 | 128 | 31563 | 2239.66 | 55 | 53 | 14.1 |
| B | 0 | 171 | 10551 | 746.17 | 55 | 53 | 14.1 |
| C | 10 | 171 | 37271 | 2381.77 | 50 | 49 | 15.6 |
| C | 12 | 247 | 32122 | 2052.29 | 50 | 49 | 15.6 |
| C | 6 | 13 | 26242 | 1676.04 | 50 | 49 | 15.6 |
| D | 8 | 176 | 144707 | 12843.76 | 33 | 31 | 11.3 |
| D | 2 | 62 | 30616 | 2715.21 | 33 | 31 | 11.3 |
| D | 2 | 216 | 9387 | 830.59 | 33 | 31 | 11.3 |
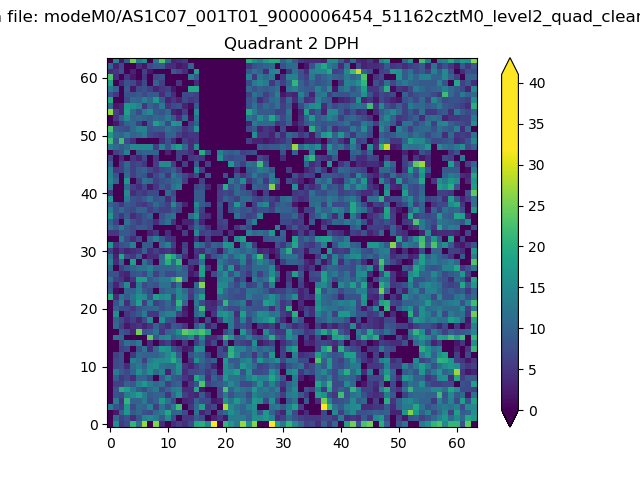
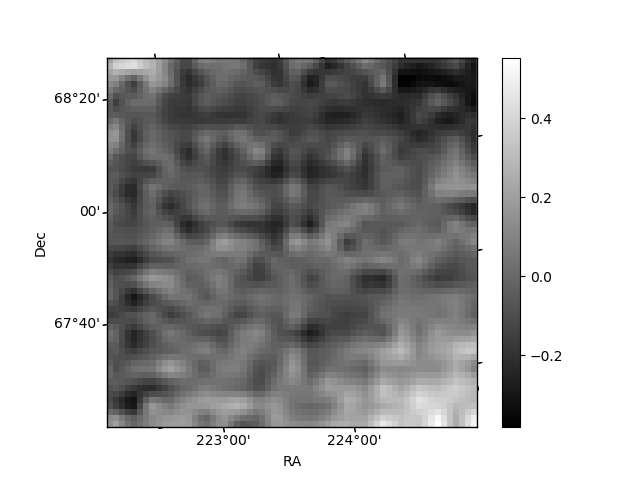
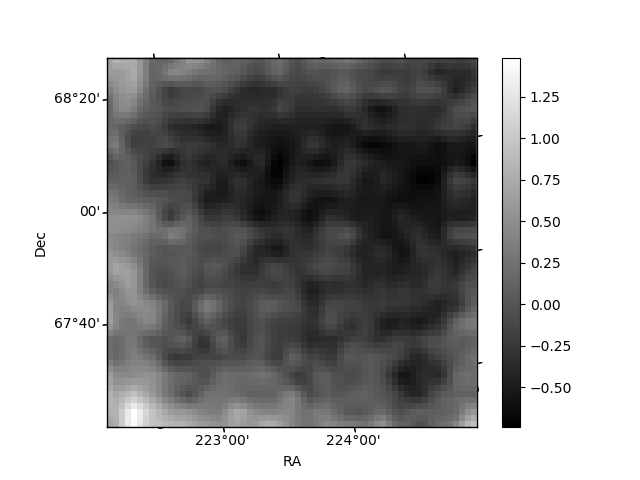
Histogram calculated using DETX and DETY for each event in the final _common_clean file
| Quadrant A | 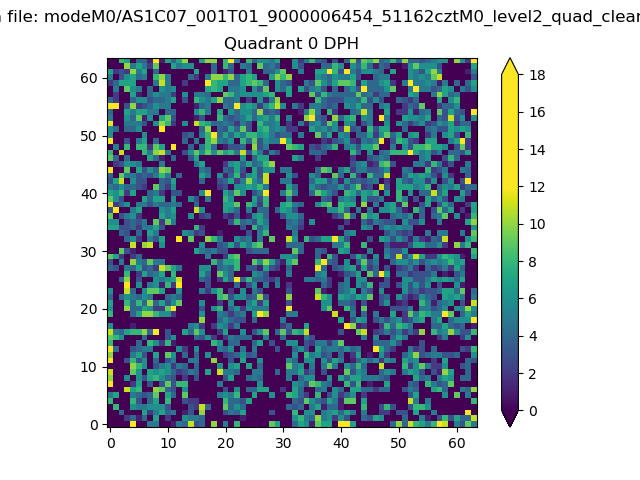 |
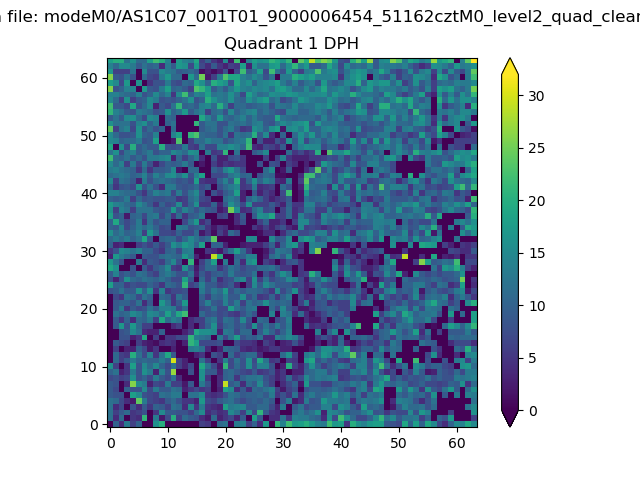 |
Quadrant B |
|---|---|---|---|
| Quadrant D | 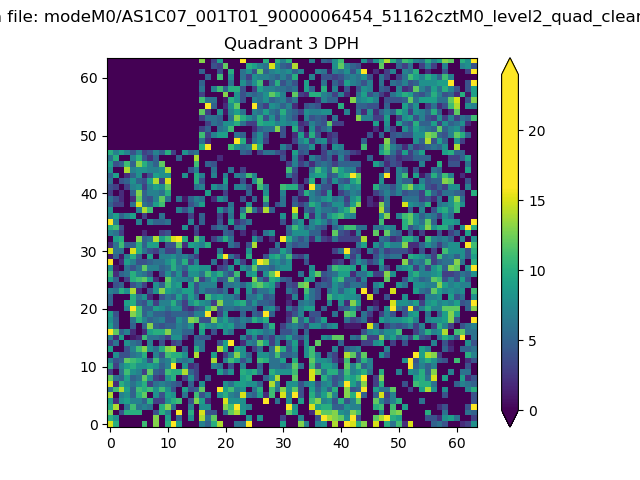 |
 |
Quadrant C |
| Plot type | Count rate plots | Images |
|---|---|---|
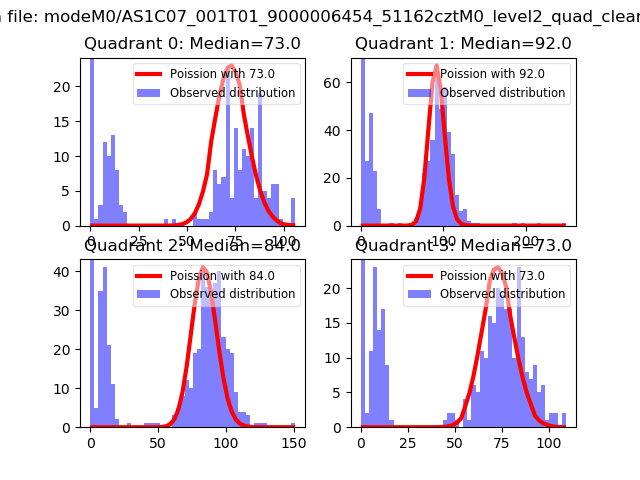
| Comparison with Poisson distribution Blue bars denote a histogram of data divided into 1 sec bins. Red curve is a Poisson curve with rate = median count rate of data. |
 |
 |
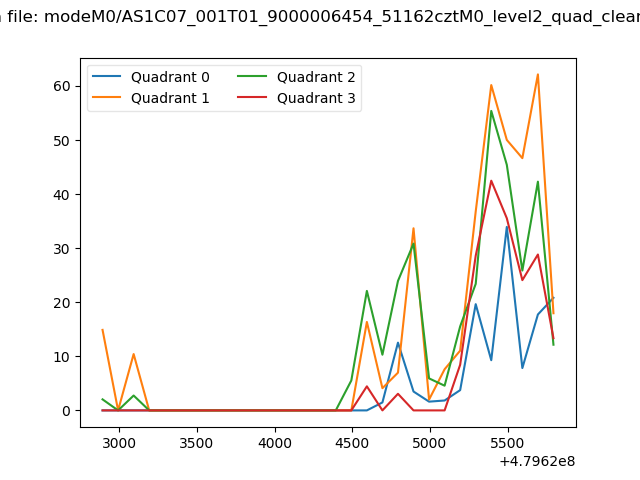
| Quadrant-wise count rates Data is divided into 100 sec bins |
 |
|
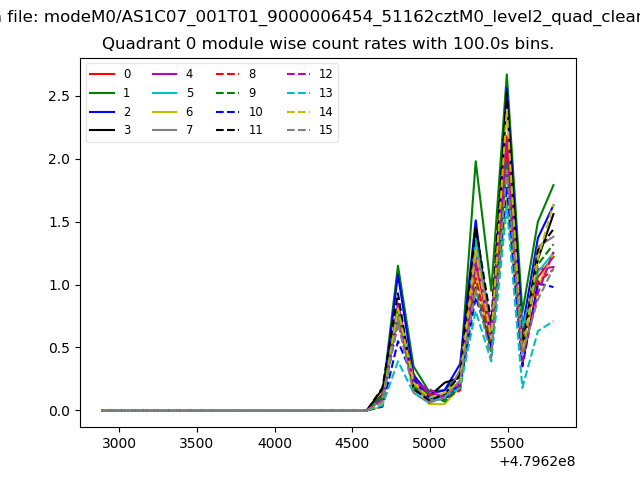
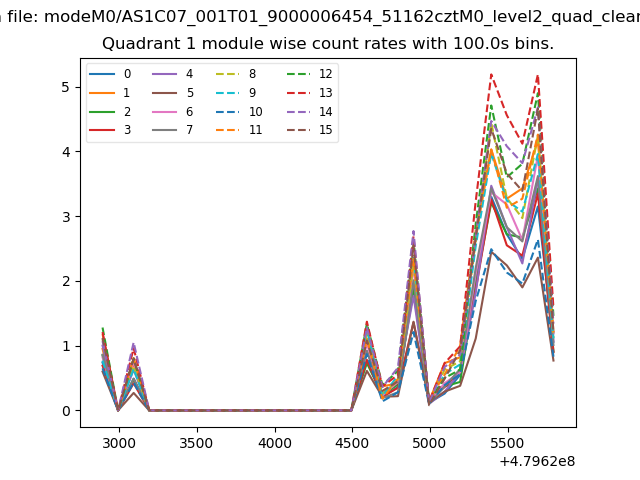
| Module-wise count rates for Quadrant A Data is divided into 100 sec bins |
 |
 |
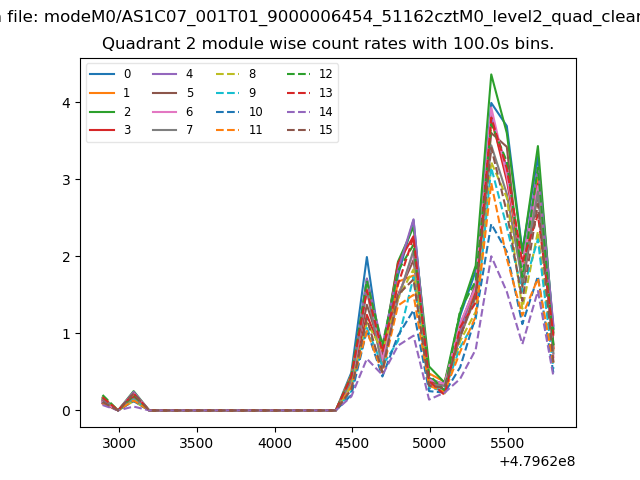
| Module-wise count rates for Quadrant B Data is divided into 100 sec bins |
 |
 |
| Module-wise count rates for Quadrant C Data is divided into 100 sec bins |
 |
 |
| Module-wise count rates for Quadrant D Data is divided into 100 sec bins |
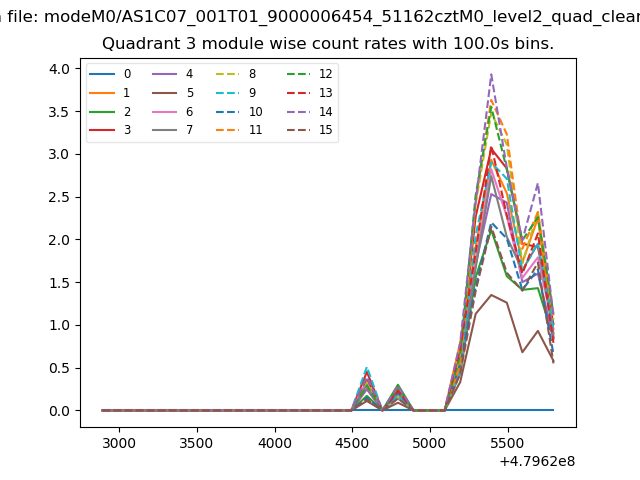 |
 |
| Parameter | Plot |
|---|---|
| CZT HV Monitor | 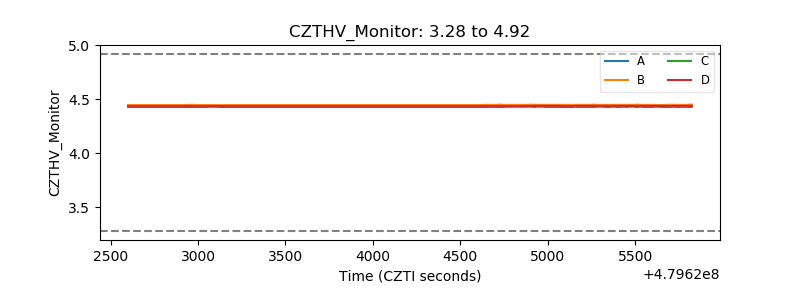 |
| D_VDD | 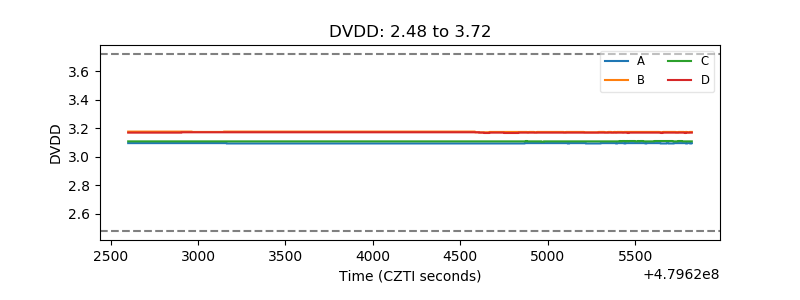 |
| Temperature 1 | 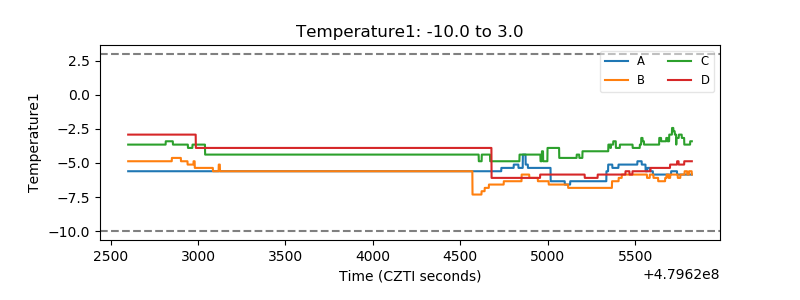 |
| Veto HV Monitor | 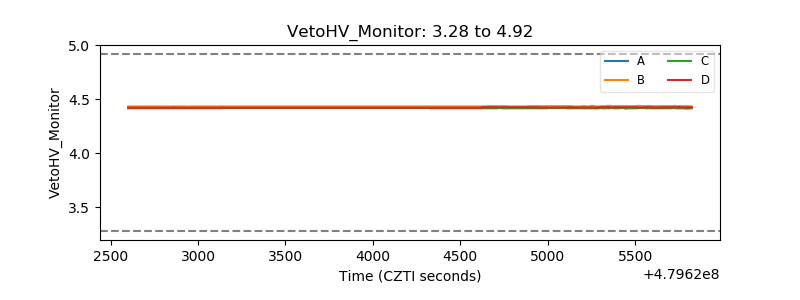 |
| Veto LLD | 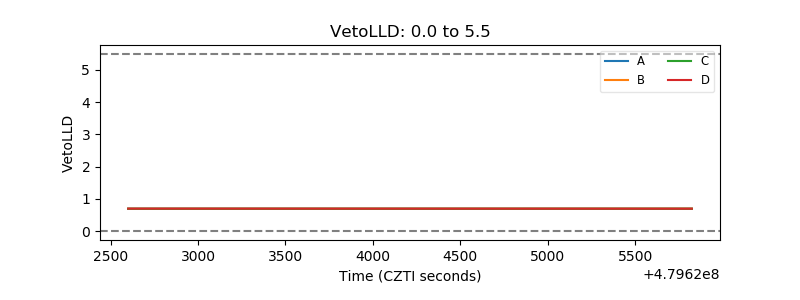 |
| Alpha Counter | 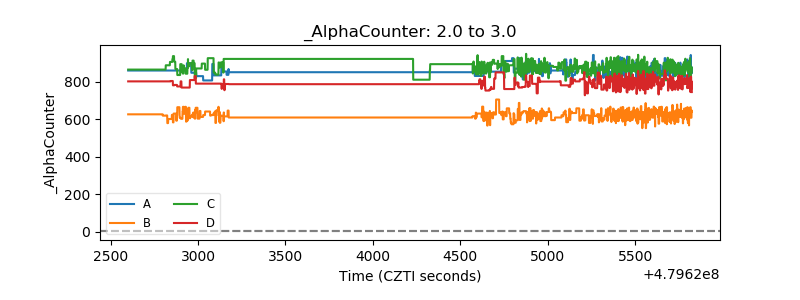 |
| _CPM_Rate | 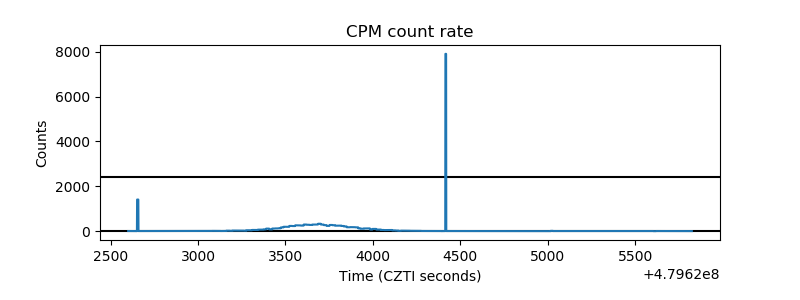 |
| CZT Counter | 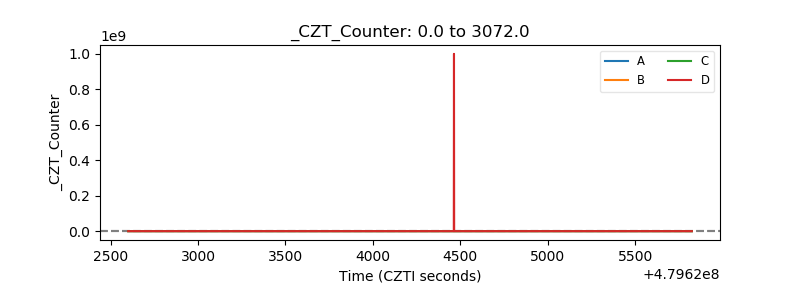 |
| +2.5 Volts monitor | 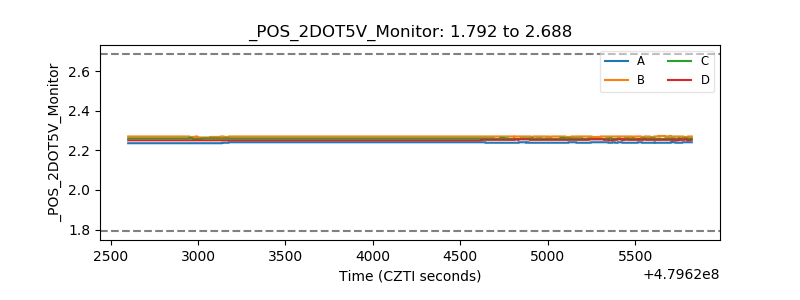 |
| +5 Volts monitor | 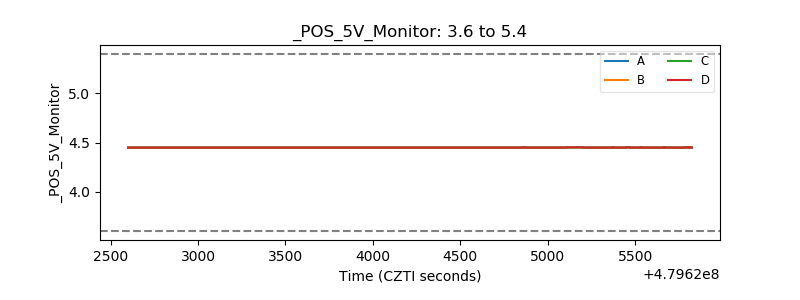 |
| _ROLL_ROT | 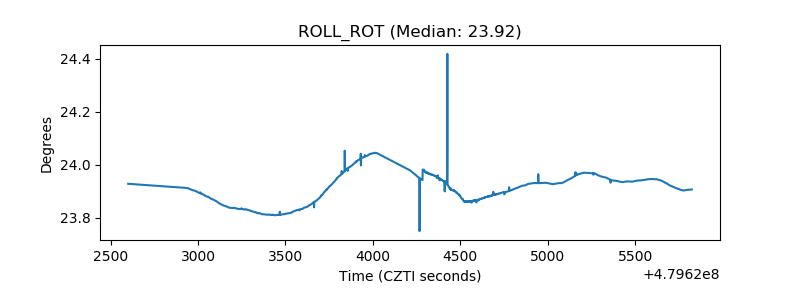 |
| _Roll_DEC | 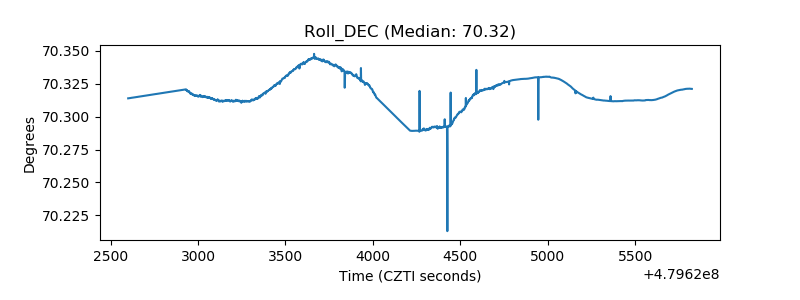 |
| _Roll_RA | 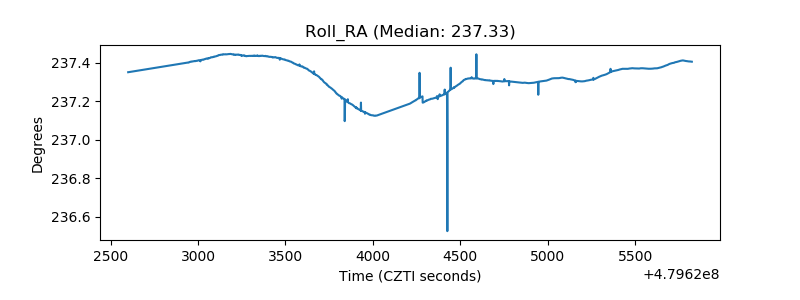 |
| Veto Counter | 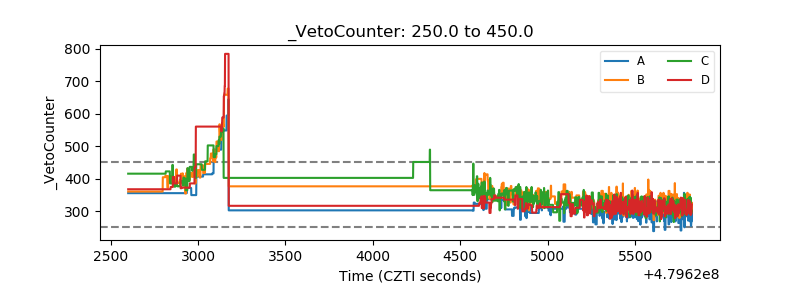 |