| Param | Original file | Final file |
|---|---|---|
| Filename | modeM0/AS1C07_001T01_9000006454_51163cztM0_level2.fits | modeM0/AS1C07_001T01_9000006454_51163cztM0_level2_quad_clean.evt |
| Size (bytes) | 625,559,040 | 79,269,120 |
| Size | 596.6 MB | 75.6 MB |
| Events in quadrant A | 5,919,721 | 498,857 |
| Events in quadrant B | 3,801,549 | 582,331 |
| Events in quadrant C | 5,382,031 | 498,914 |
| Events in quadrant D | 7,596,930 | 407,668 |
| Mode M0 | |||
|---|---|---|---|
| Quadrant | BADHDUFLAG | Total packets | Discarded packets |
| A | 0 | 21913 | 186 |
| B | 0 | 15709 | 155 |
| C | 0 | 20337 | 231 |
| D | 0 | 27216 | 545 |
| Mode SS | |||
|---|---|---|---|
| Quadrant | BADHDUFLAG | Total packets | Discarded packets |
| A | 0 | 122 | 0 |
| B | 0 | 122 | 0 |
| C | 0 | 122 | 0 |
| D | 0 | 121 | 1 |
| Mode M9 | |||
|---|---|---|---|
| Quadrant | BADHDUFLAG | Total packets | Discarded packets |
| A | 0 | 8 | 0 |
| B | 0 | 8 | 0 |
| C | 0 | 8 | 0 |
| D | 0 | 8 | 0 |
| Quadrant | Total seconds | Saturated seconds | Saturation percentage |
|---|---|---|---|
| A | 5903 | 735 | 12.451296% |
| B | 5911 | 261 | 4.415497% |
| C | 5886 | 509 | 8.647638% |
| D | 5867 | 1231 | 20.981762% |
Noise dominated data is calculated using 1-second bins in cleaned event files. If a bin has >2000 counts, and if more than 50% of those come from <1% of pixels, then it is considered to be noise-dominated and hence unusable.
| Quadrant | # 1 sec bins | Bins with >0 counts | Bins with >2000 counts | High rate bins dominated by noise | Noise dominated (total time) | Noise dominated (detector-on time) | Marked lightcurve |
|---|---|---|---|---|---|---|---|
| A | 6832 | 5942 | 652 | 652 | 9.54% | 10.97% | 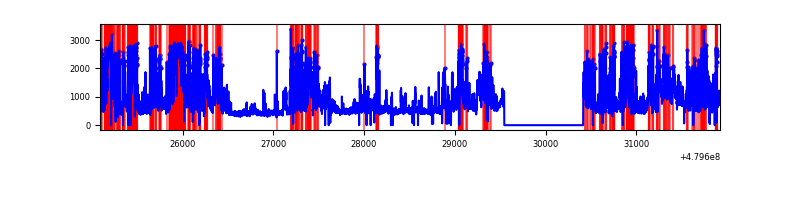 |
| B | 6833 | 5941 | 119 | 119 | 1.74% | 2.00% | 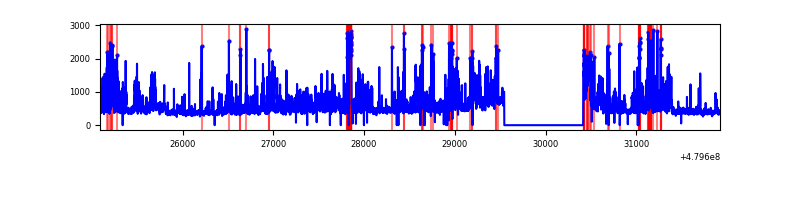 |
| C | 6833 | 5941 | 487 | 487 | 7.13% | 8.20% | 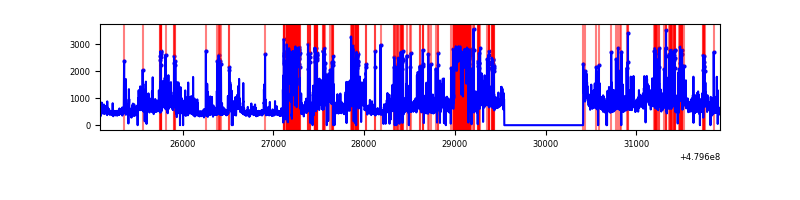 |
| D | 6833 | 5912 | 1253 | 1253 | 18.34% | 21.19% | 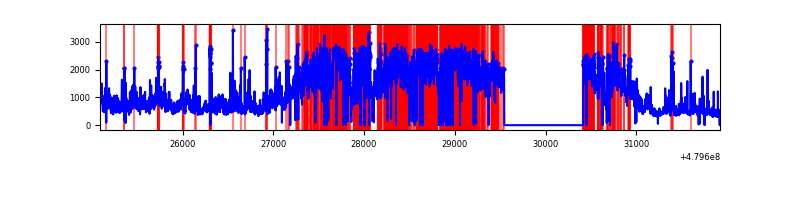 |
Top three noisy pixels from each quadrant. If the there are fewer than three noisy pixels in the level2.evt file, extra rows are filled as -1
| Pixel properties | Quadrant properties | ||||||
|---|---|---|---|---|---|---|---|
| Quadrant | DetID | PixID | Counts | Sigma | Mean | Median | Sigma |
| A | 14 | 254 | 1797195 | 12456.88 | 583 | 570 | 144.2 |
| A | 12 | 3 | 824485 | 5712.61 | 583 | 570 | 144.2 |
| A | 4 | 4 | 250761 | 1734.7 | 583 | 570 | 144.2 |
| B | 5 | 185 | 333680 | 2579.41 | 601 | 580 | 129.1 |
| B | 4 | 171 | 310174 | 2397.39 | 601 | 580 | 129.1 |
| B | 10 | 60 | 192447 | 1485.75 | 601 | 580 | 129.1 |
| C | 4 | 12 | 658194 | 4246.36 | 565 | 560 | 154.9 |
| C | 12 | 247 | 510737 | 3294.23 | 565 | 560 | 154.9 |
| C | 1 | 60 | 368870 | 2378.19 | 565 | 560 | 154.9 |
| D | 8 | 176 | 4170980 | 27244.71 | 539 | 518 | 153.1 |
| D | 12 | 2 | 604595 | 3946.3 | 539 | 518 | 153.1 |
| D | 2 | 216 | 260780 | 1700.23 | 539 | 518 | 153.1 |
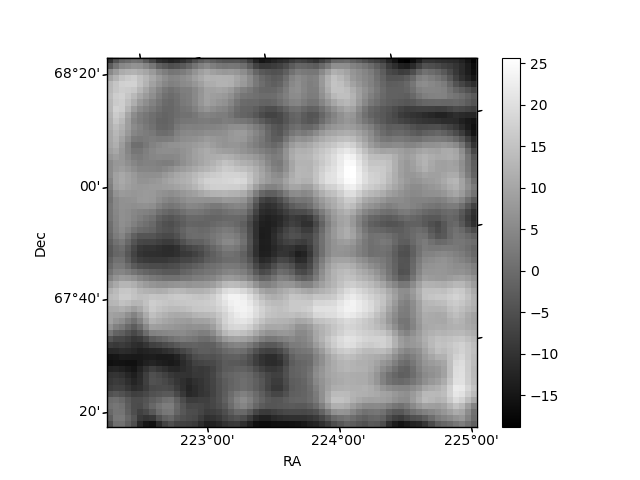
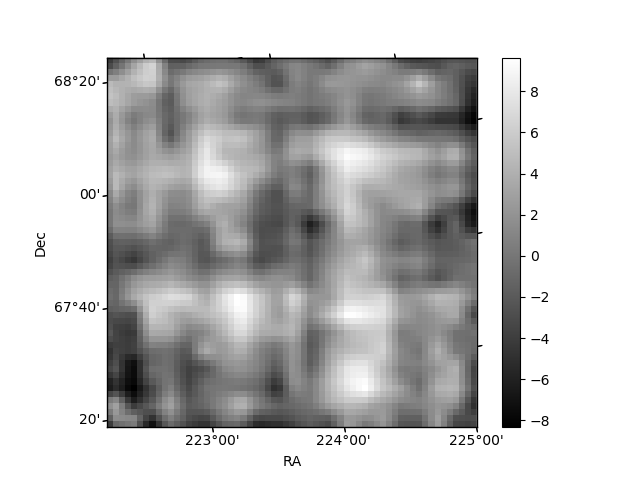
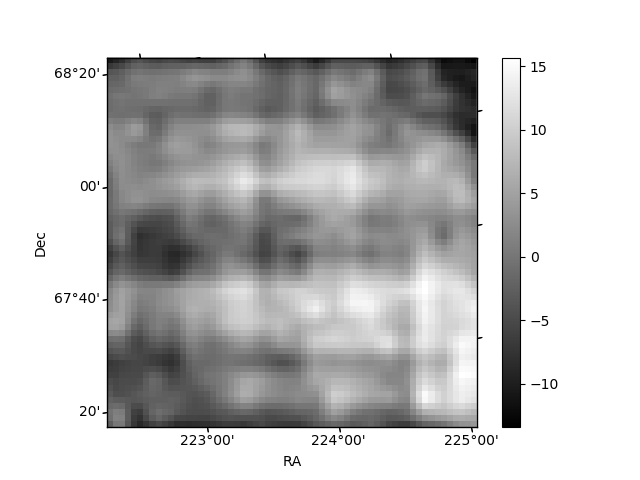
Histogram calculated using DETX and DETY for each event in the final _common_clean file
| Quadrant A | 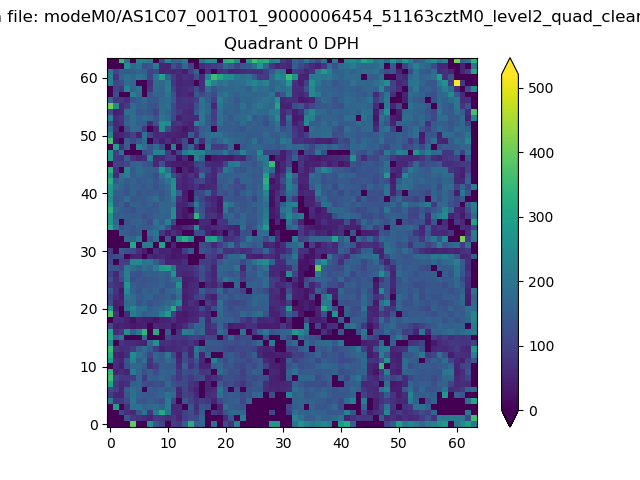 |
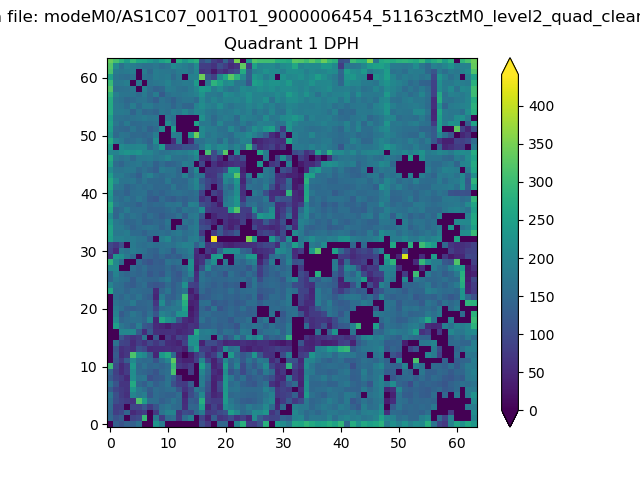 |
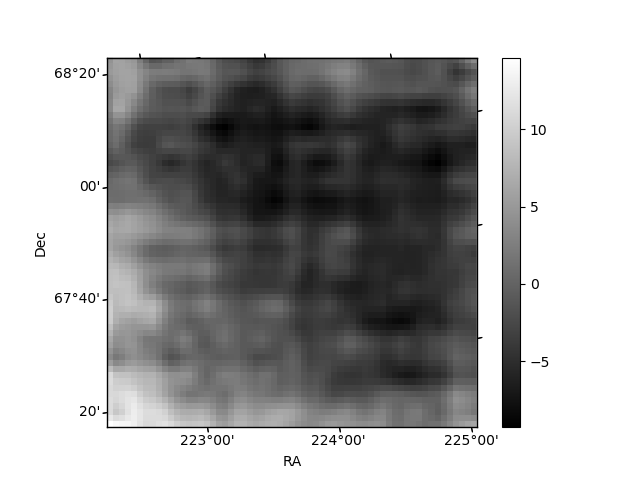
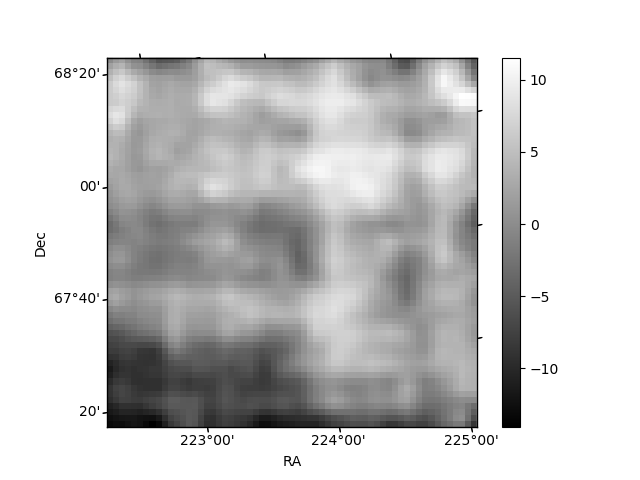
Quadrant B |
|---|---|---|---|
| Quadrant D | 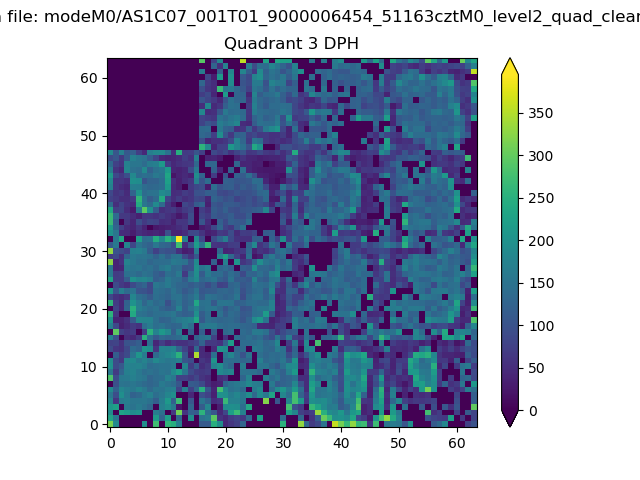 |
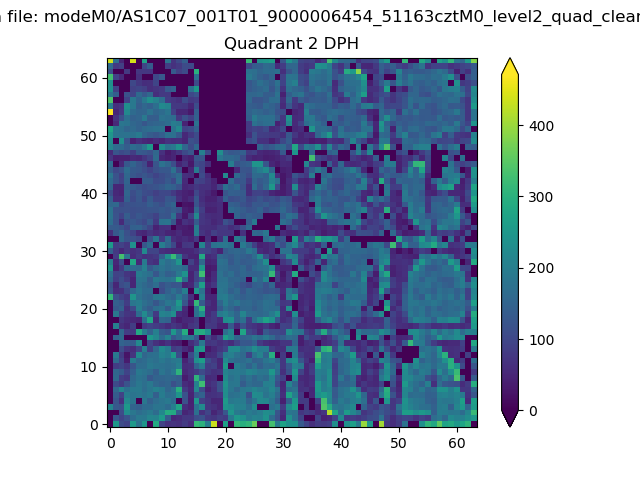 |
Quadrant C |
| Plot type | Count rate plots | Images |
|---|---|---|
| Comparison with Poisson distribution Blue bars denote a histogram of data divided into 1 sec bins. Red curve is a Poisson curve with rate = median count rate of data. |
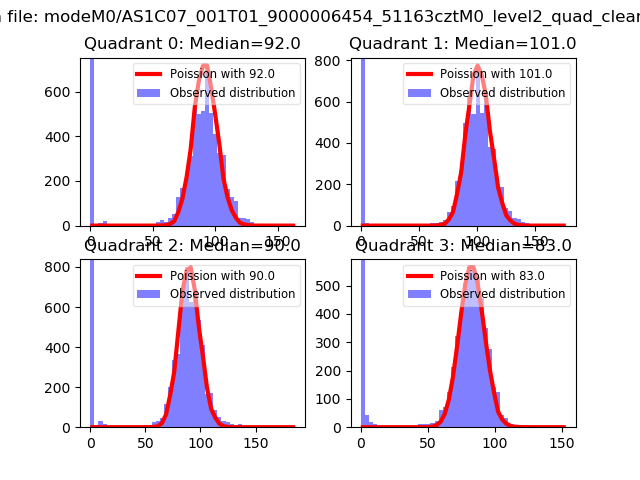 |
 |
| Quadrant-wise count rates Data is divided into 100 sec bins |
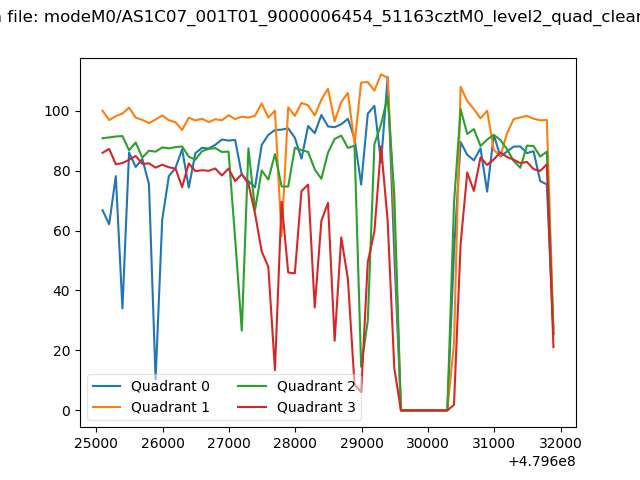 |
|
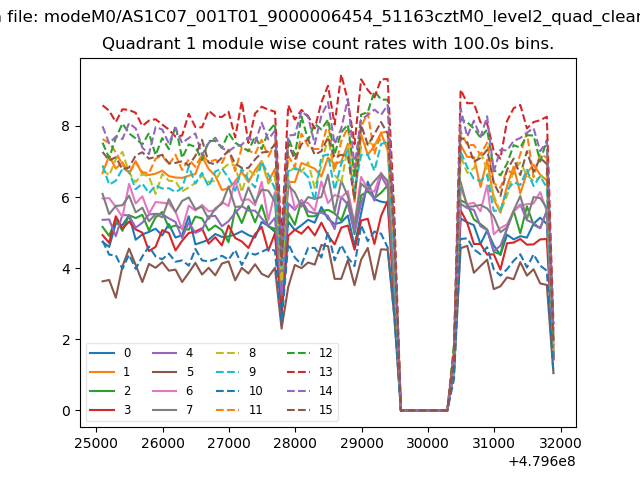
| Module-wise count rates for Quadrant A Data is divided into 100 sec bins |
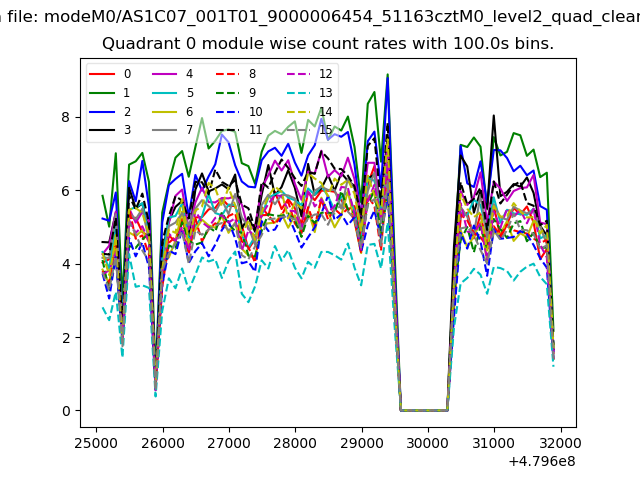 |
 |
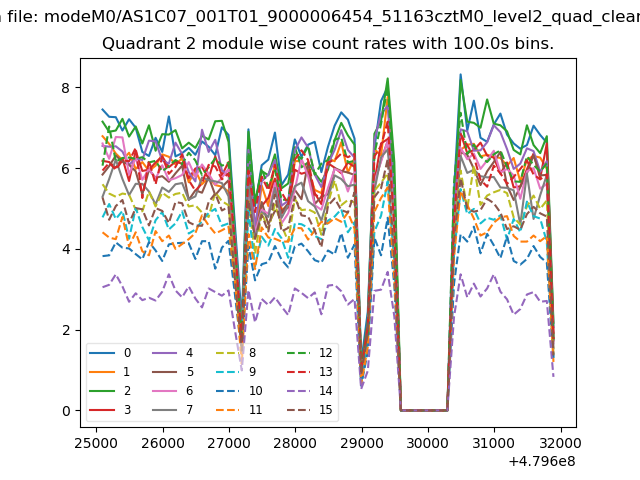
| Module-wise count rates for Quadrant B Data is divided into 100 sec bins |
 |
 |
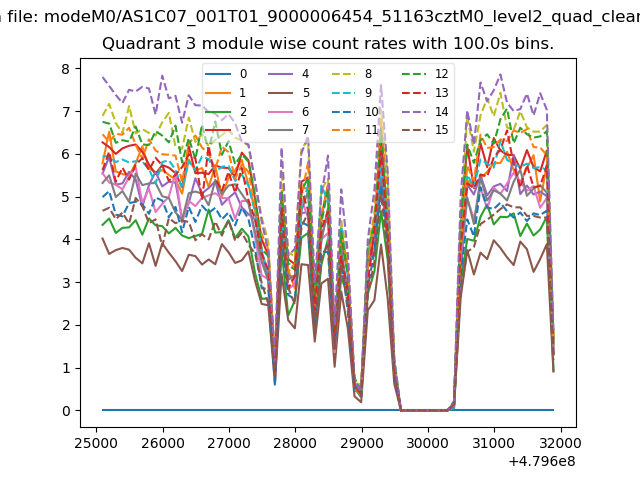
| Module-wise count rates for Quadrant C Data is divided into 100 sec bins |
 |
 |
| Module-wise count rates for Quadrant D Data is divided into 100 sec bins |
 |
 |
| Parameter | Plot |
|---|---|
| CZT HV Monitor | 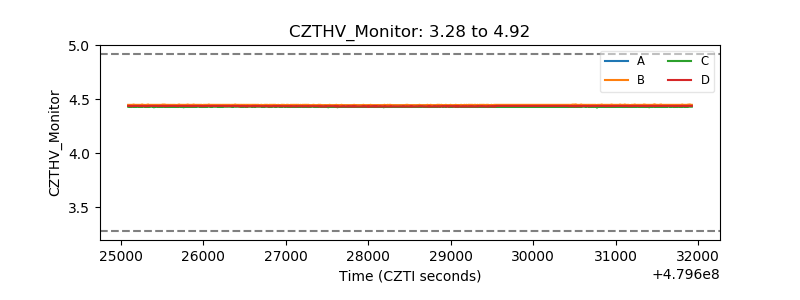 |
| D_VDD | 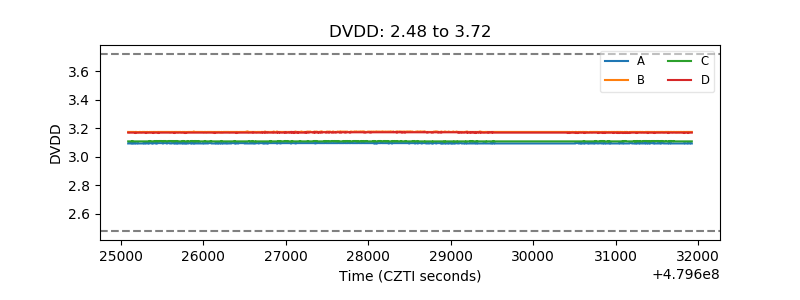 |
| Temperature 1 | 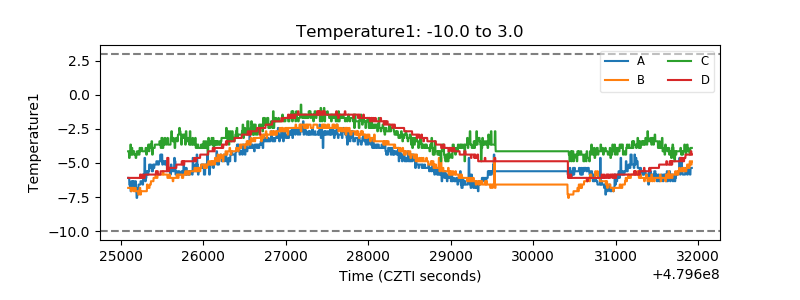 |
| Veto HV Monitor | 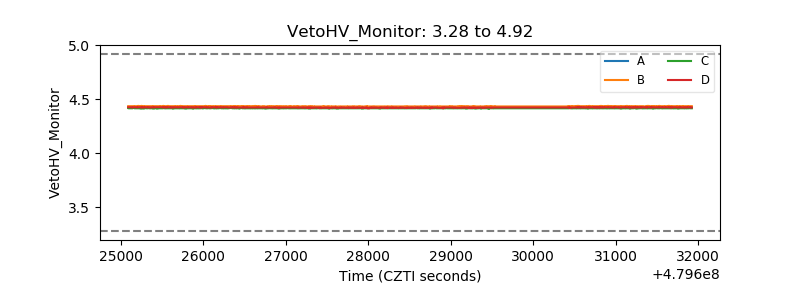 |
| Veto LLD | 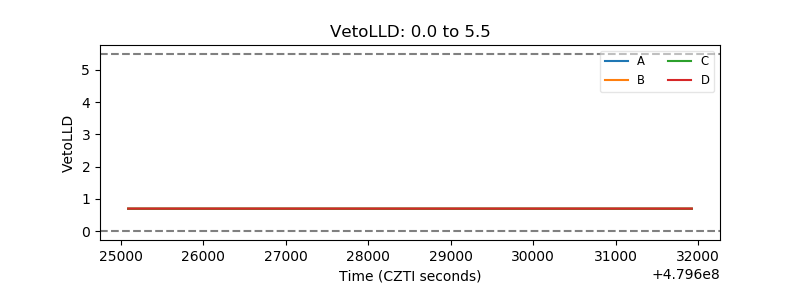 |
| Alpha Counter | 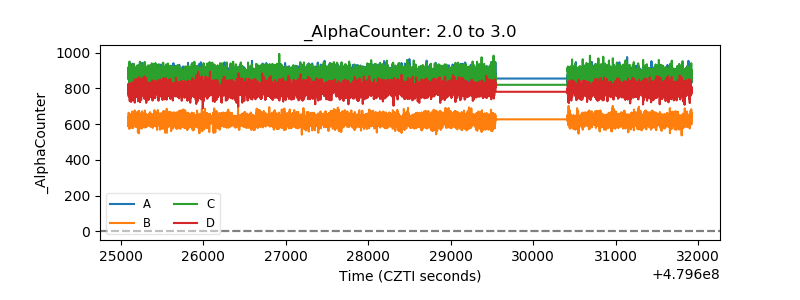 |
| _CPM_Rate | 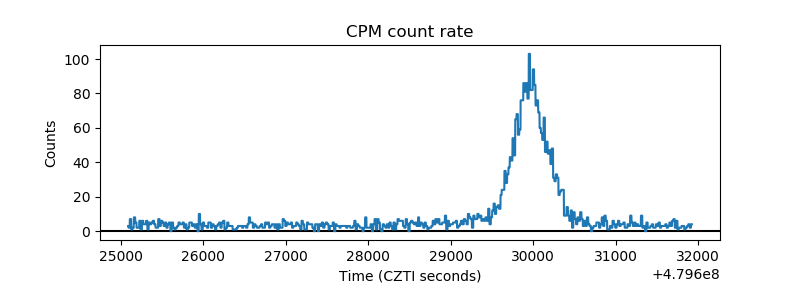 |
| CZT Counter | 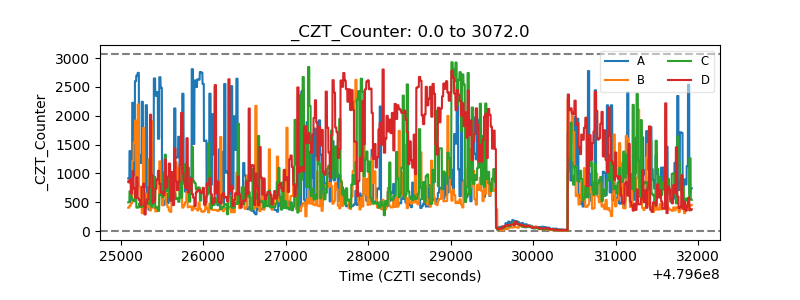 |
| +2.5 Volts monitor | 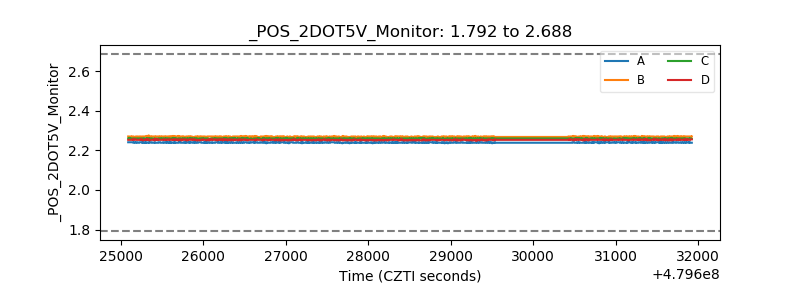 |
| +5 Volts monitor | 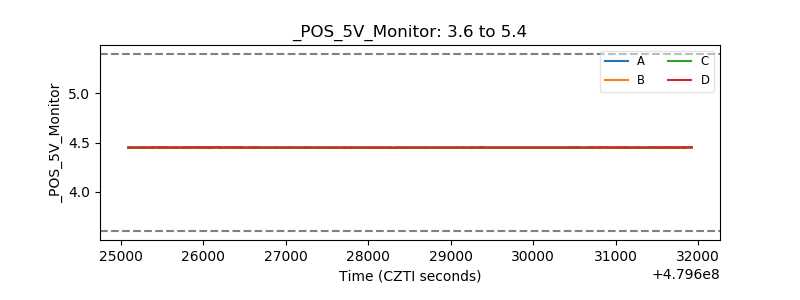 |
| _ROLL_ROT | 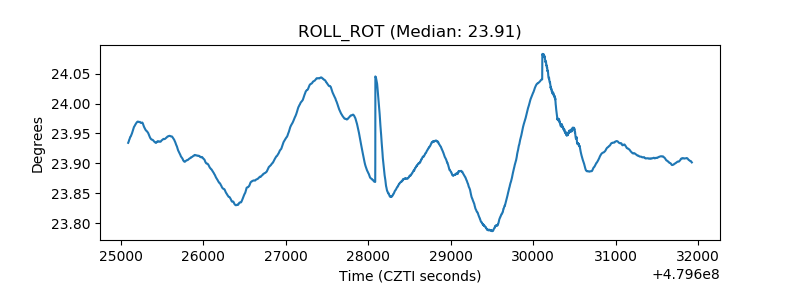 |
| _Roll_DEC | 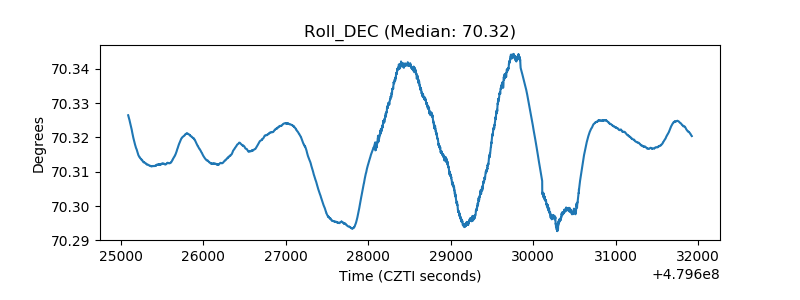 |
| _Roll_RA | 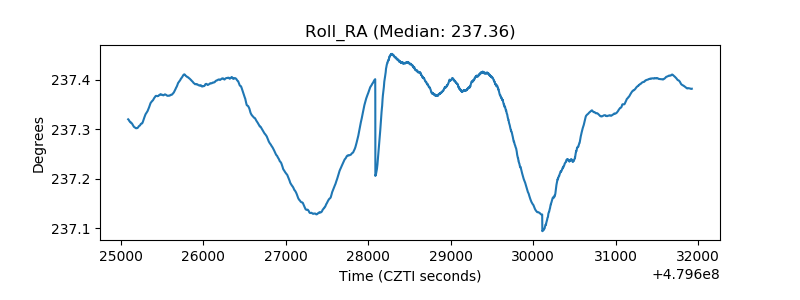 |
| Veto Counter | 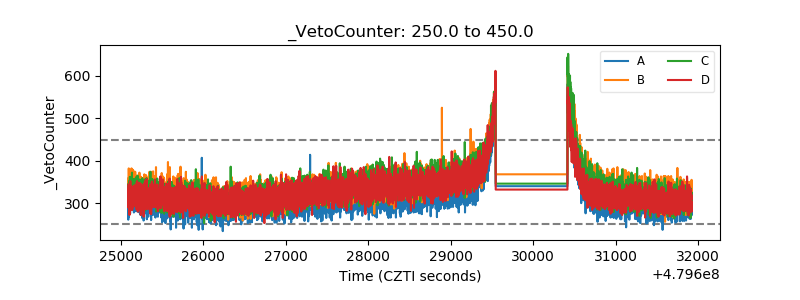 |