| Param | Original file | Final file |
|---|---|---|
| Filename | modeM0/AS1C07_001T01_9000006454_51164cztM0_level2.fits | modeM0/AS1C07_001T01_9000006454_51164cztM0_level2_quad_clean.evt |
| Size (bytes) | 890,968,320 | 90,218,880 |
| Size | 849.7 MB | 86.0 MB |
| Events in quadrant A | 9,085,948 | 592,795 |
| Events in quadrant B | 4,881,085 | 677,937 |
| Events in quadrant C | 8,101,721 | 553,608 |
| Events in quadrant D | 10,364,428 | 412,684 |
| Mode M0 | |||
|---|---|---|---|
| Quadrant | BADHDUFLAG | Total packets | Discarded packets |
| A | 0 | 32028 | 1 |
| B | 0 | 19550 | 1 |
| C | 0 | 29098 | 3 |
| D | 0 | 35793 | 1 |
| Mode SS | |||
|---|---|---|---|
| Quadrant | BADHDUFLAG | Total packets | Discarded packets |
| A | 0 | 144 | 0 |
| B | 0 | 144 | 0 |
| C | 0 | 144 | 0 |
| D | 0 | 144 | 0 |
| Mode M9 | |||
|---|---|---|---|
| Quadrant | BADHDUFLAG | Total packets | Discarded packets |
| A | 0 | 3 | 0 |
| B | 0 | 3 | 0 |
| C | 0 | 3 | 0 |
| D | 0 | 3 | 0 |
| Quadrant | Total seconds | Saturated seconds | Saturation percentage |
|---|---|---|---|
| A | 7097 | 1223 | 17.232634% |
| B | 7097 | 630 | 8.876990% |
| C | 7097 | 1370 | 19.303931% |
| D | 7097 | 2446 | 34.465267% |
Noise dominated data is calculated using 1-second bins in cleaned event files. If a bin has >2000 counts, and if more than 50% of those come from <1% of pixels, then it is considered to be noise-dominated and hence unusable.
| Quadrant | # 1 sec bins | Bins with >0 counts | Bins with >2000 counts | High rate bins dominated by noise | Noise dominated (total time) | Noise dominated (detector-on time) | Marked lightcurve |
|---|---|---|---|---|---|---|---|
| A | 7397 | 7097 | 1015 | 1015 | 13.72% | 14.30% | 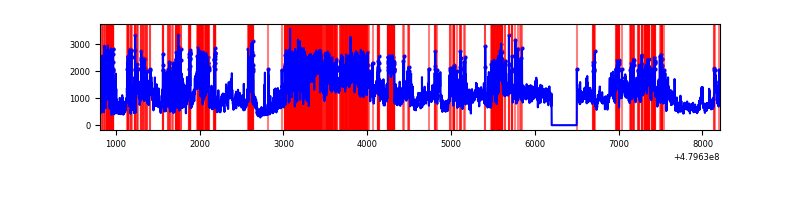 |
| B | 7397 | 7097 | 353 | 353 | 4.77% | 4.97% | 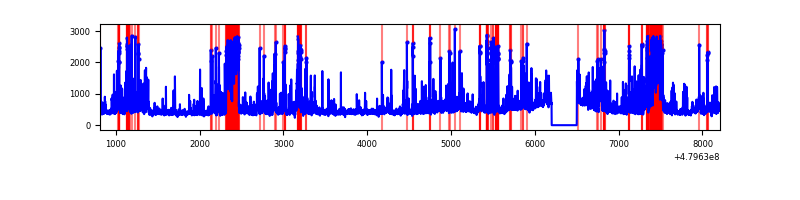 |
| C | 7397 | 7097 | 1092 | 1092 | 14.76% | 15.39% | 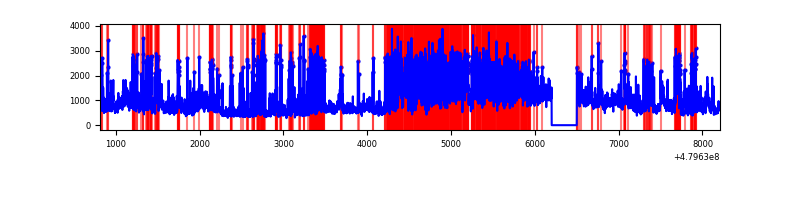 |
| D | 7397 | 7097 | 2502 | 2502 | 33.82% | 35.25% | 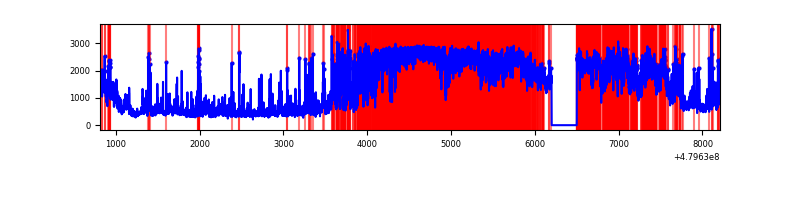 |
Top three noisy pixels from each quadrant. If the there are fewer than three noisy pixels in the level2.evt file, extra rows are filled as -1
| Pixel properties | Quadrant properties | ||||||
|---|---|---|---|---|---|---|---|
| Quadrant | DetID | PixID | Counts | Sigma | Mean | Median | Sigma |
| A | 4 | 4 | 2481339 | 13824.27 | 718 | 701 | 179.4 |
| A | 12 | 3 | 1468028 | 8177.22 | 718 | 701 | 179.4 |
| A | 14 | 254 | 973089 | 5418.99 | 718 | 701 | 179.4 |
| B | 5 | 185 | 591809 | 3756.07 | 727 | 700 | 157.4 |
| B | 10 | 60 | 515293 | 3269.87 | 727 | 700 | 157.4 |
| B | 8 | 128 | 199153 | 1261.03 | 727 | 700 | 157.4 |
| C | 4 | 12 | 2415084 | 13205.86 | 663 | 655 | 182.8 |
| C | 12 | 247 | 1542399 | 8432.66 | 663 | 655 | 182.8 |
| C | 13 | 3 | 317923 | 1735.31 | 663 | 655 | 182.8 |
| D | 8 | 176 | 6547872 | 36949.5 | 622 | 598 | 177.2 |
| D | 12 | 2 | 663566 | 3741.46 | 622 | 598 | 177.2 |
| D | 2 | 216 | 188276 | 1059.16 | 622 | 598 | 177.2 |
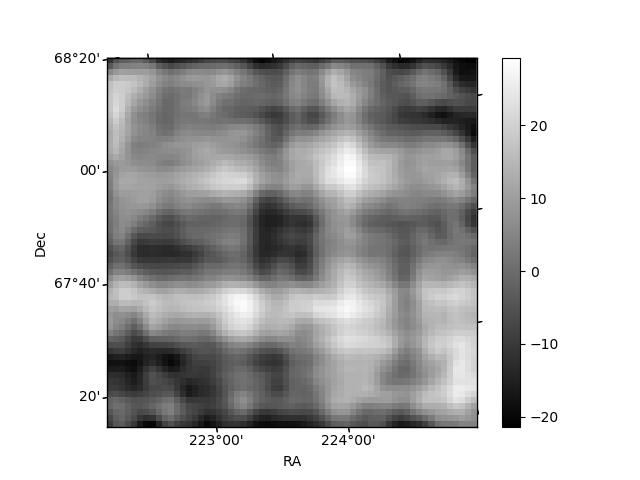
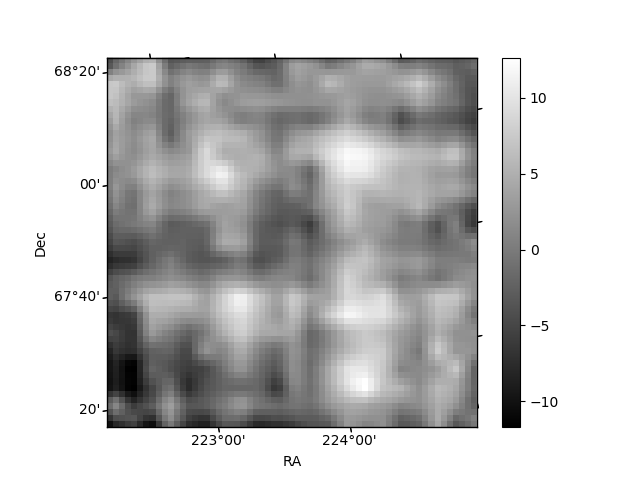
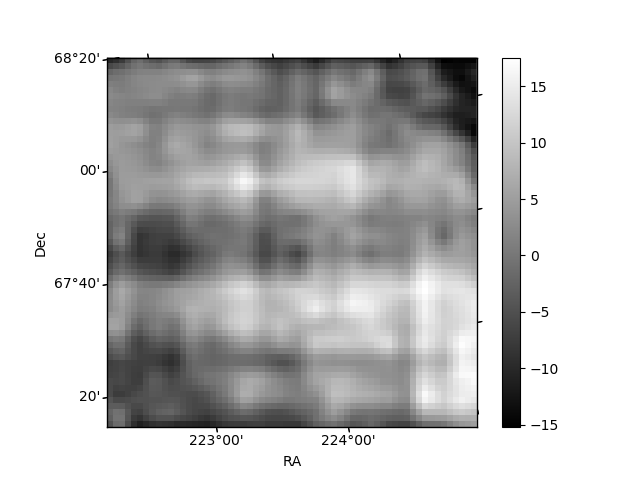
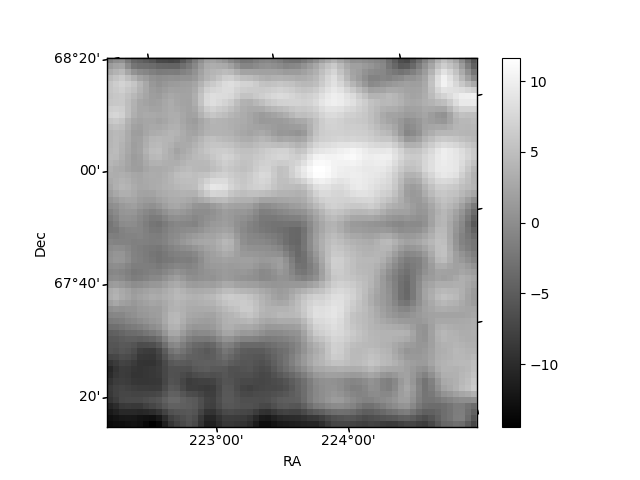
Histogram calculated using DETX and DETY for each event in the final _common_clean file
| Quadrant A | 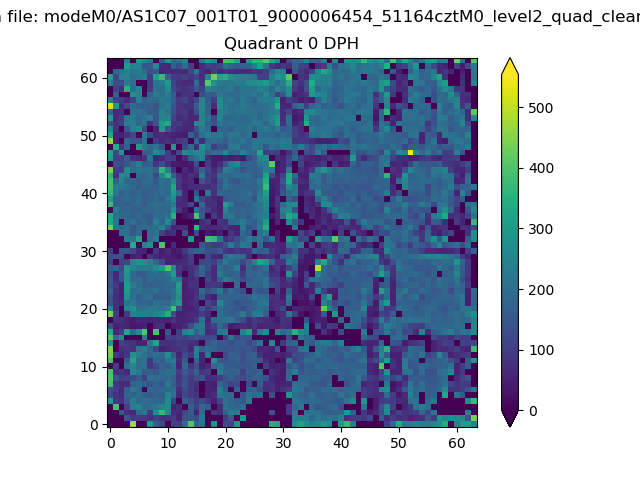 |
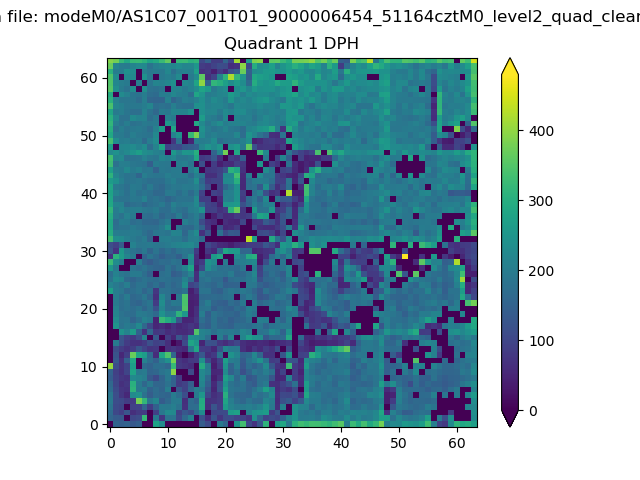 |
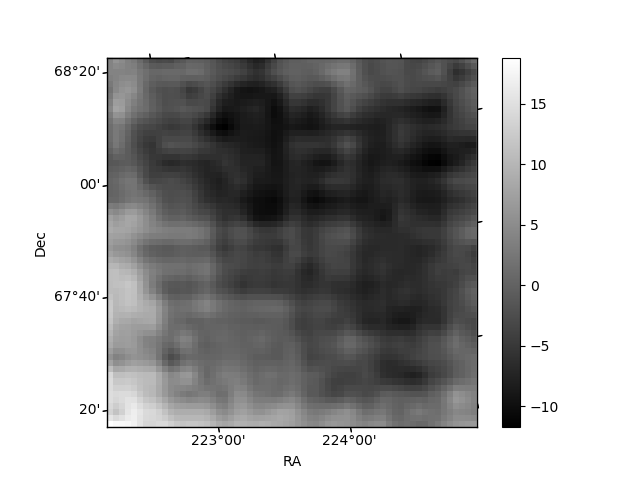
Quadrant B |
|---|---|---|---|
| Quadrant D | 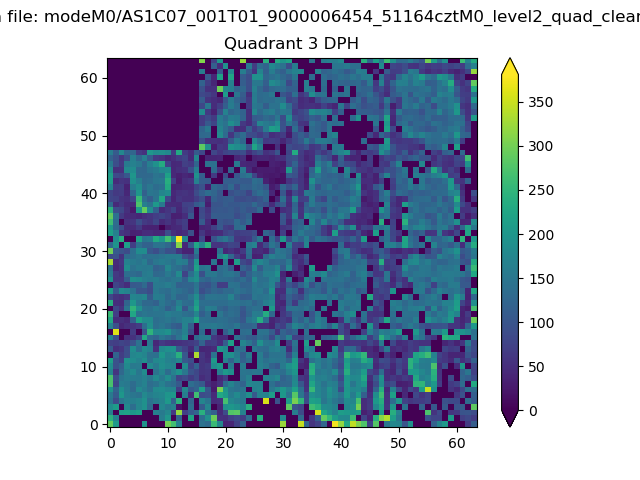 |
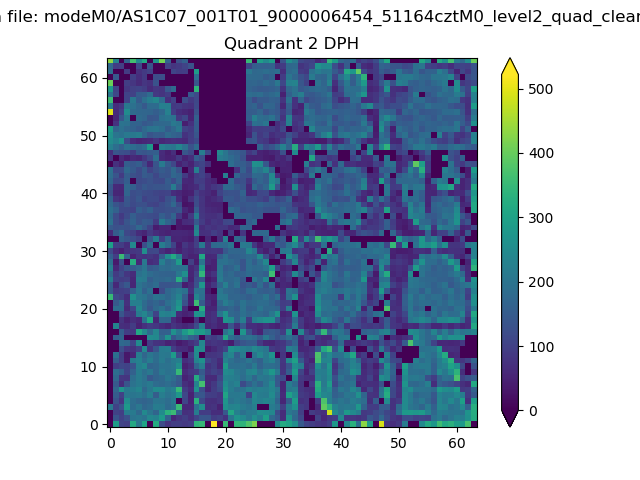 |
Quadrant C |
| Plot type | Count rate plots | Images |
|---|---|---|
| Comparison with Poisson distribution Blue bars denote a histogram of data divided into 1 sec bins. Red curve is a Poisson curve with rate = median count rate of data. |
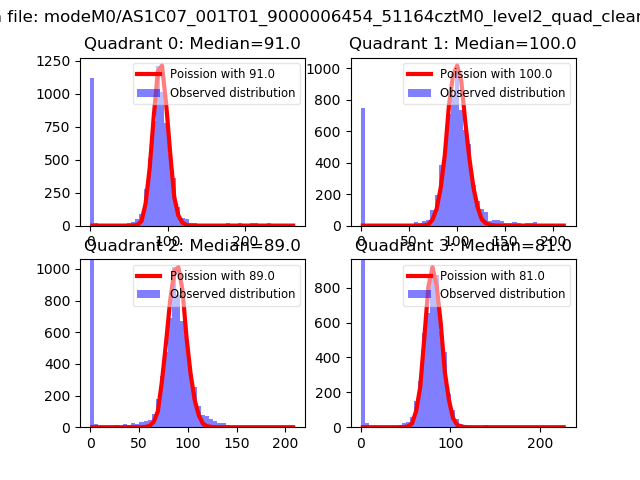 |
 |
| Quadrant-wise count rates Data is divided into 100 sec bins |
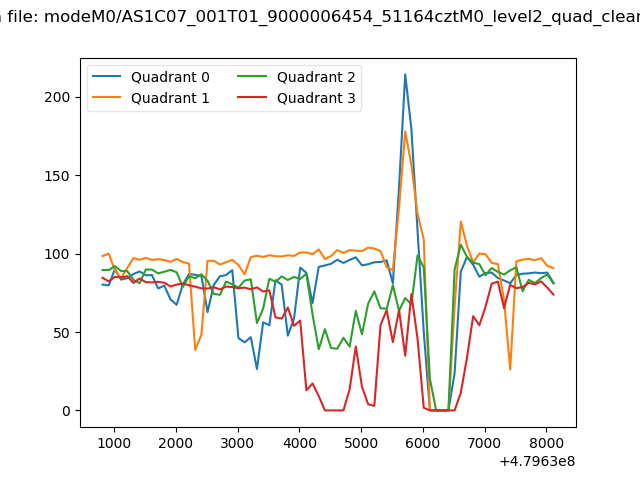 |
|
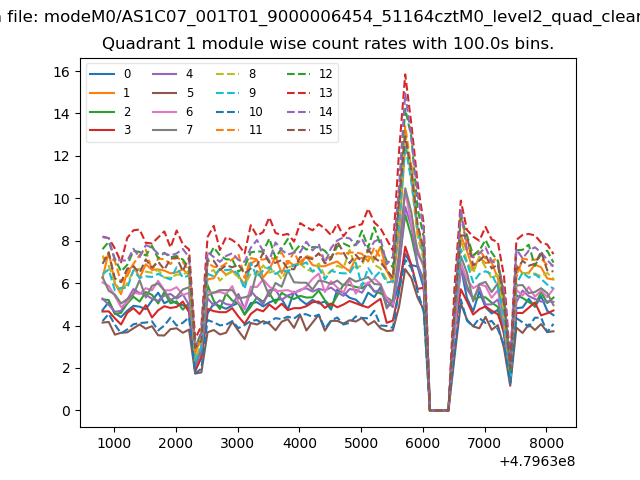
| Module-wise count rates for Quadrant A Data is divided into 100 sec bins |
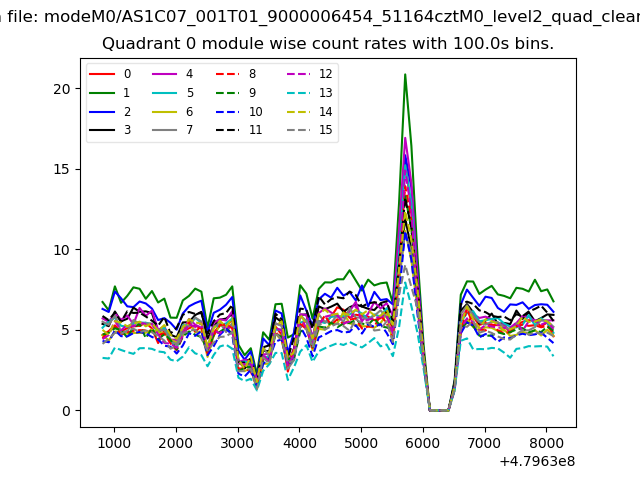 |
 |
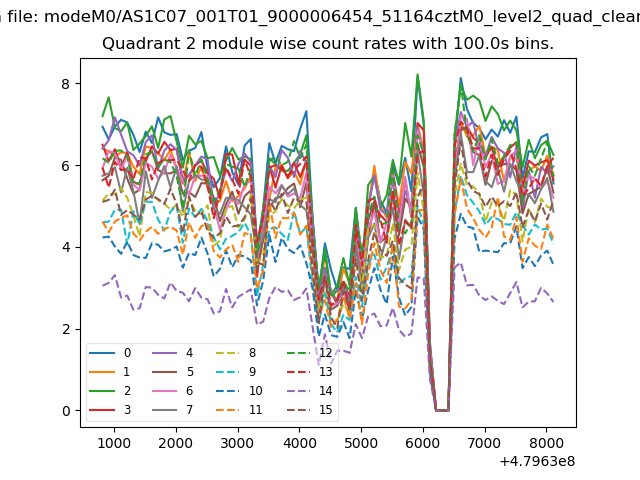
| Module-wise count rates for Quadrant B Data is divided into 100 sec bins |
 |
 |
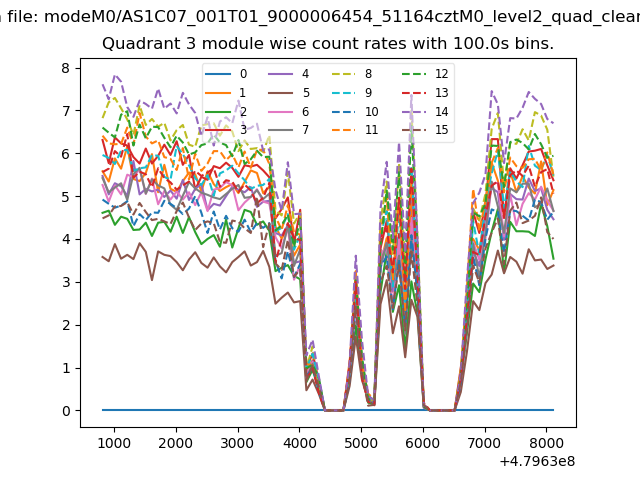
| Module-wise count rates for Quadrant C Data is divided into 100 sec bins |
 |
 |
| Module-wise count rates for Quadrant D Data is divided into 100 sec bins |
 |
 |
| Parameter | Plot |
|---|---|
| CZT HV Monitor | 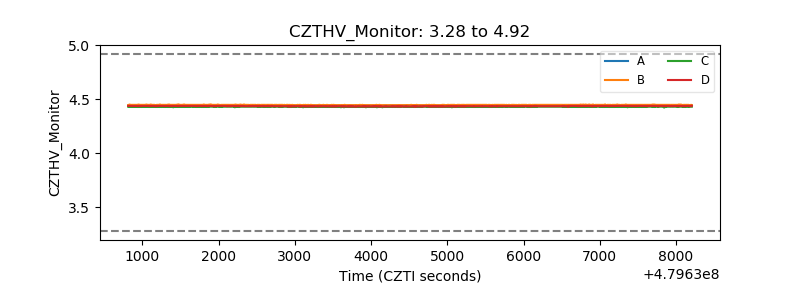 |
| D_VDD | 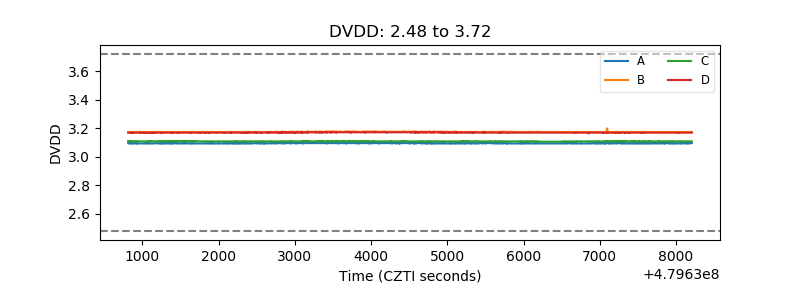 |
| Temperature 1 | 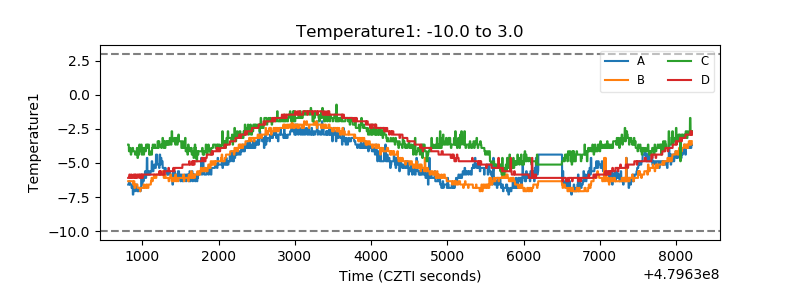 |
| Veto HV Monitor |  |
| Veto LLD | 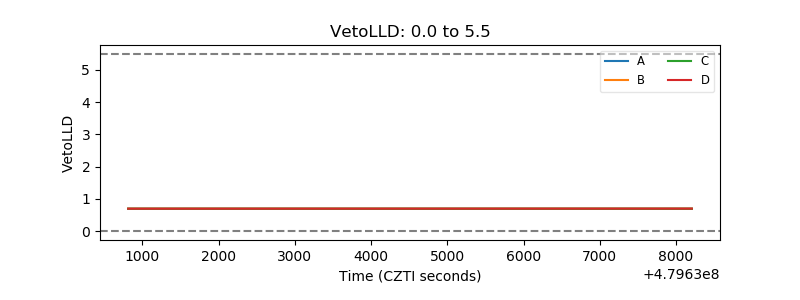 |
| Alpha Counter | 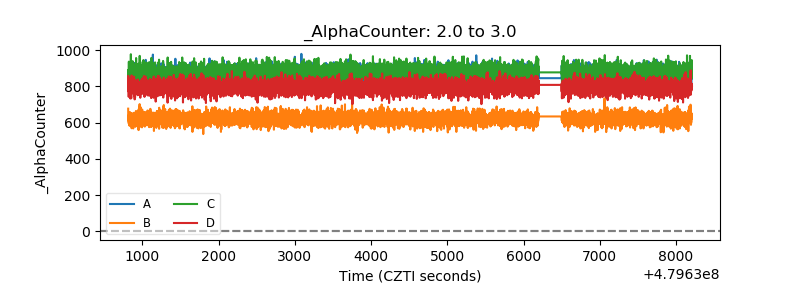 |
| _CPM_Rate | 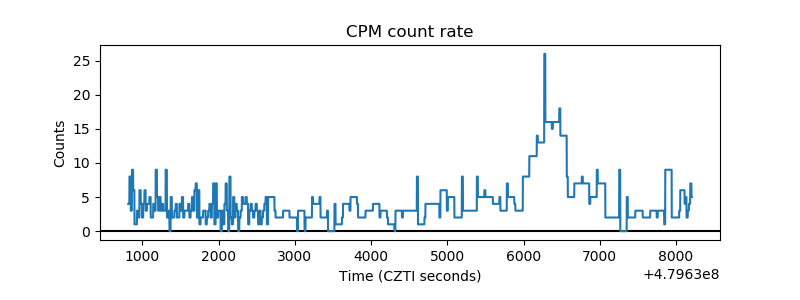 |
| CZT Counter | 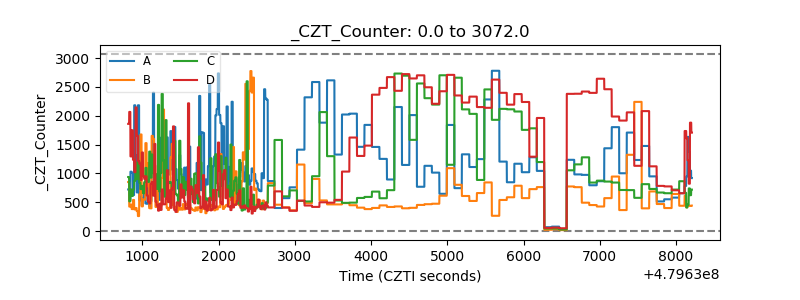 |
| +2.5 Volts monitor | 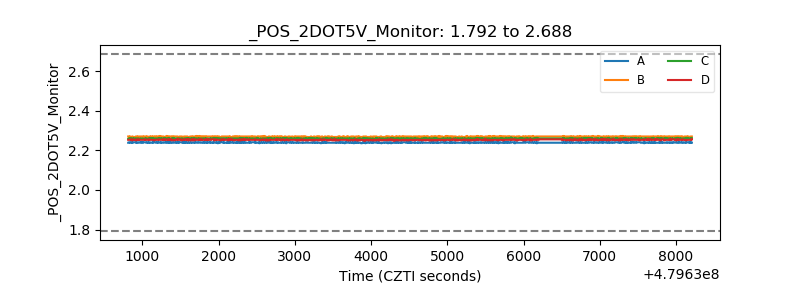 |
| +5 Volts monitor | 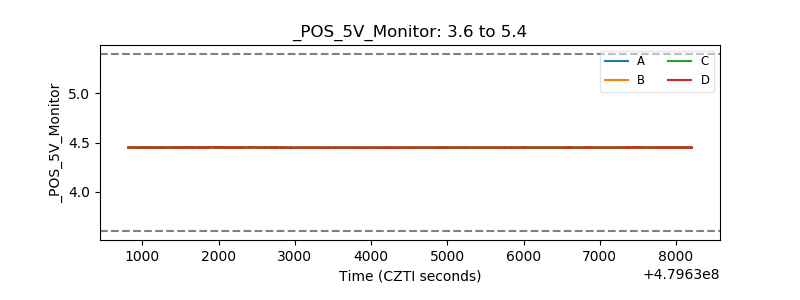 |
| _ROLL_ROT | 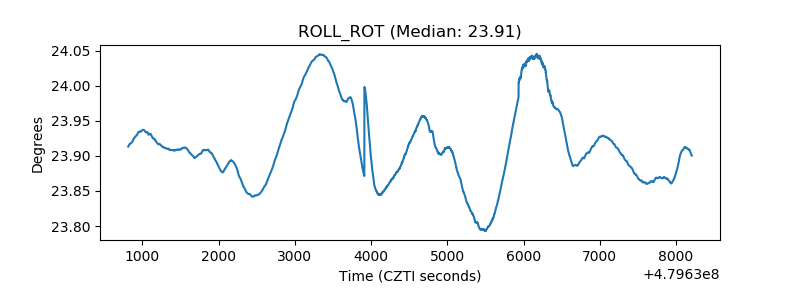 |
| _Roll_DEC | 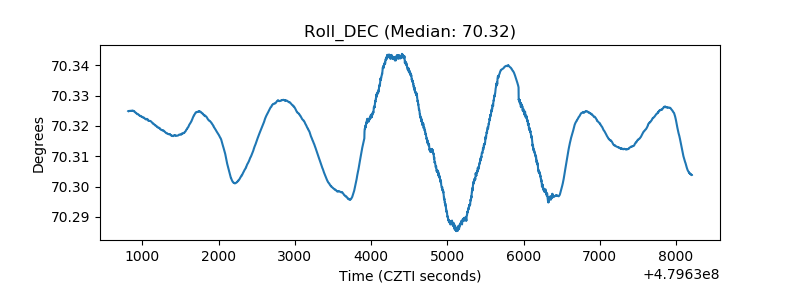 |
| _Roll_RA | 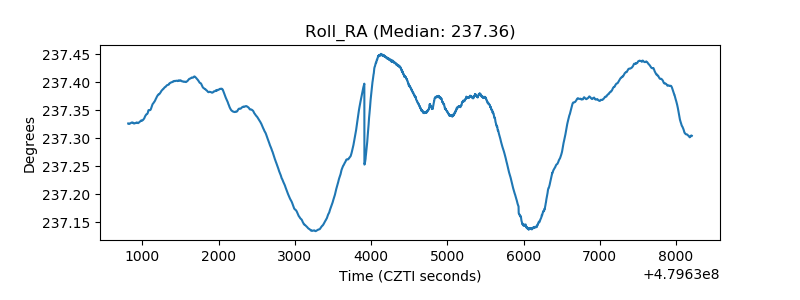 |
| Veto Counter | 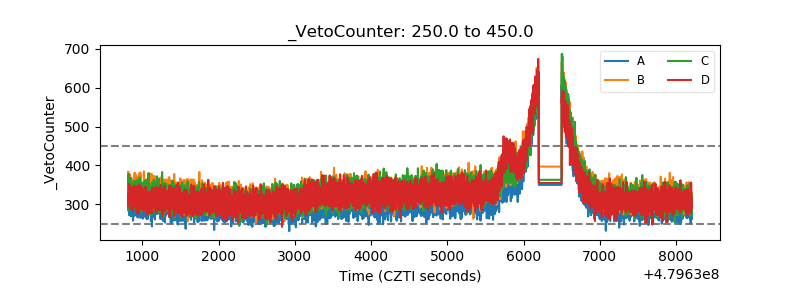 |