| Param | Original file | Final file |
|---|---|---|
| Filename | modeM0/AS1C07_001T01_9000006454_51165cztM0_level2.fits | modeM0/AS1C07_001T01_9000006454_51165cztM0_level2_quad_clean.evt |
| Size (bytes) | 1,024,848,000 | 87,030,720 |
| Size | 977.4 MB | 83.0 MB |
| Events in quadrant A | 10,868,818 | 552,946 |
| Events in quadrant B | 6,479,185 | 606,583 |
| Events in quadrant C | 6,542,924 | 609,092 |
| Events in quadrant D | 13,505,952 | 376,783 |
| Mode M0 | |||
|---|---|---|---|
| Quadrant | BADHDUFLAG | Total packets | Discarded packets |
| A | 0 | 37252 | 0 |
| B | 0 | 24105 | 0 |
| C | 0 | 24345 | 0 |
| D | 0 | 44986 | 0 |
| Mode SS | |||
|---|---|---|---|
| Quadrant | BADHDUFLAG | Total packets | Discarded packets |
| A | 0 | 140 | 0 |
| B | 0 | 140 | 0 |
| C | 0 | 140 | 0 |
| D | 0 | 140 | 0 |
| Quadrant | Total seconds | Saturated seconds | Saturation percentage |
|---|---|---|---|
| A | 7023 | 1453 | 20.689164% |
| B | 7023 | 1168 | 16.631069% |
| C | 7024 | 391 | 5.566629% |
| D | 7024 | 2975 | 42.354784% |
Noise dominated data is calculated using 1-second bins in cleaned event files. If a bin has >2000 counts, and if more than 50% of those come from <1% of pixels, then it is considered to be noise-dominated and hence unusable.
| Quadrant | # 1 sec bins | Bins with >0 counts | Bins with >2000 counts | High rate bins dominated by noise | Noise dominated (total time) | Noise dominated (detector-on time) | Marked lightcurve |
|---|---|---|---|---|---|---|---|
| A | 7023 | 7023 | 1410 | 1410 | 20.08% | 20.08% | 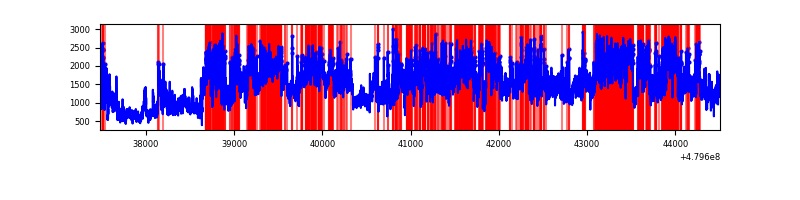 |
| B | 7023 | 7023 | 844 | 844 | 12.02% | 12.02% | 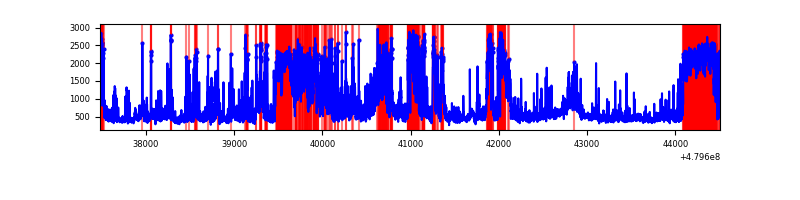 |
| C | 7024 | 7024 | 379 | 379 | 5.40% | 5.40% | 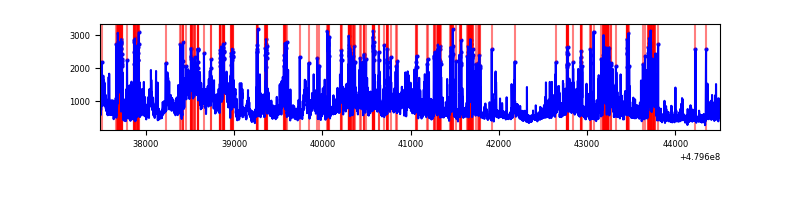 |
| D | 7023 | 7023 | 3444 | 3444 | 49.04% | 49.04% | 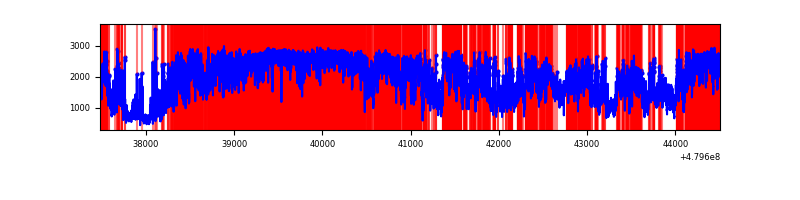 |
Top three noisy pixels from each quadrant. If the there are fewer than three noisy pixels in the level2.evt file, extra rows are filled as -1
| Pixel properties | Quadrant properties | ||||||
|---|---|---|---|---|---|---|---|
| Quadrant | DetID | PixID | Counts | Sigma | Mean | Median | Sigma |
| A | 4 | 4 | 3567914 | 20578.39 | 693 | 675 | 173.3 |
| A | 12 | 80 | 2239877 | 12917.32 | 693 | 675 | 173.3 |
| A | 12 | 3 | 1202725 | 6934.29 | 693 | 675 | 173.3 |
| B | 12 | 32 | 1675999 | 11670.51 | 671 | 648 | 143.6 |
| B | 10 | 60 | 895861 | 6236.06 | 671 | 648 | 143.6 |
| B | 5 | 185 | 277068 | 1925.54 | 671 | 648 | 143.6 |
| C | 12 | 247 | 1033943 | 5458.96 | 692 | 687 | 189.3 |
| C | 3 | 233 | 551648 | 2910.87 | 692 | 687 | 189.3 |
| C | 13 | 3 | 478278 | 2523.24 | 692 | 687 | 189.3 |
| D | 8 | 176 | 10428424 | 62167.73 | 606 | 586 | 167.7 |
| D | 6 | 42 | 133709 | 793.64 | 606 | 586 | 167.7 |
| D | 2 | 216 | 106216 | 629.74 | 606 | 586 | 167.7 |
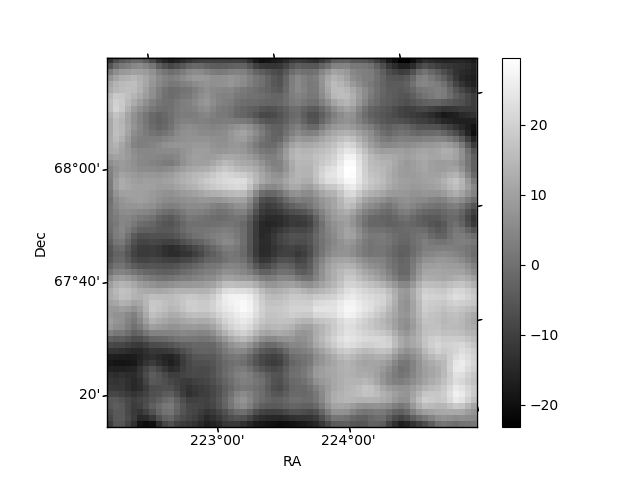
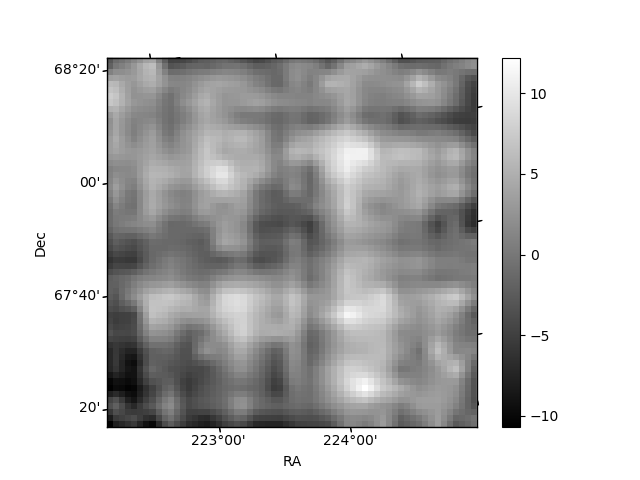
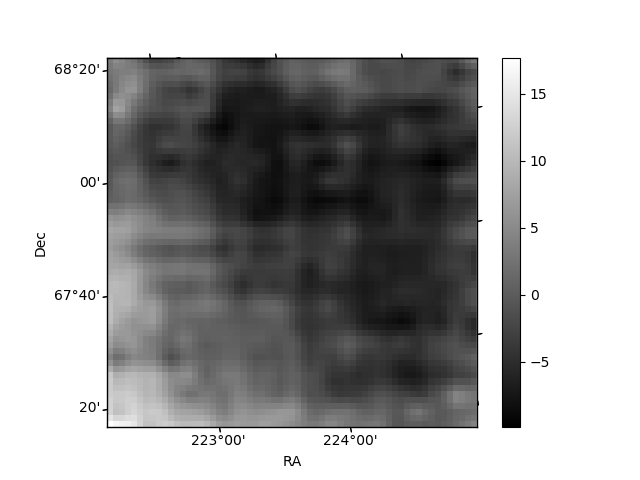
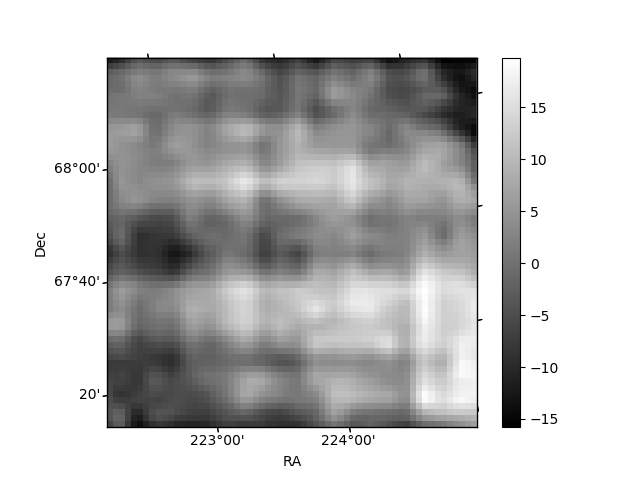
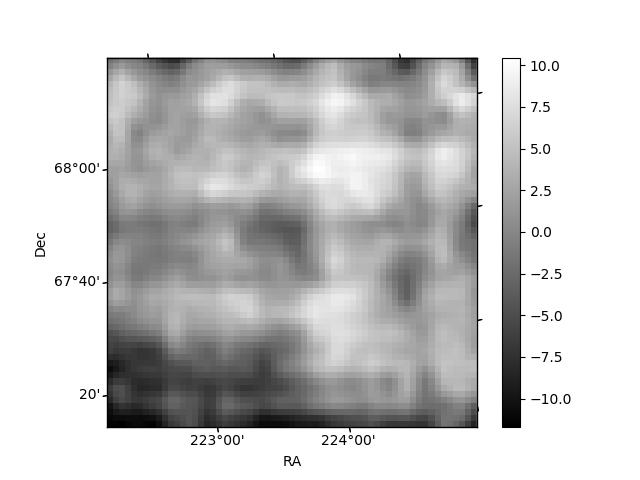
Histogram calculated using DETX and DETY for each event in the final _common_clean file
| Quadrant A | 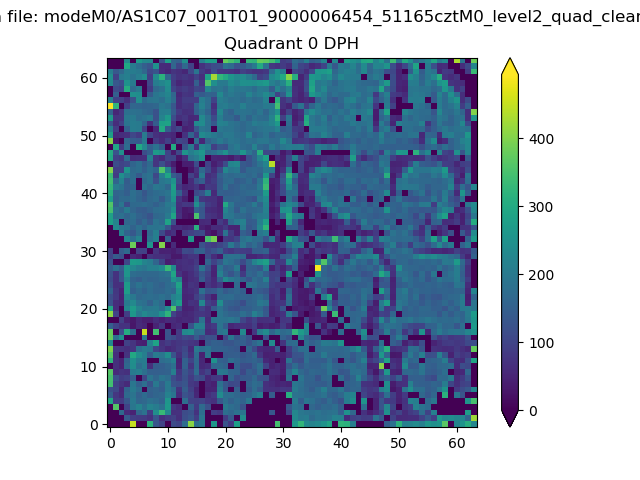 |
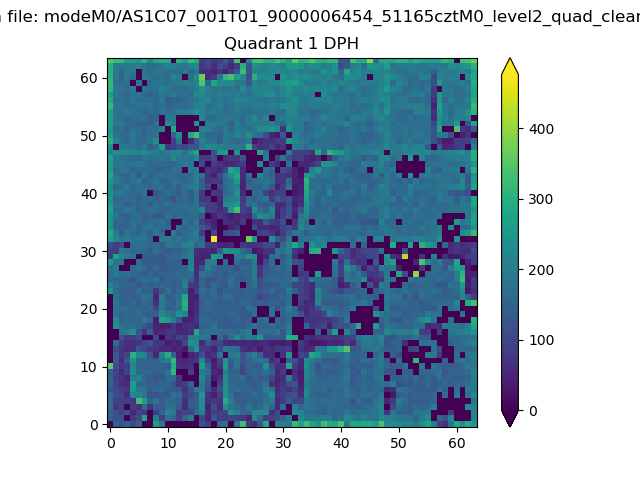 |
Quadrant B |
|---|---|---|---|
| Quadrant D | 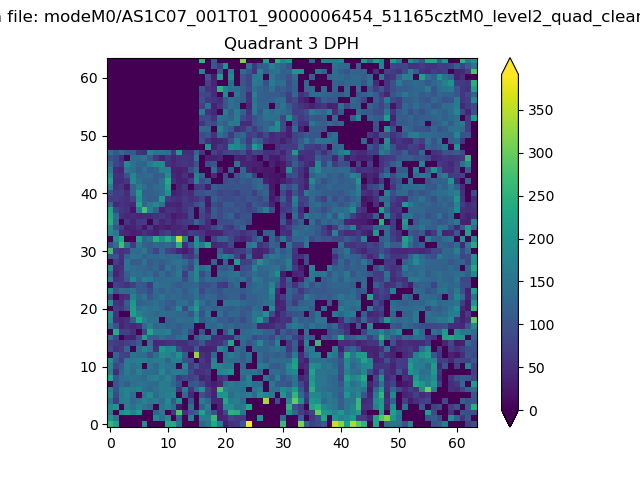 |
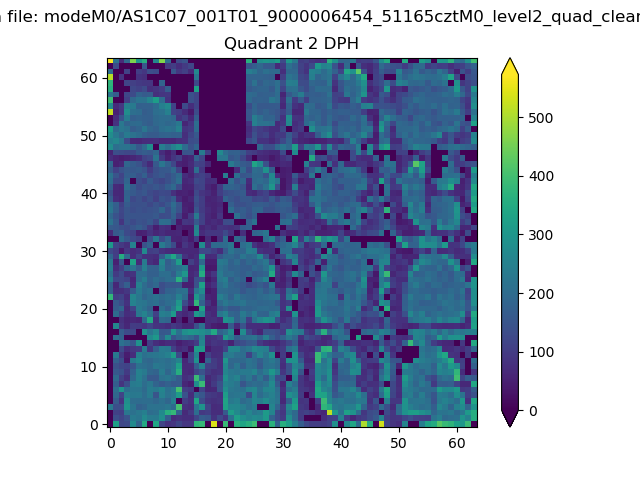 |
Quadrant C |
| Plot type | Count rate plots | Images |
|---|---|---|
| Comparison with Poisson distribution Blue bars denote a histogram of data divided into 1 sec bins. Red curve is a Poisson curve with rate = median count rate of data. |
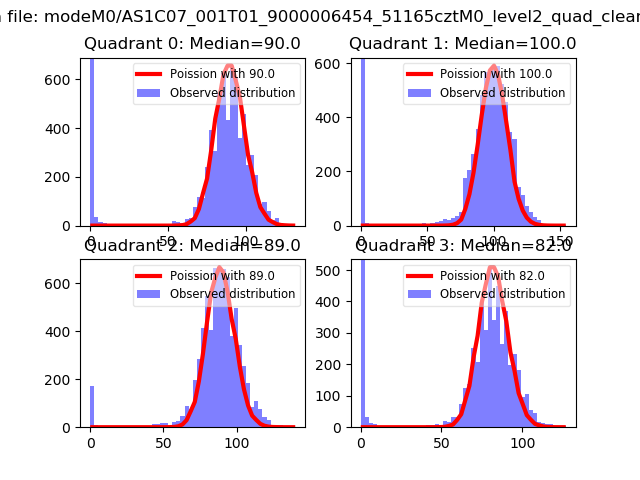 |
 |
| Quadrant-wise count rates Data is divided into 100 sec bins |
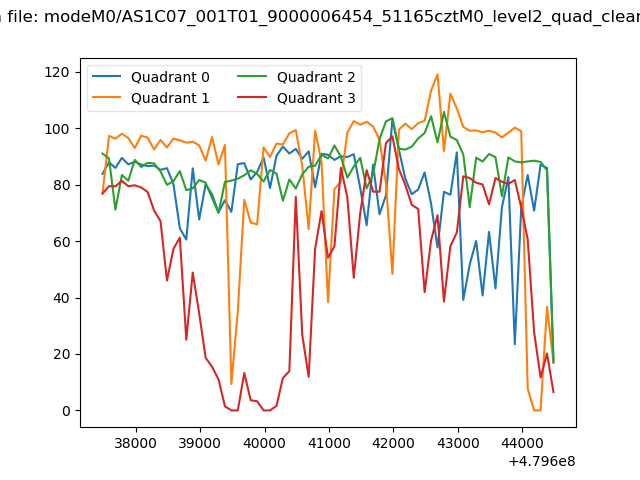 |
|
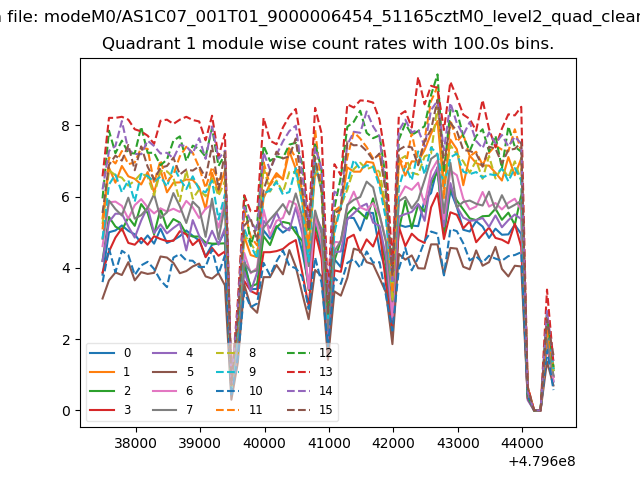
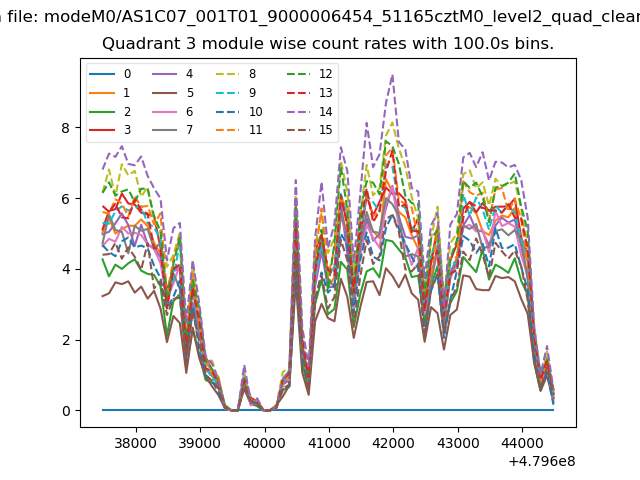
| Module-wise count rates for Quadrant A Data is divided into 100 sec bins |
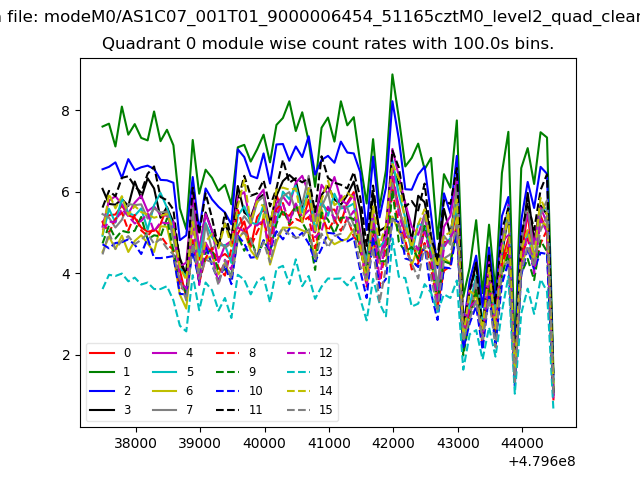 |
 |
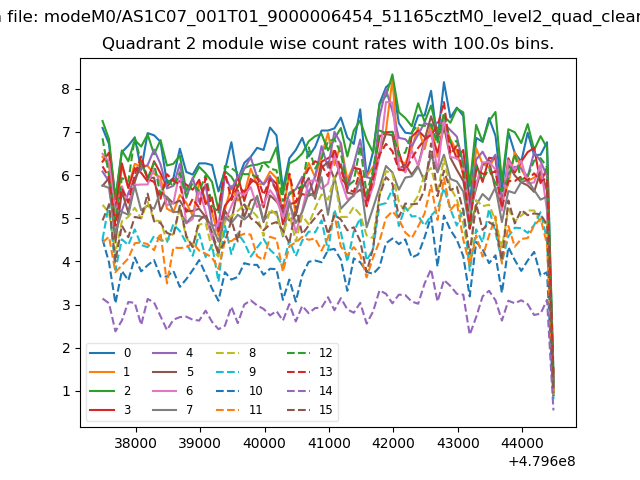
| Module-wise count rates for Quadrant B Data is divided into 100 sec bins |
 |
 |
| Module-wise count rates for Quadrant C Data is divided into 100 sec bins |
 |
 |
| Module-wise count rates for Quadrant D Data is divided into 100 sec bins |
 |
 |
| Parameter | Plot |
|---|---|
| CZT HV Monitor |  |
| D_VDD | 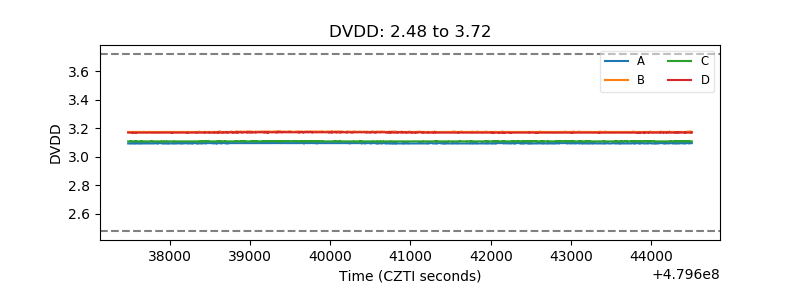 |
| Temperature 1 | 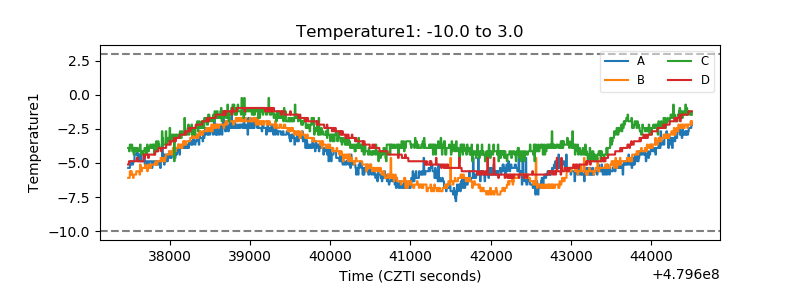 |
| Veto HV Monitor | 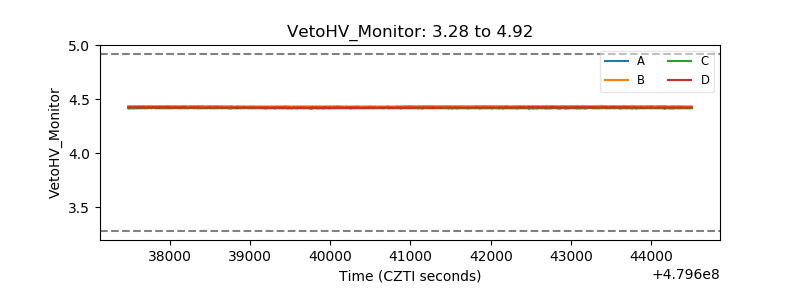 |
| Veto LLD | 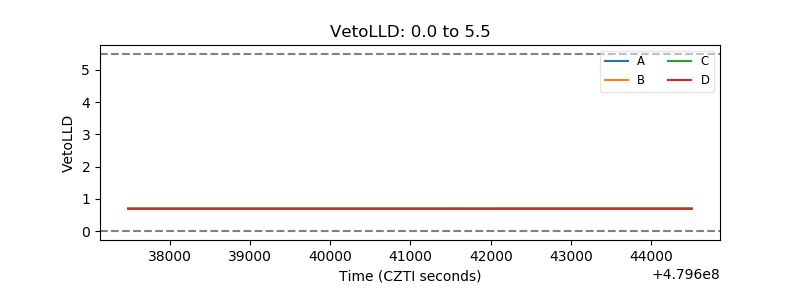 |
| Alpha Counter | 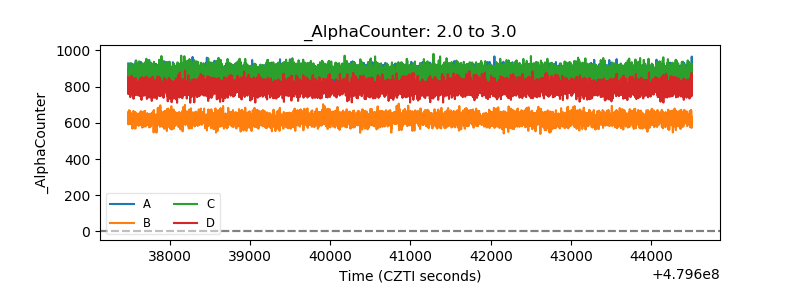 |
| _CPM_Rate | 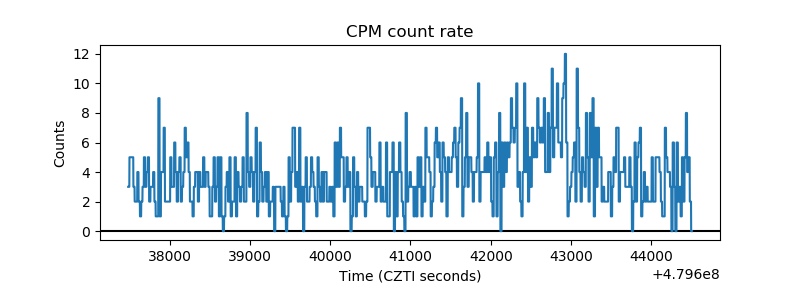 |
| CZT Counter | 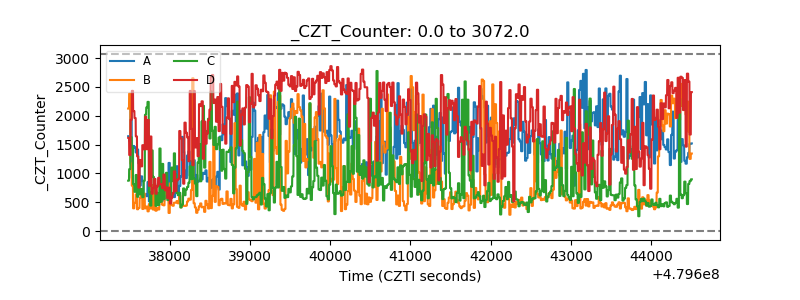 |
| +2.5 Volts monitor | 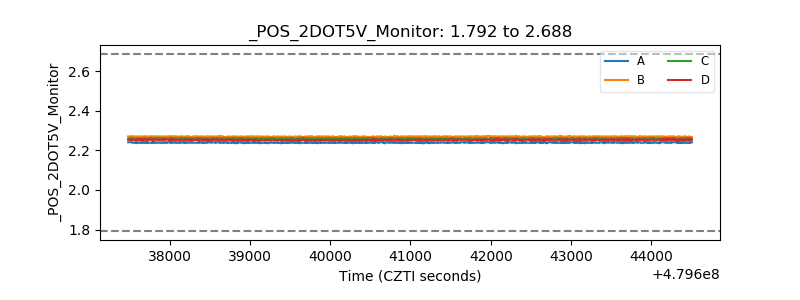 |
| +5 Volts monitor | 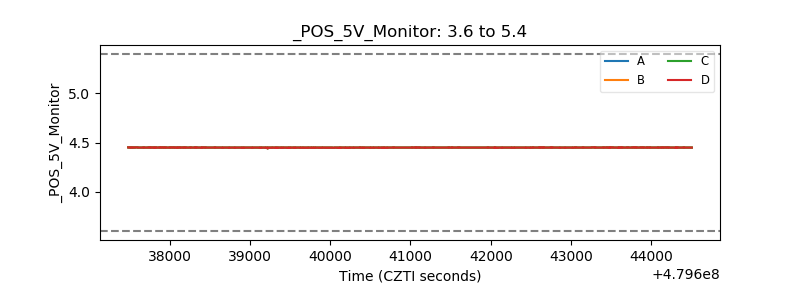 |
| _ROLL_ROT | 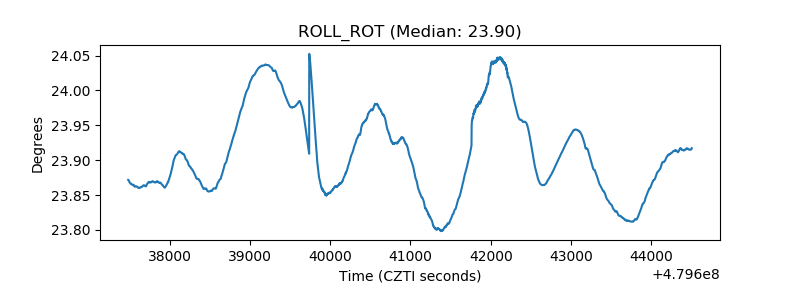 |
| _Roll_DEC | 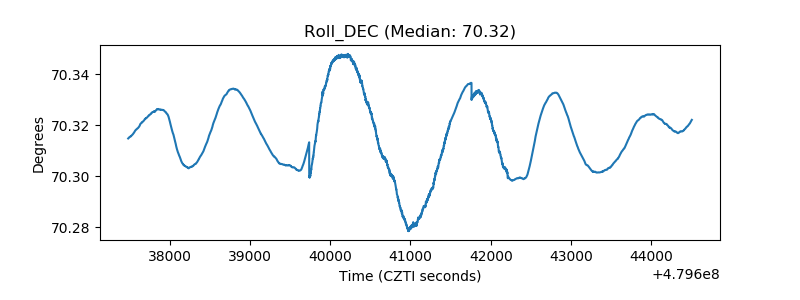 |
| _Roll_RA | 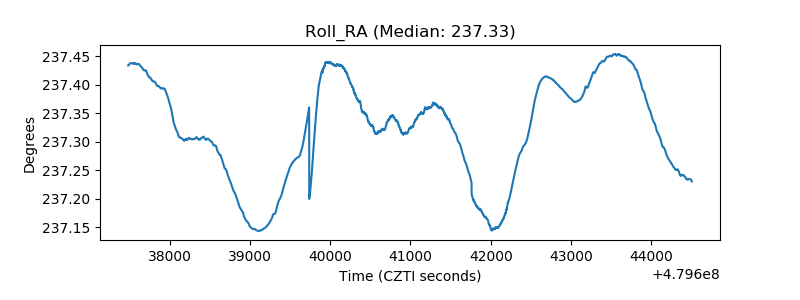 |
| Veto Counter | 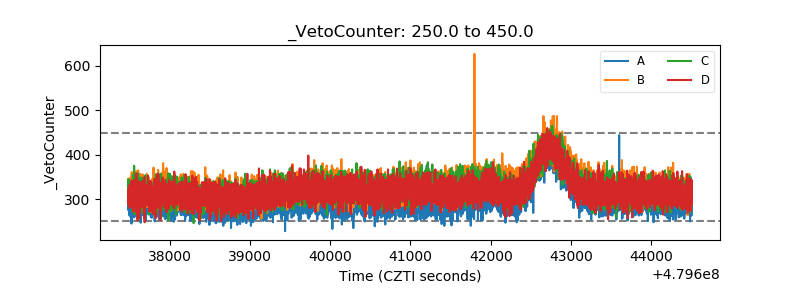 |