| Param | Original file | Final file |
|---|---|---|
| Filename | modeM0/AS1C07_001T01_9000006454_51166cztM0_level2.fits | modeM0/AS1C07_001T01_9000006454_51166cztM0_level2_quad_clean.evt |
| Size (bytes) | 1,288,532,160 | 68,932,800 |
| Size | 1.2 GB | 65.7 MB |
| Events in quadrant A | 12,842,866 | 446,855 |
| Events in quadrant B | 8,173,588 | 489,319 |
| Events in quadrant C | 8,756,191 | 525,930 |
| Events in quadrant D | 17,372,105 | 123,837 |
| Mode M0 | |||
|---|---|---|---|
| Quadrant | BADHDUFLAG | Total packets | Discarded packets |
| A | 0 | 43118 | 5 |
| B | 0 | 29256 | 0 |
| C | 0 | 31006 | 0 |
| D | 0 | 56561 | 0 |
| Mode SS | |||
|---|---|---|---|
| Quadrant | BADHDUFLAG | Total packets | Discarded packets |
| A | 0 | 144 | 0 |
| B | 0 | 144 | 0 |
| C | 0 | 144 | 0 |
| D | 0 | 144 | 0 |
| Quadrant | Total seconds | Saturated seconds | Saturation percentage |
|---|---|---|---|
| A | 7187 | 2817 | 39.195770% |
| B | 7187 | 2449 | 34.075414% |
| C | 7187 | 1508 | 20.982329% |
| D | 7187 | 6073 | 84.499791% |
Noise dominated data is calculated using 1-second bins in cleaned event files. If a bin has >2000 counts, and if more than 50% of those come from <1% of pixels, then it is considered to be noise-dominated and hence unusable.
| Quadrant | # 1 sec bins | Bins with >0 counts | Bins with >2000 counts | High rate bins dominated by noise | Noise dominated (total time) | Noise dominated (detector-on time) | Marked lightcurve |
|---|---|---|---|---|---|---|---|
| A | 7186 | 7186 | 2697 | 2697 | 37.53% | 37.53% | 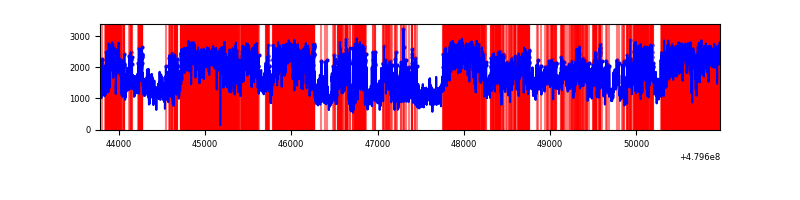 |
| B | 7187 | 7187 | 1168 | 1168 | 16.25% | 16.25% | 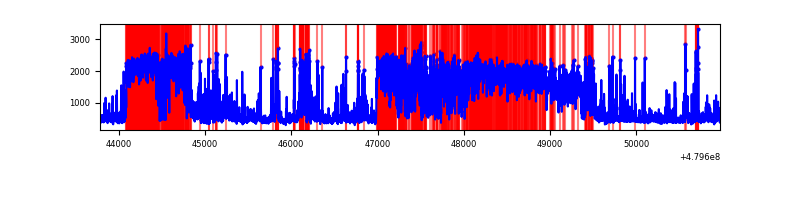 |
| C | 7187 | 7187 | 1418 | 1418 | 19.73% | 19.73% | 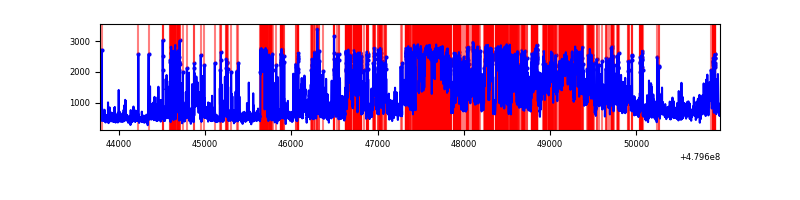 |
| D | 7186 | 7186 | 6341 | 6341 | 88.24% | 88.24% | 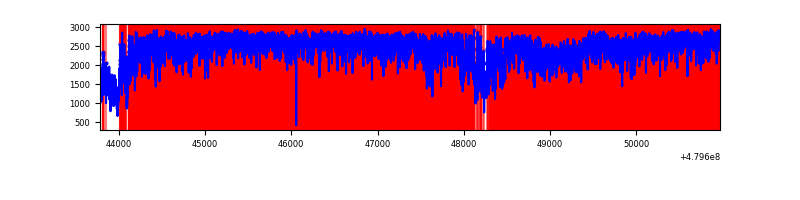 |
Top three noisy pixels from each quadrant. If the there are fewer than three noisy pixels in the level2.evt file, extra rows are filled as -1
| Pixel properties | Quadrant properties | ||||||
|---|---|---|---|---|---|---|---|
| Quadrant | DetID | PixID | Counts | Sigma | Mean | Median | Sigma |
| A | 4 | 4 | 4667445 | 28223.15 | 661 | 644 | 165.4 |
| A | 12 | 80 | 1906823 | 11527.89 | 661 | 644 | 165.4 |
| A | 4 | 207 | 812139 | 4907.63 | 661 | 644 | 165.4 |
| B | 12 | 32 | 4128952 | 30297.16 | 631 | 610 | 136.3 |
| B | 10 | 60 | 386799 | 2834.17 | 631 | 610 | 136.3 |
| B | 5 | 185 | 301111 | 2205.32 | 631 | 610 | 136.3 |
| C | 15 | 157 | 2398506 | 13123.97 | 659 | 654 | 182.7 |
| C | 12 | 247 | 1063060 | 5814.78 | 659 | 654 | 182.7 |
| C | 4 | 13 | 847237 | 4633.53 | 659 | 654 | 182.7 |
| D | 8 | 176 | 14065586 | 102807.69 | 479 | 460 | 136.8 |
| D | 6 | 42 | 277815 | 2027.3 | 479 | 460 | 136.8 |
| D | 15 | 108 | 211930 | 1545.72 | 479 | 460 | 136.8 |
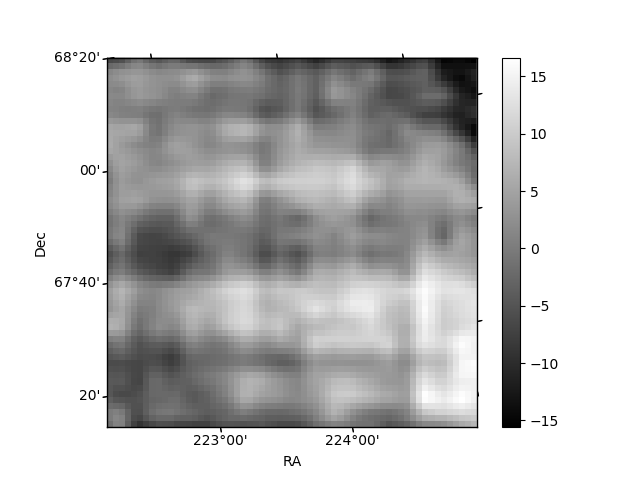
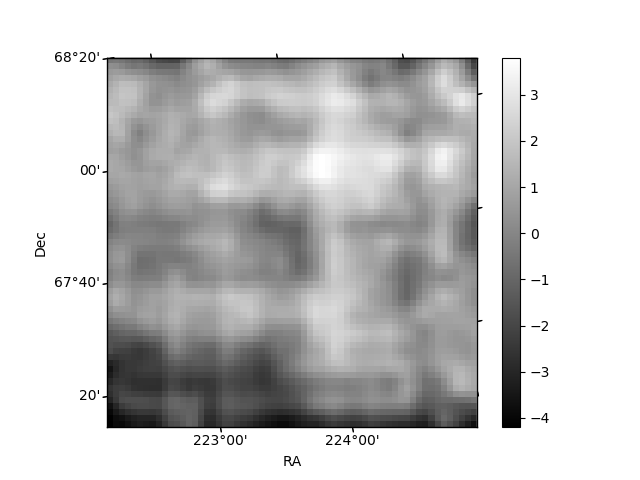
Histogram calculated using DETX and DETY for each event in the final _common_clean file
| Quadrant A | 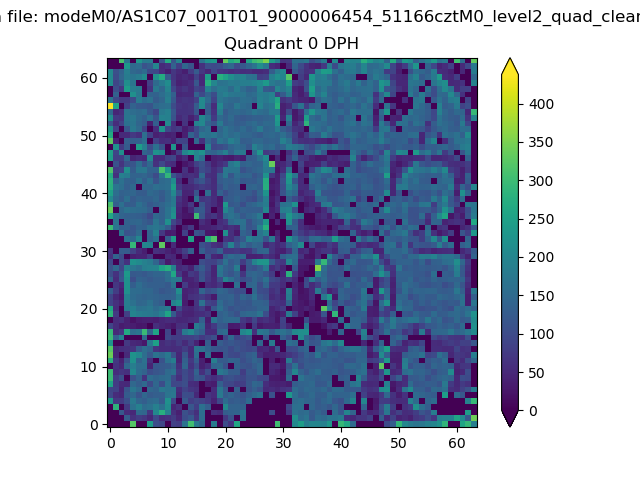 |
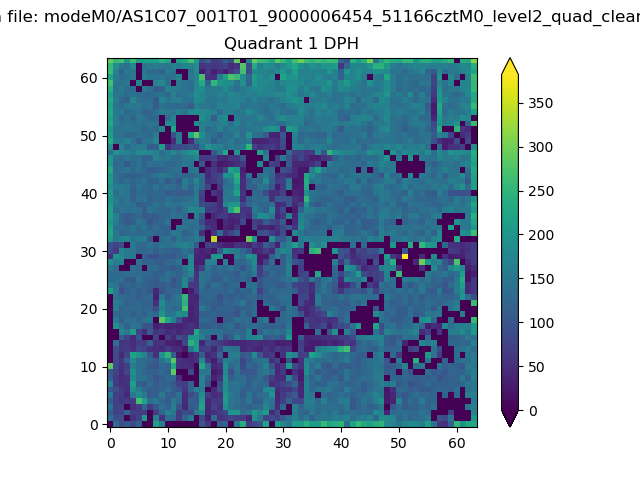 |
Quadrant B |
|---|---|---|---|
| Quadrant D | 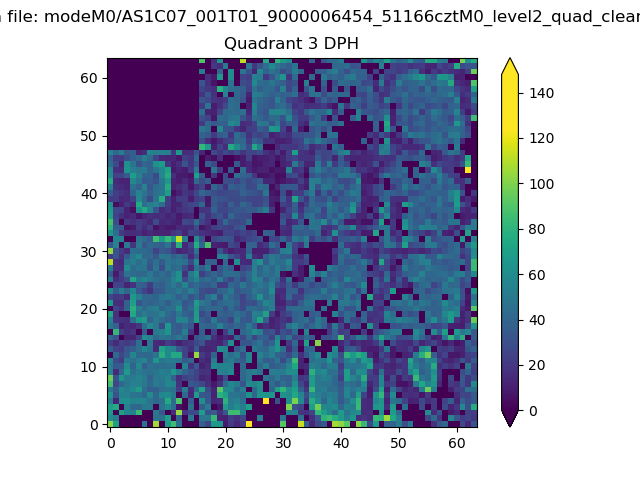 |
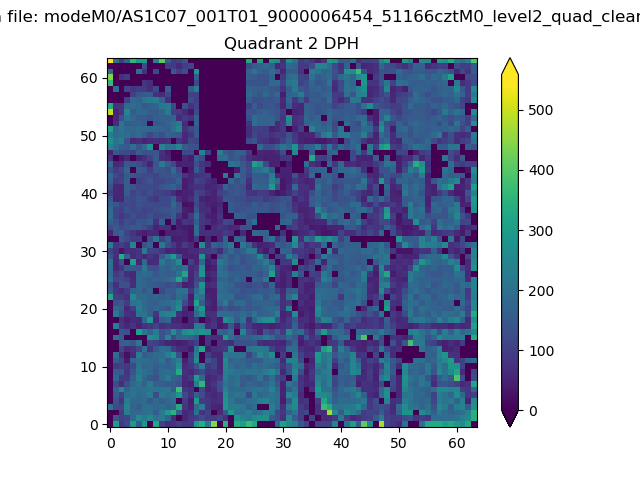 |
Quadrant C |
| Plot type | Count rate plots | Images |
|---|---|---|
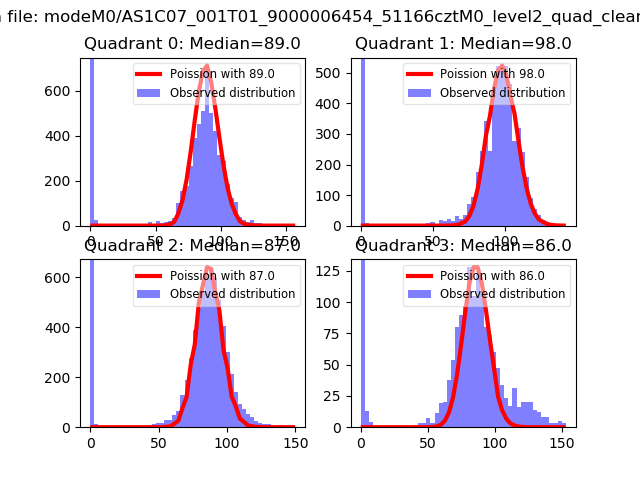
| Comparison with Poisson distribution Blue bars denote a histogram of data divided into 1 sec bins. Red curve is a Poisson curve with rate = median count rate of data. |
 |
 |
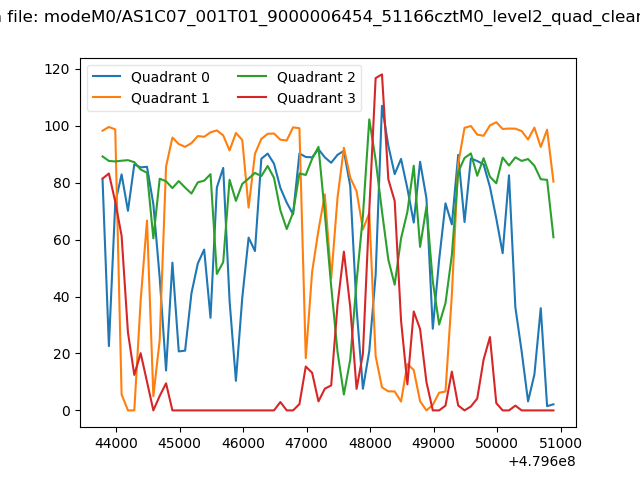
| Quadrant-wise count rates Data is divided into 100 sec bins |
 |
|
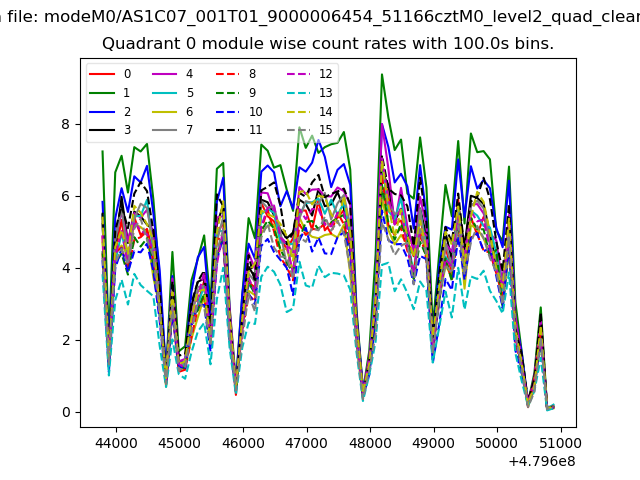
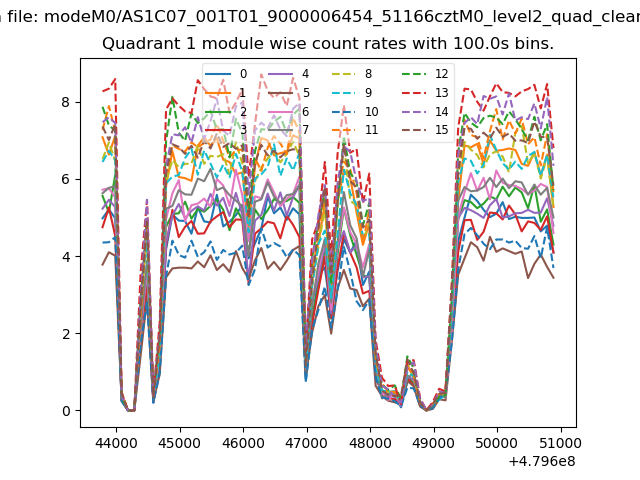
| Module-wise count rates for Quadrant A Data is divided into 100 sec bins |
 |
 |
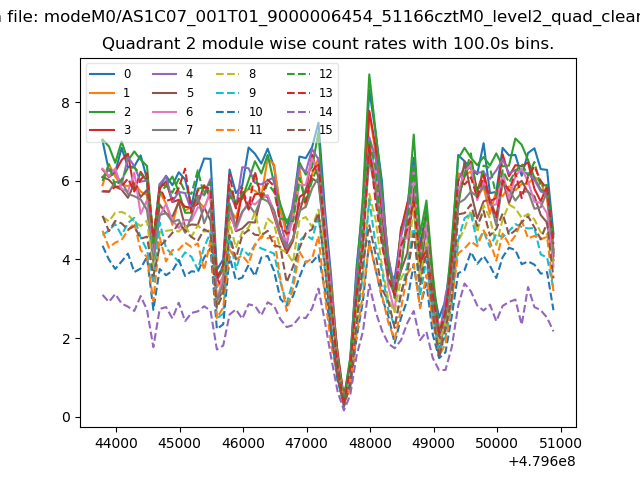
| Module-wise count rates for Quadrant B Data is divided into 100 sec bins |
 |
 |
| Module-wise count rates for Quadrant C Data is divided into 100 sec bins |
 |
 |
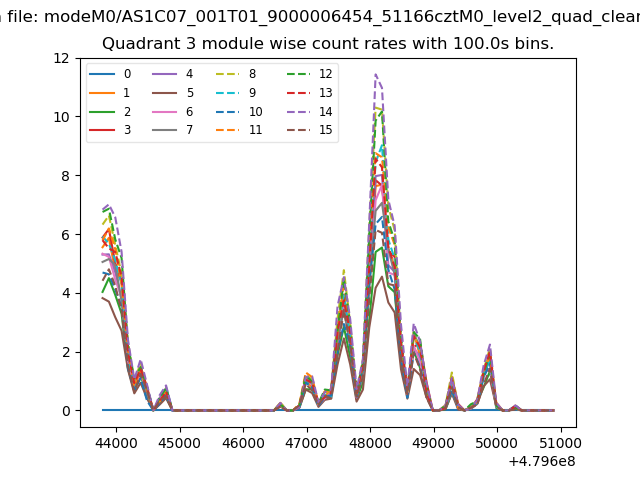
| Module-wise count rates for Quadrant D Data is divided into 100 sec bins |
 |
 |
| Parameter | Plot |
|---|---|
| CZT HV Monitor | 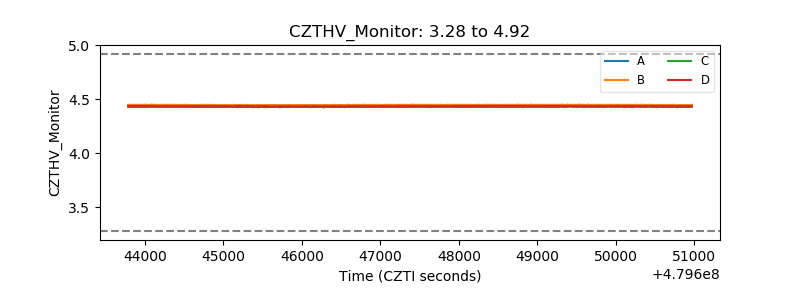 |
| D_VDD | 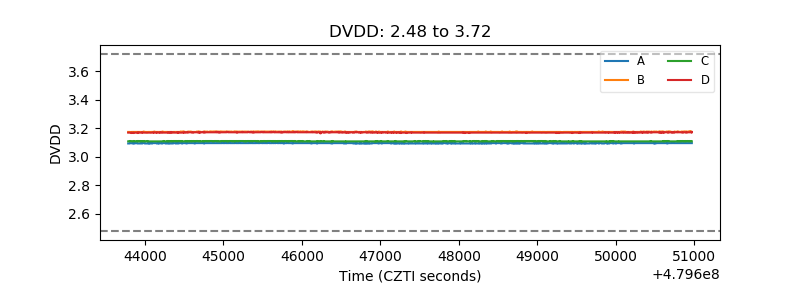 |
| Temperature 1 | 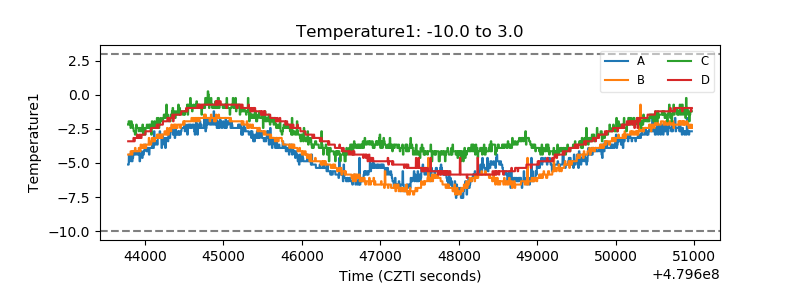 |
| Veto HV Monitor |  |
| Veto LLD | 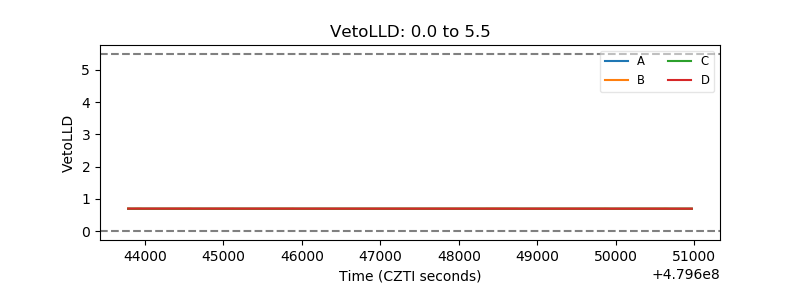 |
| Alpha Counter | 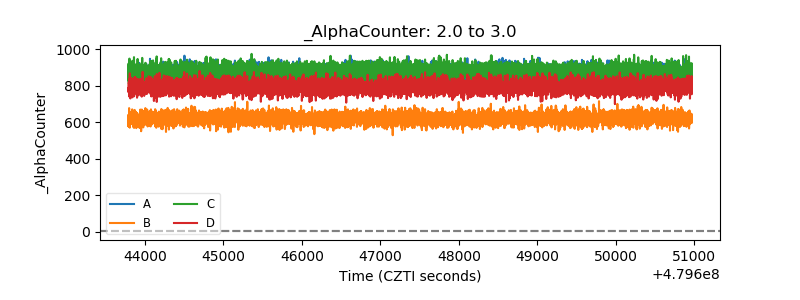 |
| _CPM_Rate | 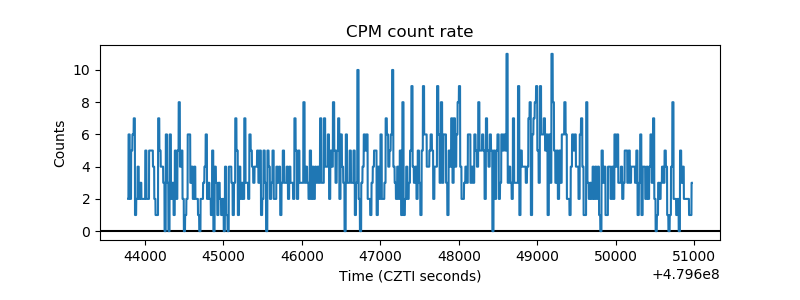 |
| CZT Counter | 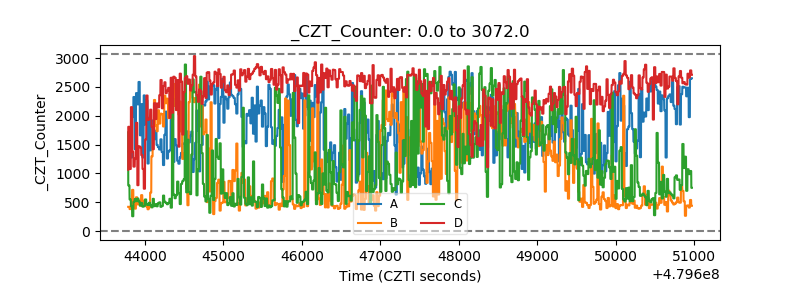 |
| +2.5 Volts monitor | 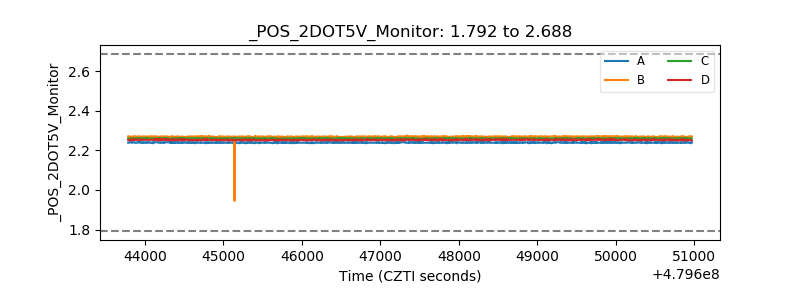 |
| +5 Volts monitor | 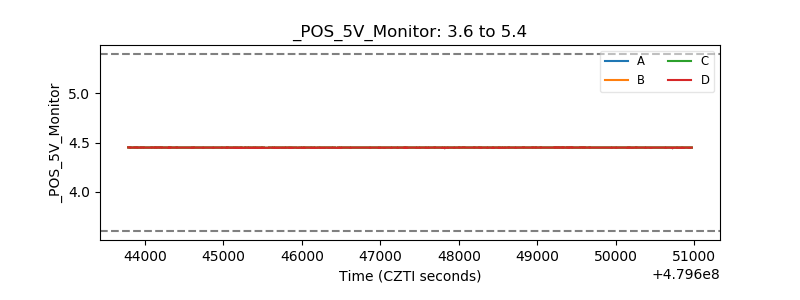 |
| _ROLL_ROT | 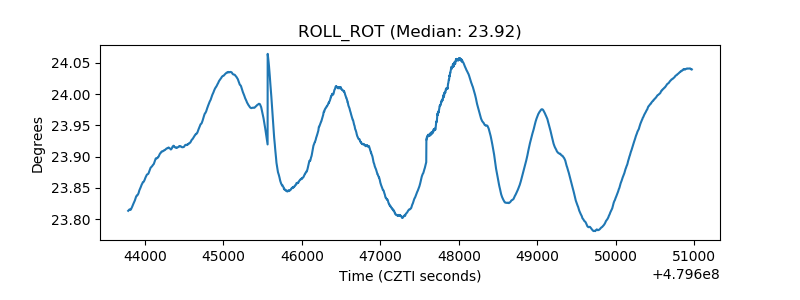 |
| _Roll_DEC | 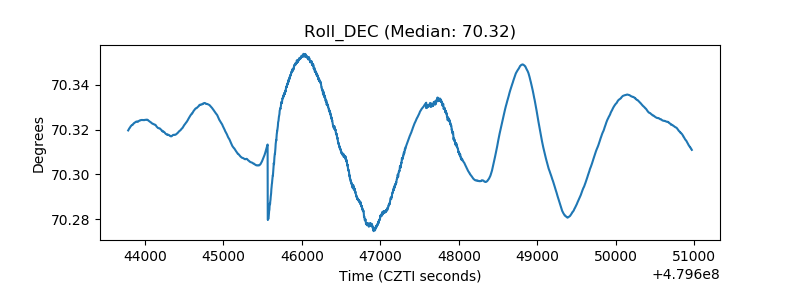 |
| _Roll_RA | 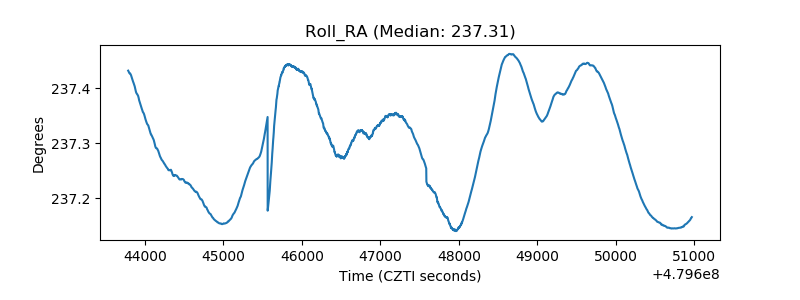 |
| Veto Counter | 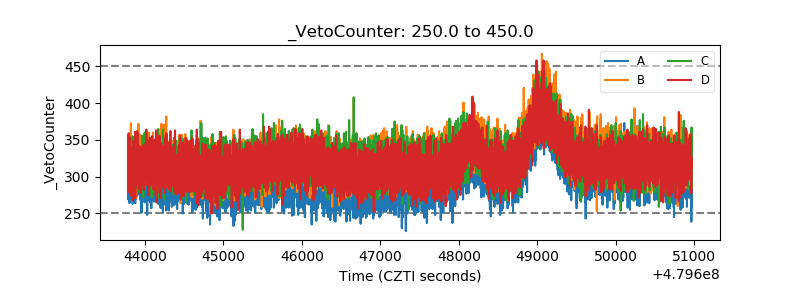 |