| Param | Original file | Final file |
|---|---|---|
| Filename | modeM0/AS1C07_001T01_9000006454_51167cztM0_level2.fits | modeM0/AS1C07_001T01_9000006454_51167cztM0_level2_quad_clean.evt |
| Size (bytes) | 998,369,280 | 81,823,680 |
| Size | 952.1 MB | 78.0 MB |
| Events in quadrant A | 13,907,074 | 310,534 |
| Events in quadrant B | 4,584,562 | 685,328 |
| Events in quadrant C | 5,715,542 | 610,214 |
| Events in quadrant D | 12,211,597 | 384,925 |
| Mode M0 | |||
|---|---|---|---|
| Quadrant | BADHDUFLAG | Total packets | Discarded packets |
| A | 0 | 46115 | 0 |
| B | 0 | 18438 | 0 |
| C | 0 | 21812 | 0 |
| D | 0 | 41151 | 0 |
| Mode SS | |||
|---|---|---|---|
| Quadrant | BADHDUFLAG | Total packets | Discarded packets |
| A | 0 | 140 | 0 |
| B | 0 | 140 | 0 |
| C | 0 | 140 | 0 |
| D | 0 | 140 | 0 |
| Quadrant | Total seconds | Saturated seconds | Saturation percentage |
|---|---|---|---|
| A | 6975 | 4130 | 59.211470% |
| B | 6975 | 292 | 4.186380% |
| C | 6975 | 286 | 4.100358% |
| D | 6975 | 2830 | 40.573477% |
Noise dominated data is calculated using 1-second bins in cleaned event files. If a bin has >2000 counts, and if more than 50% of those come from <1% of pixels, then it is considered to be noise-dominated and hence unusable.
| Quadrant | # 1 sec bins | Bins with >0 counts | Bins with >2000 counts | High rate bins dominated by noise | Noise dominated (total time) | Noise dominated (detector-on time) | Marked lightcurve |
|---|---|---|---|---|---|---|---|
| A | 6975 | 6975 | 3825 | 3825 | 54.84% | 54.84% | 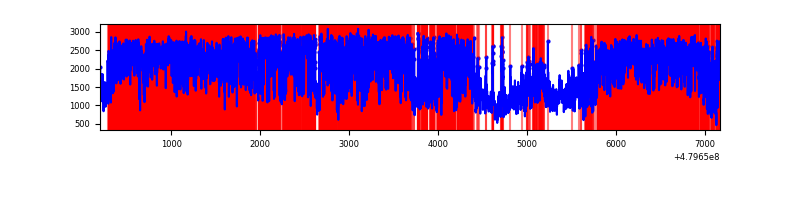 |
| B | 6975 | 6975 | 169 | 169 | 2.42% | 2.42% | 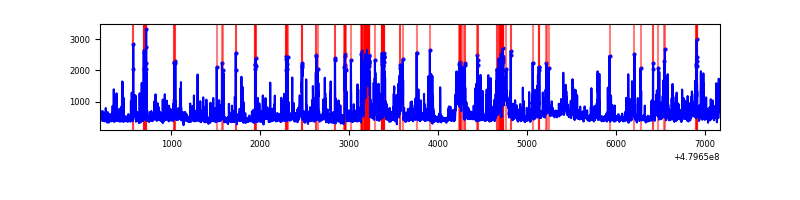 |
| C | 6975 | 6975 | 258 | 258 | 3.70% | 3.70% | 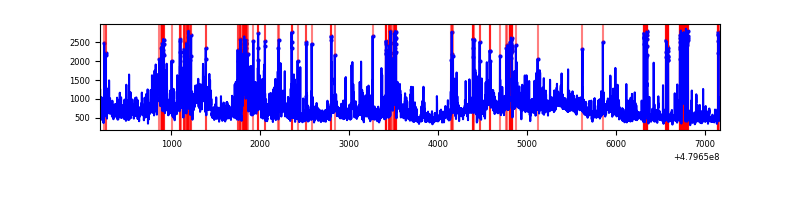 |
| D | 6975 | 6975 | 3091 | 3091 | 44.32% | 44.32% | 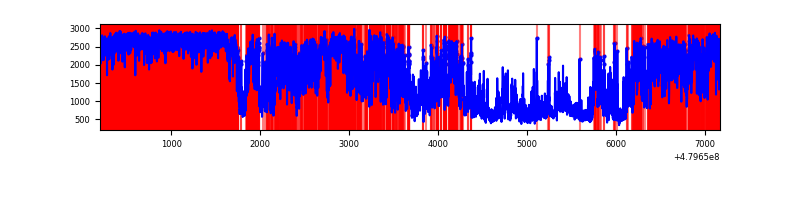 |
Top three noisy pixels from each quadrant. If the there are fewer than three noisy pixels in the level2.evt file, extra rows are filled as -1
| Pixel properties | Quadrant properties | ||||||
|---|---|---|---|---|---|---|---|
| Quadrant | DetID | PixID | Counts | Sigma | Mean | Median | Sigma |
| A | 14 | 254 | 4347054 | 31738.33 | 553 | 540 | 136.9 |
| A | 4 | 4 | 3492170 | 25495.95 | 553 | 540 | 136.9 |
| A | 4 | 207 | 1386418 | 10119.71 | 553 | 540 | 136.9 |
| B | 5 | 185 | 472867 | 3035.13 | 722 | 697 | 155.6 |
| B | 4 | 171 | 273043 | 1750.65 | 722 | 697 | 155.6 |
| B | 10 | 60 | 243969 | 1563.76 | 722 | 697 | 155.6 |
| C | 12 | 247 | 1020808 | 5319.51 | 704 | 701 | 191.8 |
| C | 15 | 147 | 447770 | 2331.31 | 704 | 701 | 191.8 |
| C | 15 | 157 | 330126 | 1717.84 | 704 | 701 | 191.8 |
| D | 8 | 176 | 8439564 | 51486.83 | 591 | 571 | 163.9 |
| D | 2 | 216 | 196856 | 1197.55 | 591 | 571 | 163.9 |
| D | 7 | 60 | 144258 | 876.64 | 591 | 571 | 163.9 |
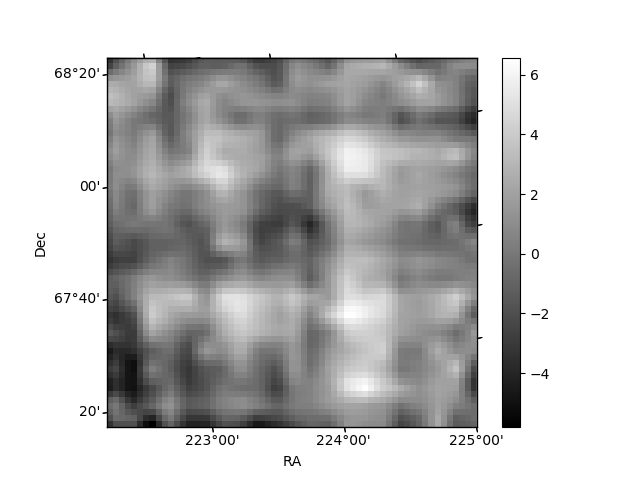
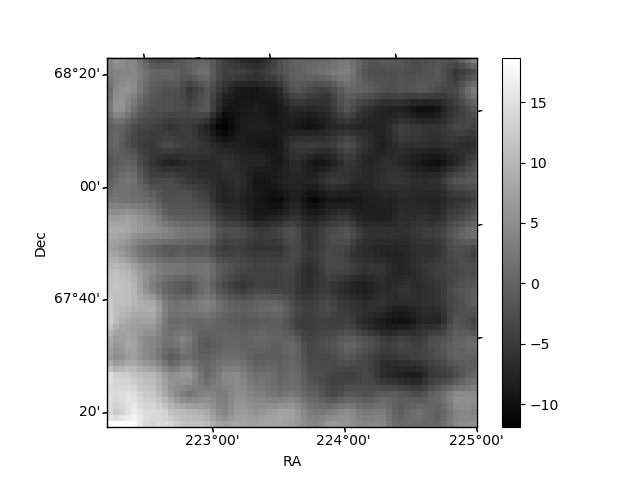
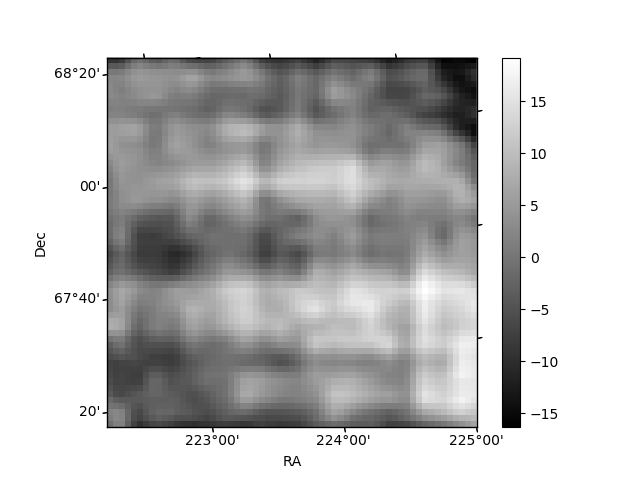
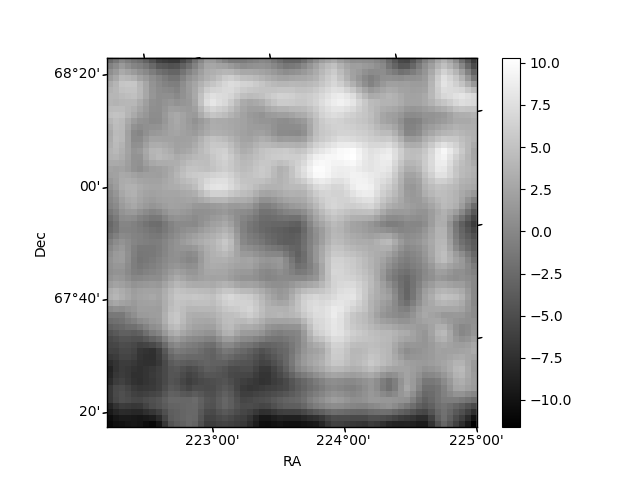
Histogram calculated using DETX and DETY for each event in the final _common_clean file
| Quadrant A | 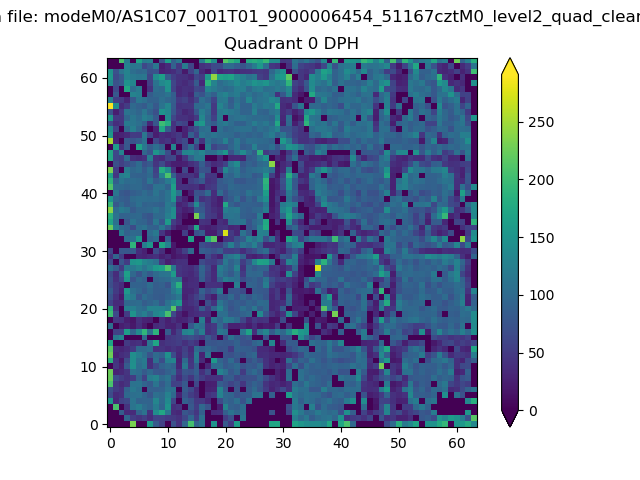 |
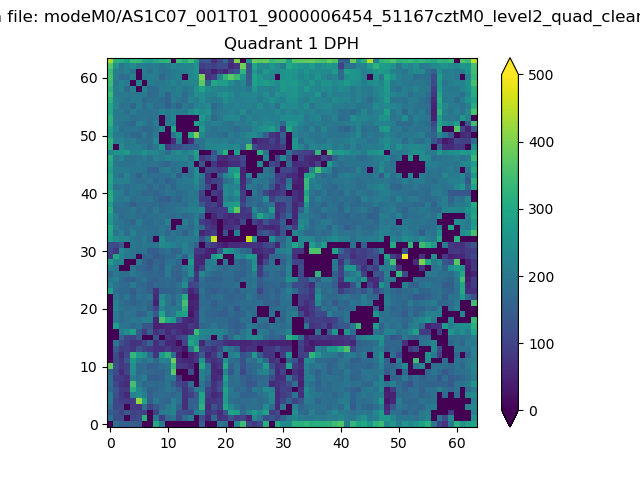 |
Quadrant B |
|---|---|---|---|
| Quadrant D | 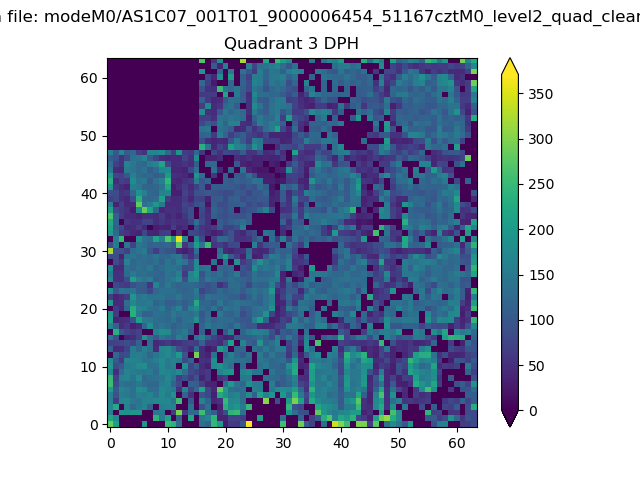 |
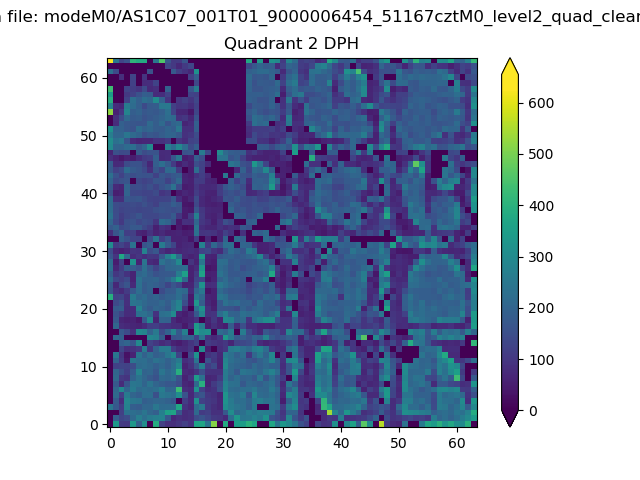 |
Quadrant C |
| Plot type | Count rate plots | Images |
|---|---|---|
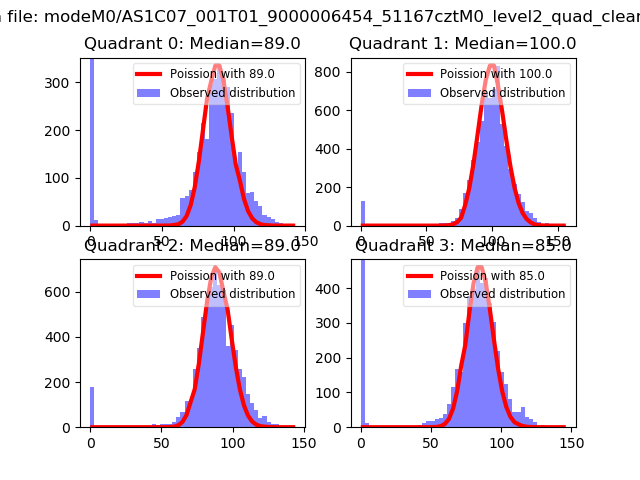
| Comparison with Poisson distribution Blue bars denote a histogram of data divided into 1 sec bins. Red curve is a Poisson curve with rate = median count rate of data. |
 |
 |
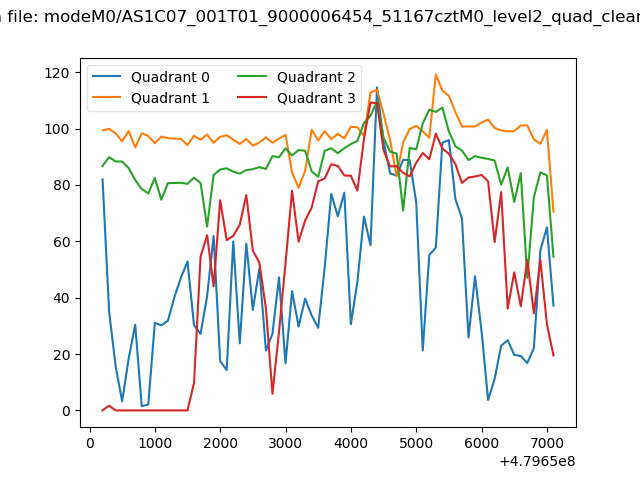
| Quadrant-wise count rates Data is divided into 100 sec bins |
 |
|
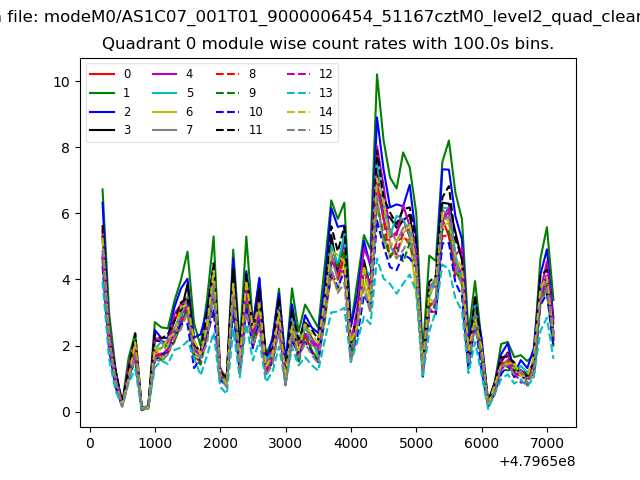
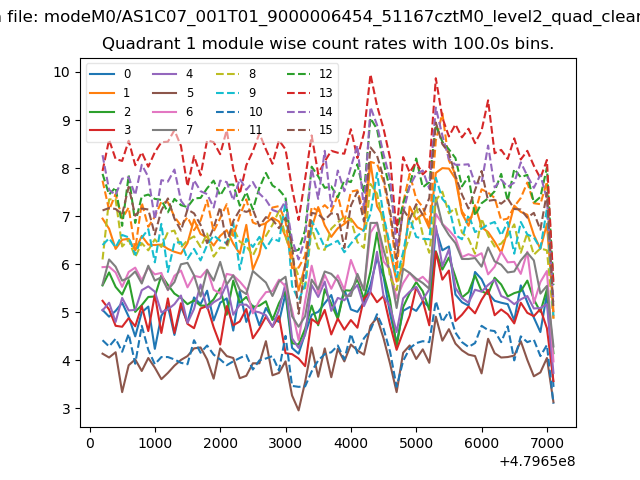
| Module-wise count rates for Quadrant A Data is divided into 100 sec bins |
 |
 |
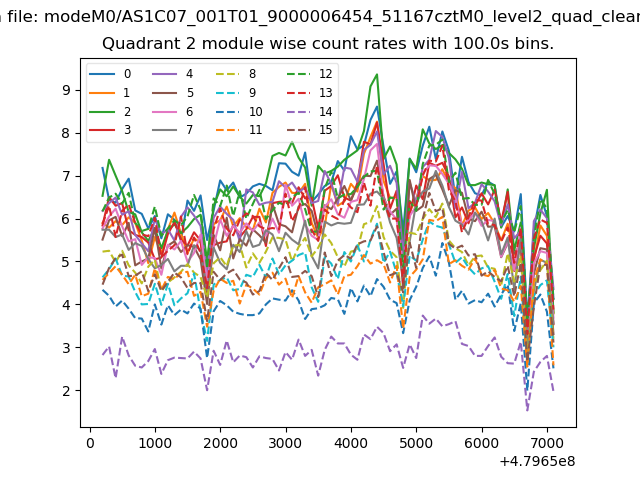
| Module-wise count rates for Quadrant B Data is divided into 100 sec bins |
 |
 |
| Module-wise count rates for Quadrant C Data is divided into 100 sec bins |
 |
 |
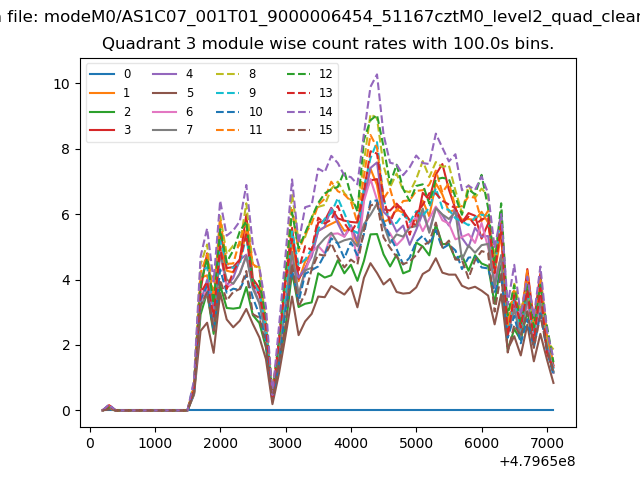
| Module-wise count rates for Quadrant D Data is divided into 100 sec bins |
 |
 |
| Parameter | Plot |
|---|---|
| CZT HV Monitor | 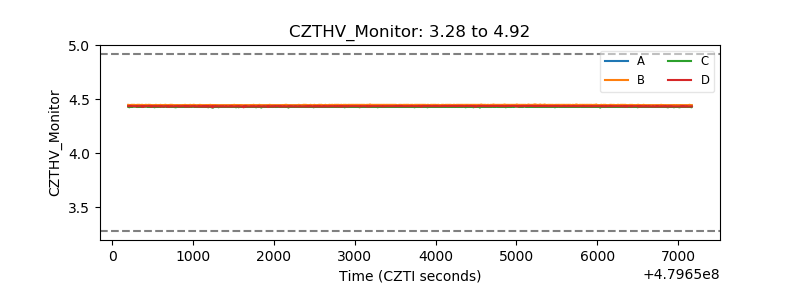 |
| D_VDD | 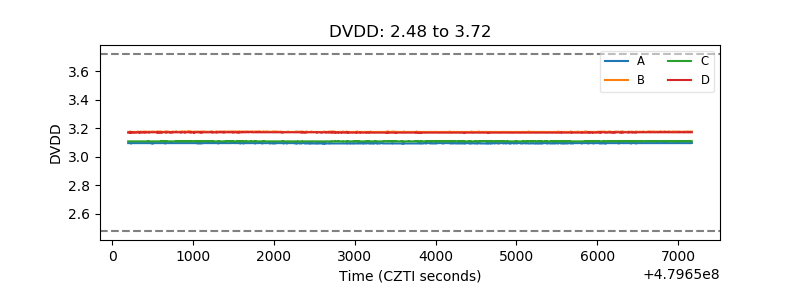 |
| Temperature 1 | 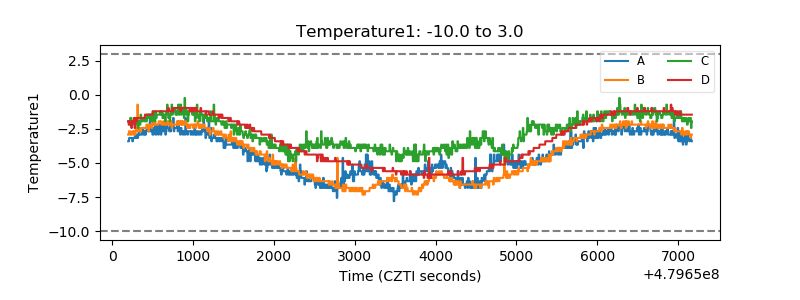 |
| Veto HV Monitor |  |
| Veto LLD | 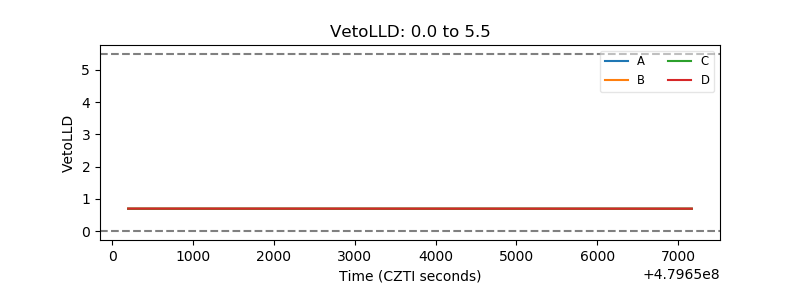 |
| Alpha Counter | 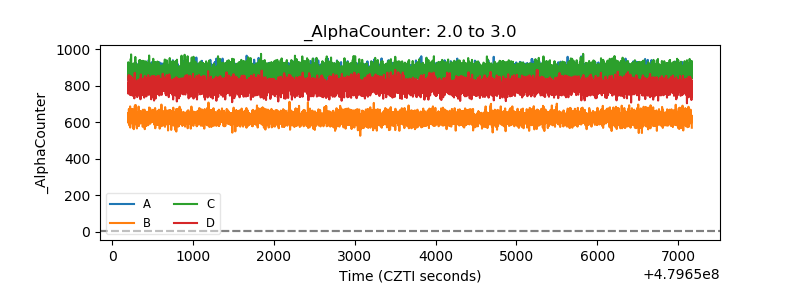 |
| _CPM_Rate | 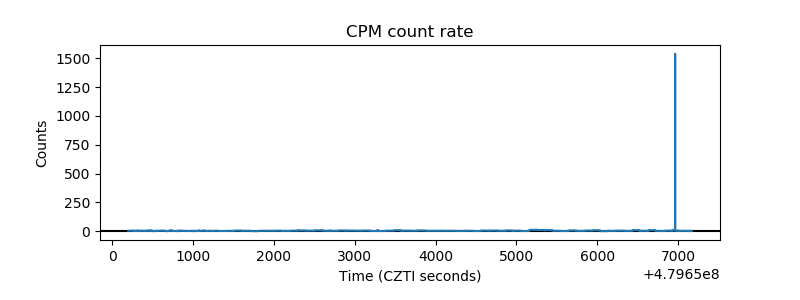 |
| CZT Counter | 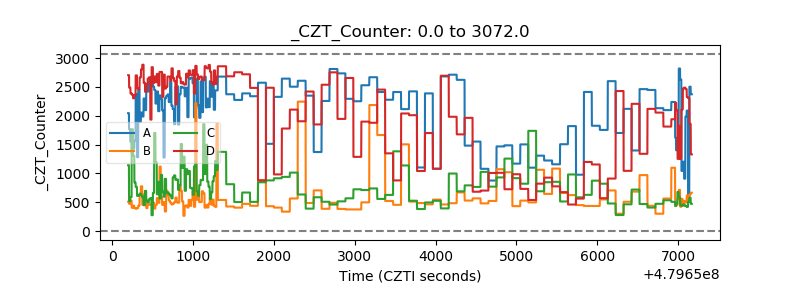 |
| +2.5 Volts monitor | 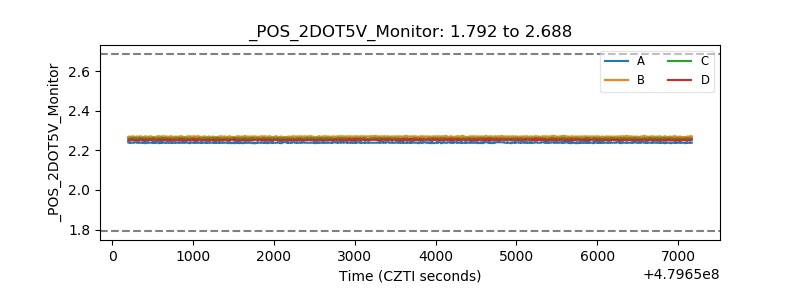 |
| +5 Volts monitor | 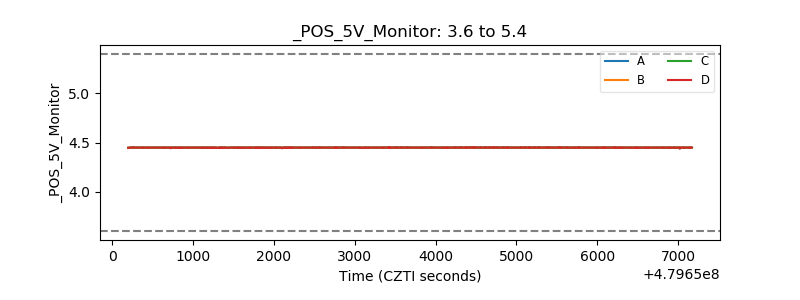 |
| _ROLL_ROT | 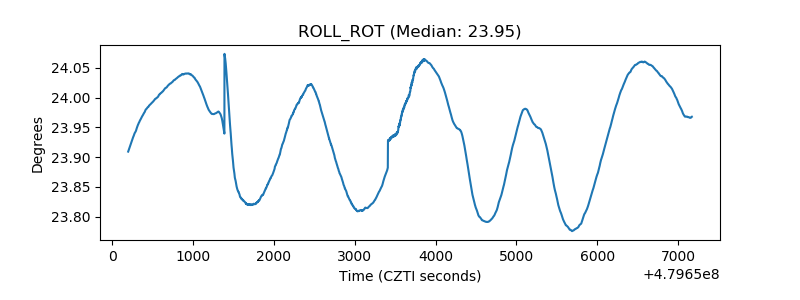 |
| _Roll_DEC | 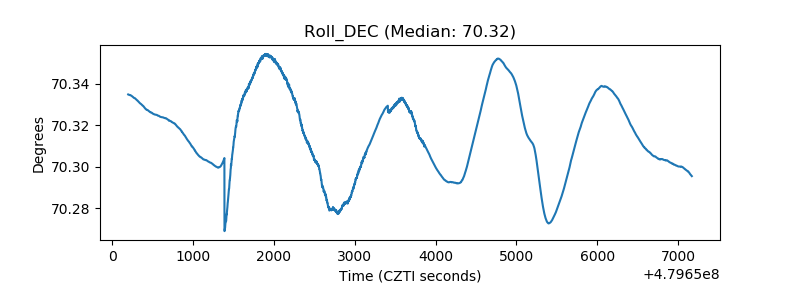 |
| _Roll_RA | 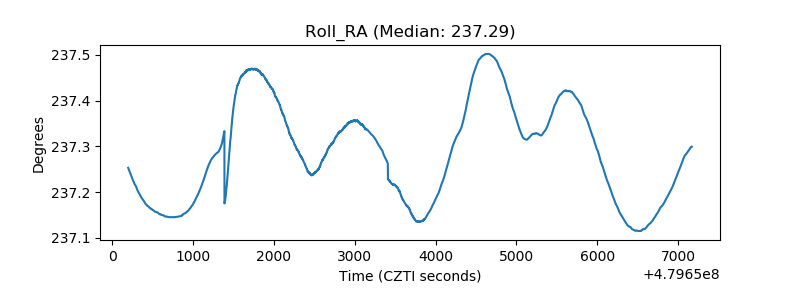 |
| Veto Counter | 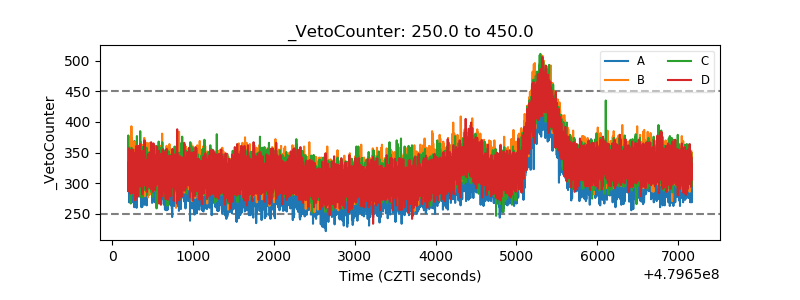 |