| Param | Original file | Final file |
|---|---|---|
| Filename | modeM0/AS1C07_001T01_9000006454_51170cztM0_level2.fits | modeM0/AS1C07_001T01_9000006454_51170cztM0_level2_quad_clean.evt |
| Size (bytes) | 2,270,419,200 | 208,621,440 |
| Size | 2.1 GB | 199.0 MB |
| Events in quadrant A | 32,178,208 | 946,562 |
| Events in quadrant B | 13,982,504 | 1,571,140 |
| Events in quadrant C | 20,172,973 | 1,297,279 |
| Events in quadrant D | 16,360,396 | 1,289,281 |
| Mode M0 | |||
|---|---|---|---|
| Quadrant | BADHDUFLAG | Total packets | Discarded packets |
| A | 0 | 107789 | 3 |
| B | 0 | 53588 | 6 |
| C | 0 | 72110 | 3 |
| D | 0 | 61253 | 3 |
| Mode SS | |||
|---|---|---|---|
| Quadrant | BADHDUFLAG | Total packets | Discarded packets |
| A | 0 | 360 | 0 |
| B | 0 | 360 | 0 |
| C | 0 | 360 | 0 |
| D | 0 | 360 | 0 |
| Mode M9 | |||
|---|---|---|---|
| Quadrant | BADHDUFLAG | Total packets | Discarded packets |
| A | 0 | 16 | 0 |
| B | 0 | 16 | 0 |
| C | 0 | 16 | 0 |
| D | 0 | 16 | 0 |
| Quadrant | Total seconds | Saturated seconds | Saturation percentage |
|---|---|---|---|
| A | 17554 | 7935 | 45.203372% |
| B | 17553 | 1992 | 11.348487% |
| C | 17553 | 2990 | 17.034125% |
| D | 17554 | 2402 | 13.683491% |
Noise dominated data is calculated using 1-second bins in cleaned event files. If a bin has >2000 counts, and if more than 50% of those come from <1% of pixels, then it is considered to be noise-dominated and hence unusable.
| Quadrant | # 1 sec bins | Bins with >0 counts | Bins with >2000 counts | High rate bins dominated by noise | Noise dominated (total time) | Noise dominated (detector-on time) | Marked lightcurve |
|---|---|---|---|---|---|---|---|
| A | 19243 | 17554 | 7840 | 7840 | 40.74% | 44.66% | 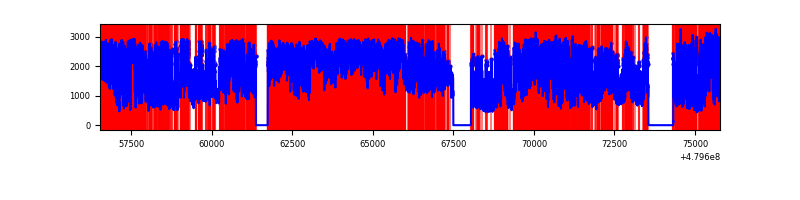 |
| B | 19242 | 17553 | 1196 | 1196 | 6.22% | 6.81% | 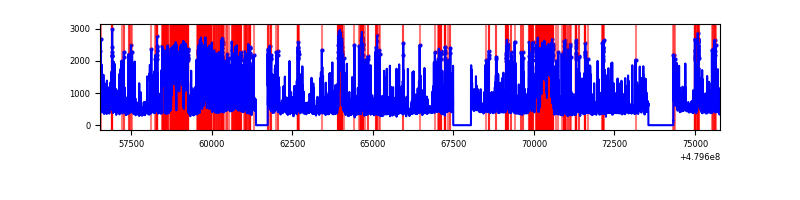 |
| C | 19242 | 17553 | 3000 | 3000 | 15.59% | 17.09% | 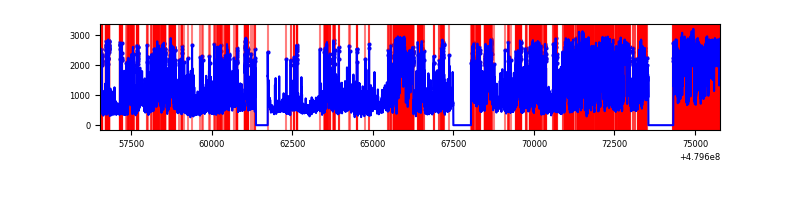 |
| D | 19243 | 17555 | 2485 | 2485 | 12.91% | 14.16% | 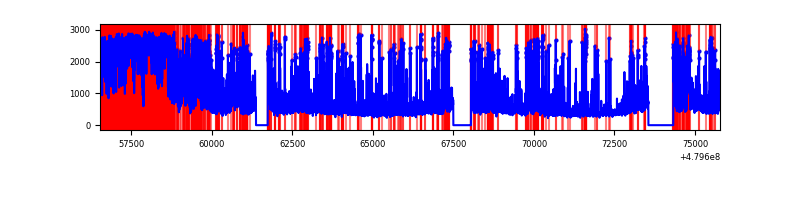 |
Top three noisy pixels from each quadrant. If the there are fewer than three noisy pixels in the level2.evt file, extra rows are filled as -1
| Pixel properties | Quadrant properties | ||||||
|---|---|---|---|---|---|---|---|
| Quadrant | DetID | PixID | Counts | Sigma | Mean | Median | Sigma |
| A | 4 | 207 | 8998261 | 23748.74 | 1510 | 1468 | 378.8 |
| A | 4 | 4 | 7996803 | 21105.2 | 1510 | 1468 | 378.8 |
| A | 14 | 254 | 3961447 | 10453.12 | 1510 | 1468 | 378.8 |
| B | 12 | 32 | 2986675 | 8093.46 | 1739 | 1678 | 368.8 |
| B | 10 | 60 | 955103 | 2585.09 | 1739 | 1678 | 368.8 |
| B | 5 | 185 | 852515 | 2306.94 | 1739 | 1678 | 368.8 |
| C | 12 | 247 | 4880666 | 10452.35 | 1681 | 1670 | 466.8 |
| C | 4 | 12 | 3869224 | 8285.52 | 1681 | 1670 | 466.8 |
| C | 4 | 13 | 887568 | 1897.87 | 1681 | 1670 | 466.8 |
| D | 8 | 176 | 4546204 | 9512.41 | 1696 | 1641 | 477.8 |
| D | 3 | 12 | 1421876 | 2972.75 | 1696 | 1641 | 477.8 |
| D | 7 | 96 | 675580 | 1410.65 | 1696 | 1641 | 477.8 |
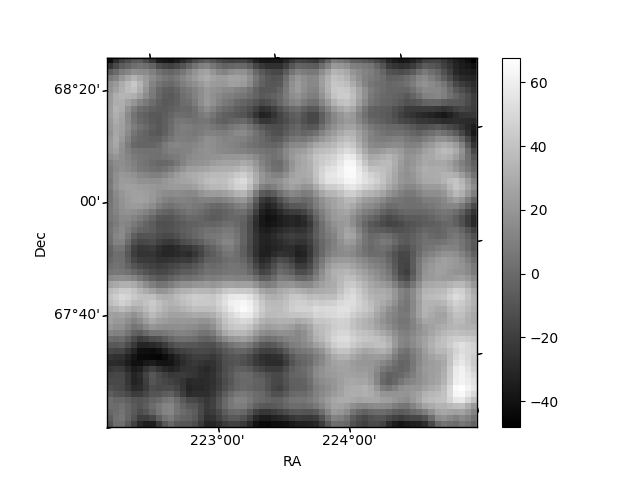
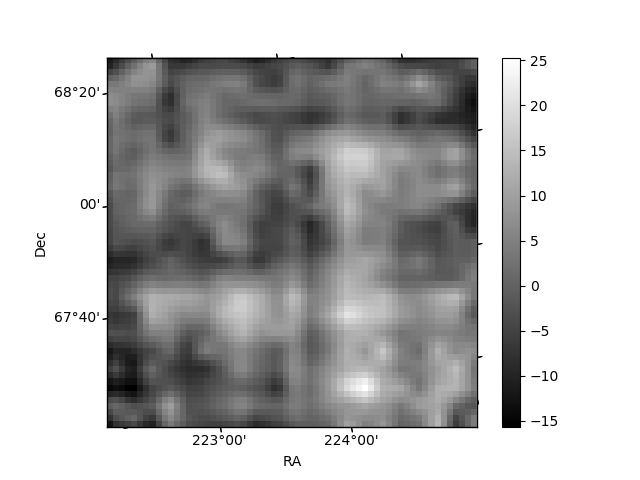
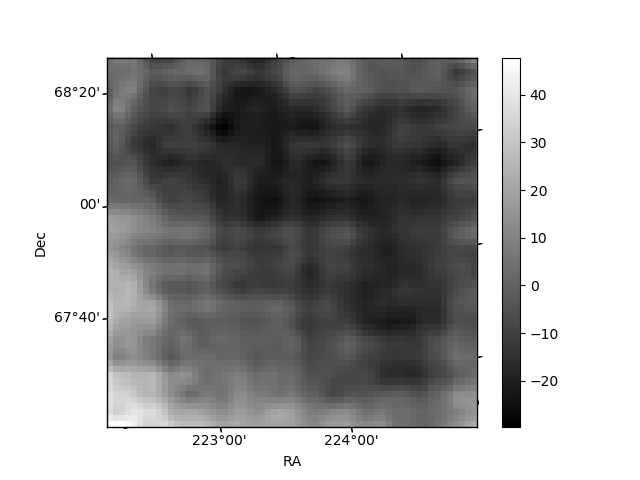
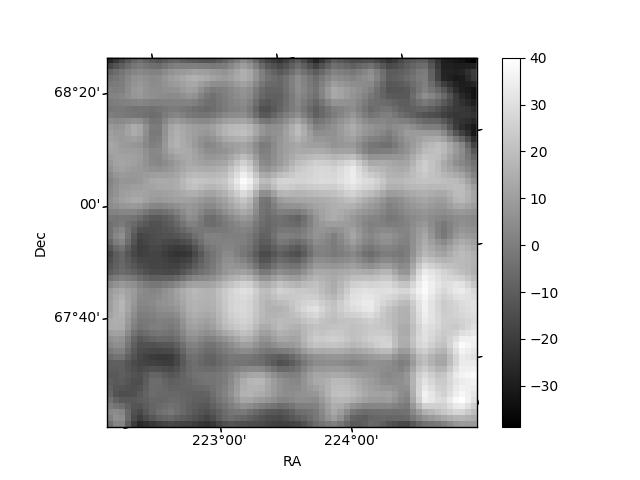
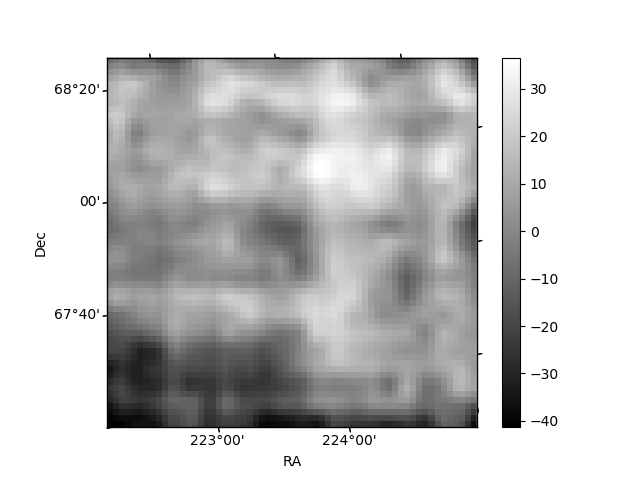
Histogram calculated using DETX and DETY for each event in the final _common_clean file
| Quadrant A | 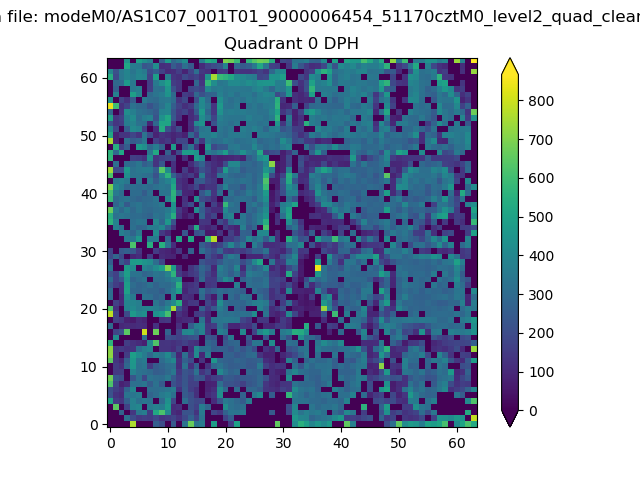 |
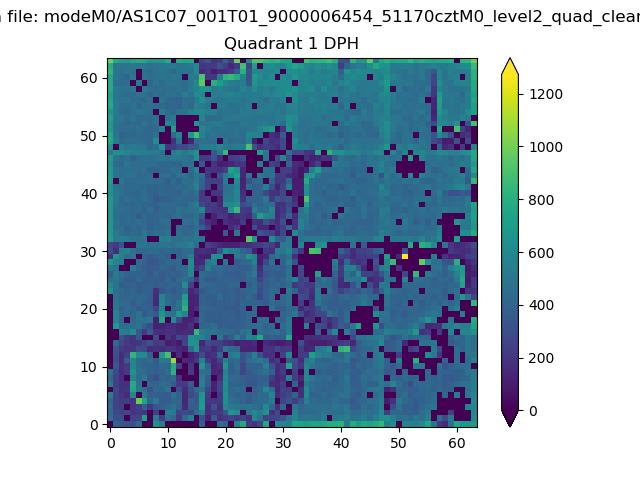 |
Quadrant B |
|---|---|---|---|
| Quadrant D | 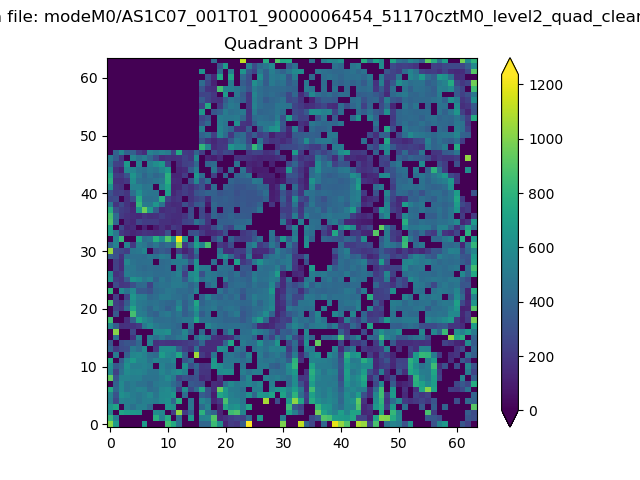 |
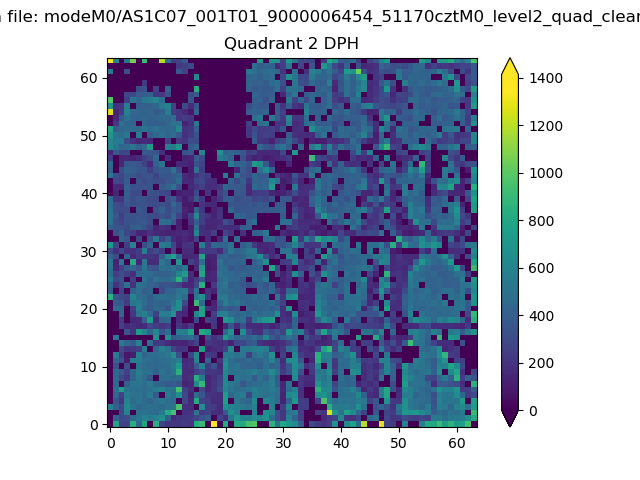 |
Quadrant C |
| Plot type | Count rate plots | Images |
|---|---|---|
| Comparison with Poisson distribution Blue bars denote a histogram of data divided into 1 sec bins. Red curve is a Poisson curve with rate = median count rate of data. |
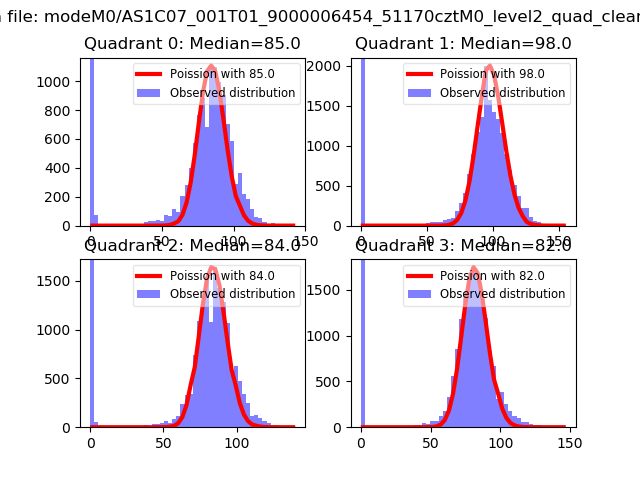 |
 |
| Quadrant-wise count rates Data is divided into 100 sec bins |
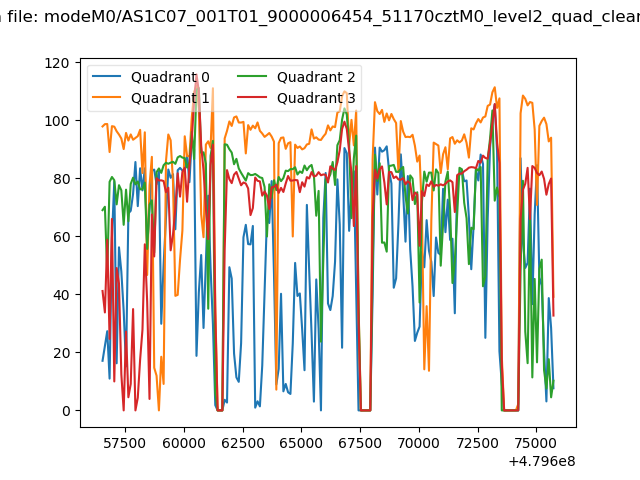 |
|
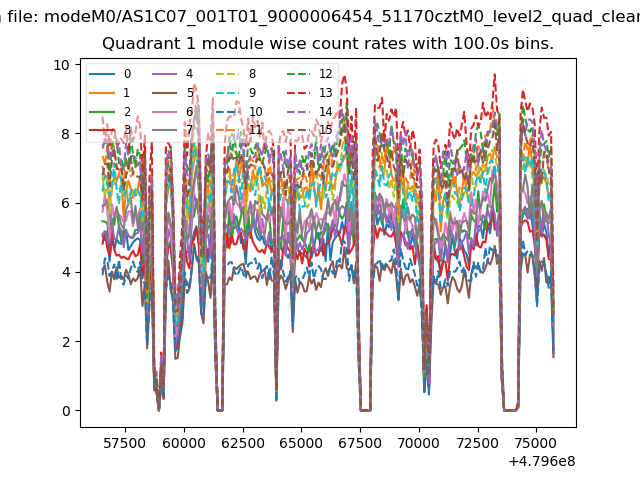
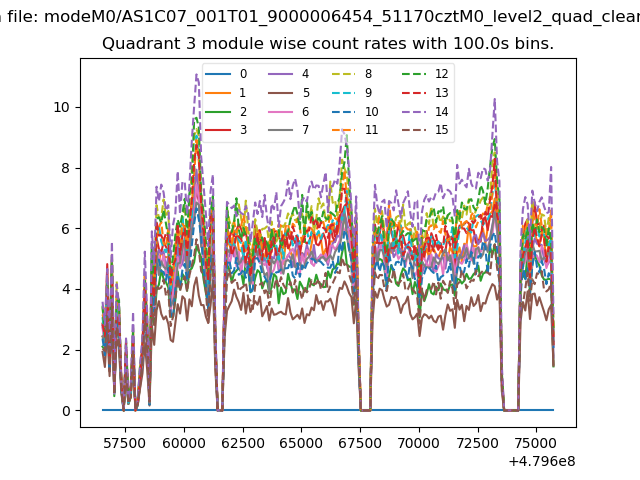
| Module-wise count rates for Quadrant A Data is divided into 100 sec bins |
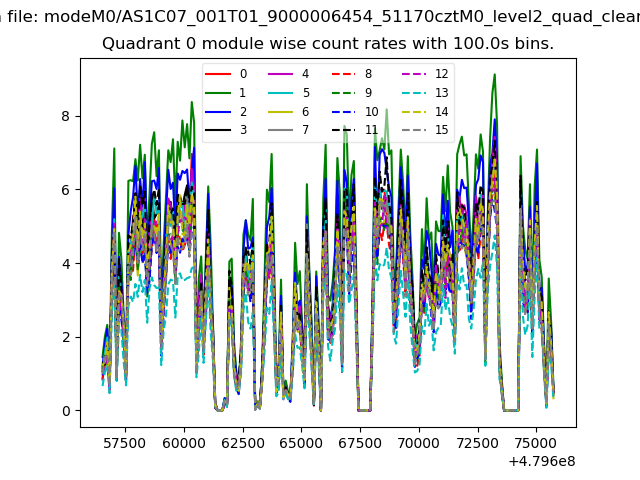 |
 |
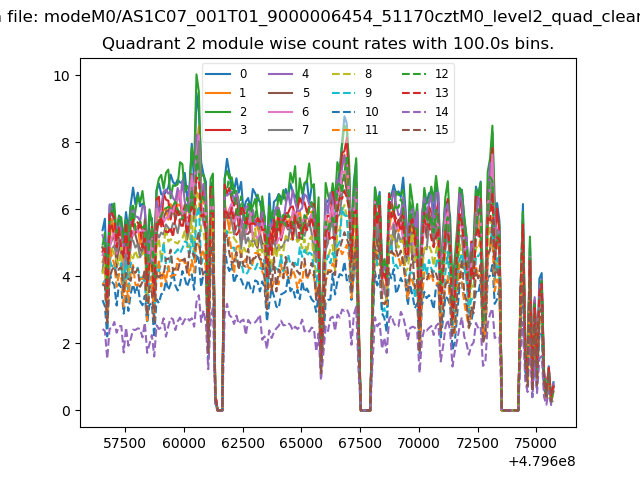
| Module-wise count rates for Quadrant B Data is divided into 100 sec bins |
 |
 |
| Module-wise count rates for Quadrant C Data is divided into 100 sec bins |
 |
 |
| Module-wise count rates for Quadrant D Data is divided into 100 sec bins |
 |
 |
| Parameter | Plot |
|---|---|
| CZT HV Monitor | 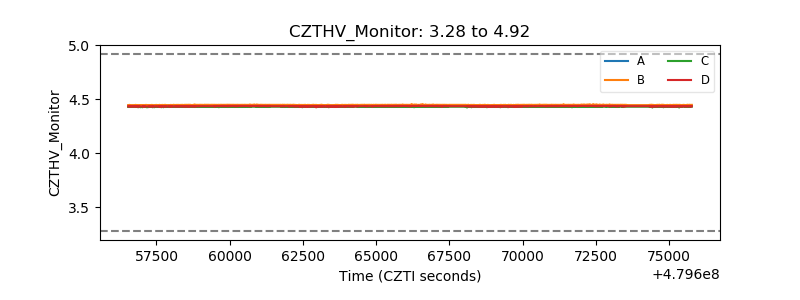 |
| D_VDD | 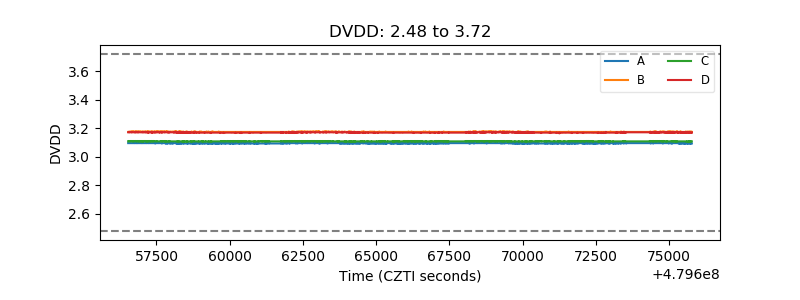 |
| Temperature 1 | 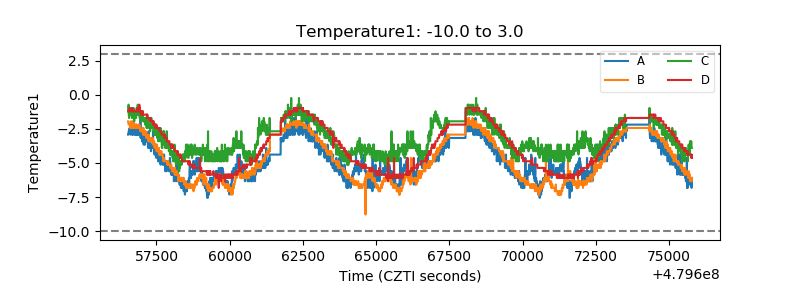 |
| Veto HV Monitor | 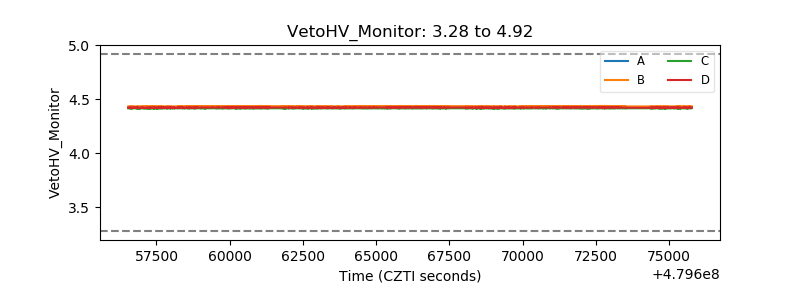 |
| Veto LLD | 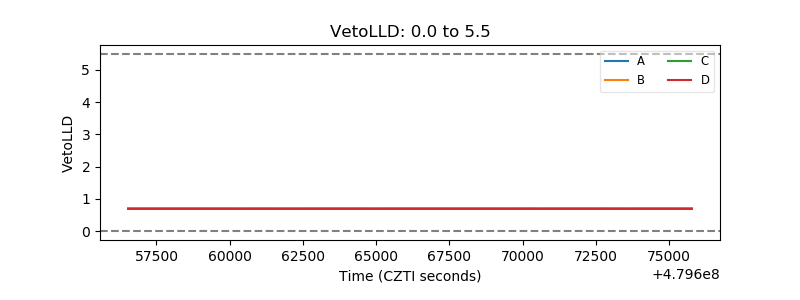 |
| Alpha Counter | 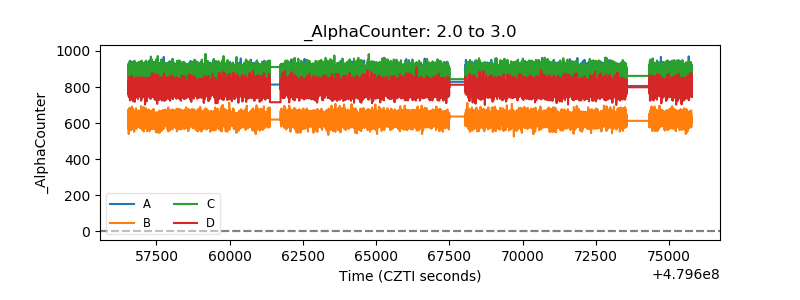 |
| _CPM_Rate | 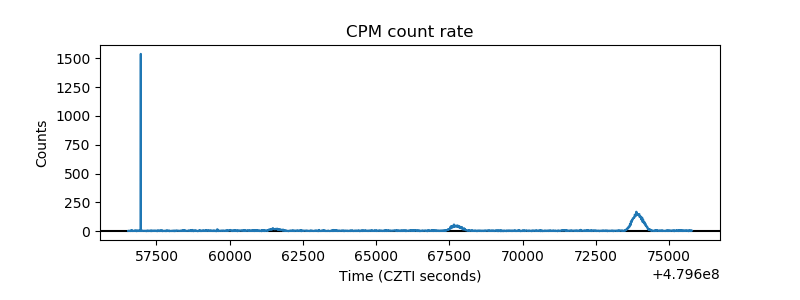 |
| CZT Counter | 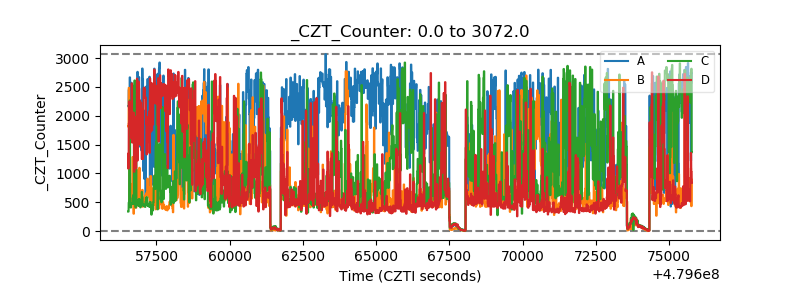 |
| +2.5 Volts monitor | 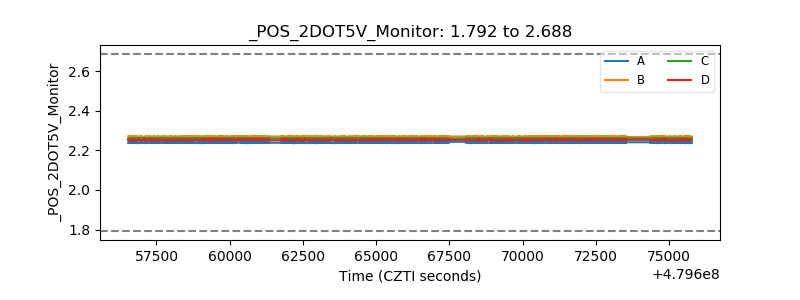 |
| +5 Volts monitor | 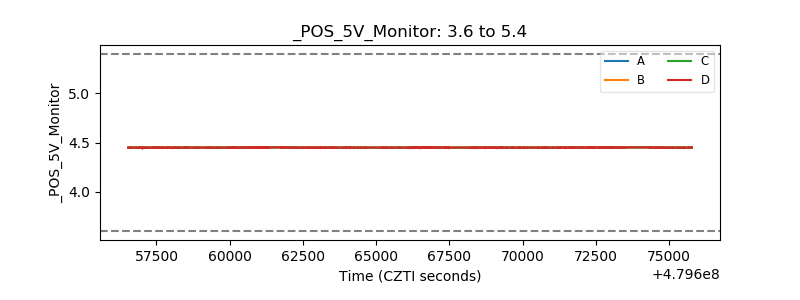 |
| _ROLL_ROT | 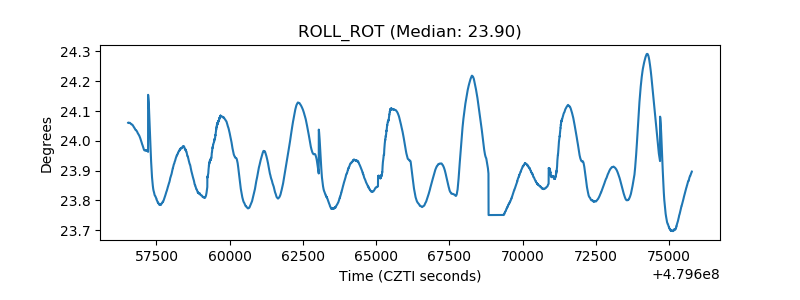 |
| _Roll_DEC | 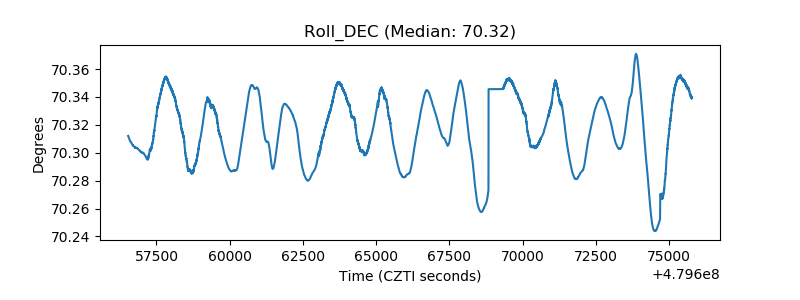 |
| _Roll_RA | 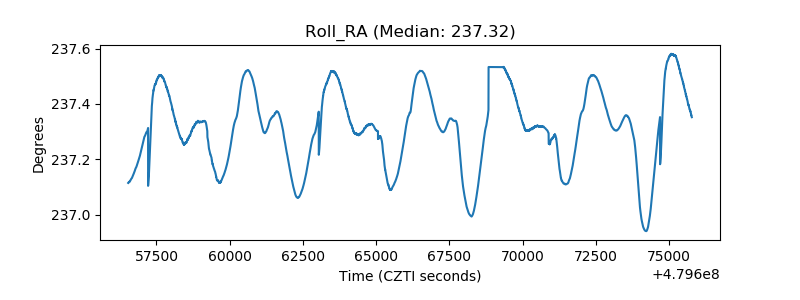 |
| Veto Counter | 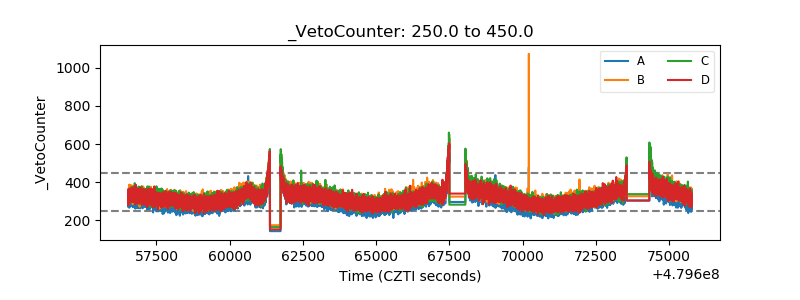 |