| Param | Original file | Final file |
|---|---|---|
| Filename | modeM0/AS1C07_001T01_9000006454_51171cztM0_level2.fits | modeM0/AS1C07_001T01_9000006454_51171cztM0_level2_quad_clean.evt |
| Size (bytes) | 1,068,661,440 | 72,216,000 |
| Size | 1019.2 MB | 68.9 MB |
| Events in quadrant A | 14,300,892 | 253,949 |
| Events in quadrant B | 4,308,720 | 677,552 |
| Events in quadrant C | 15,209,811 | 214,236 |
| Events in quadrant D | 5,210,438 | 562,911 |
| Mode M0 | |||
|---|---|---|---|
| Quadrant | BADHDUFLAG | Total packets | Discarded packets |
| A | 0 | 47201 | 7 |
| B | 0 | 17598 | 2 |
| C | 0 | 49822 | 2 |
| D | 0 | 20374 | 2 |
| Mode SS | |||
|---|---|---|---|
| Quadrant | BADHDUFLAG | Total packets | Discarded packets |
| A | 0 | 140 | 0 |
| B | 0 | 140 | 0 |
| C | 0 | 140 | 0 |
| D | 0 | 140 | 0 |
| Mode M9 | |||
|---|---|---|---|
| Quadrant | BADHDUFLAG | Total packets | Discarded packets |
| A | 0 | 11 | 0 |
| B | 0 | 12 | 0 |
| C | 0 | 12 | 0 |
| D | 0 | 12 | 0 |
| Quadrant | Total seconds | Saturated seconds | Saturation percentage |
|---|---|---|---|
| A | 6850 | 4505 | 65.766423% |
| B | 6850 | 244 | 3.562044% |
| C | 6850 | 4853 | 70.846715% |
| D | 6850 | 458 | 6.686131% |
Noise dominated data is calculated using 1-second bins in cleaned event files. If a bin has >2000 counts, and if more than 50% of those come from <1% of pixels, then it is considered to be noise-dominated and hence unusable.
| Quadrant | # 1 sec bins | Bins with >0 counts | Bins with >2000 counts | High rate bins dominated by noise | Noise dominated (total time) | Noise dominated (detector-on time) | Marked lightcurve |
|---|---|---|---|---|---|---|---|
| A | 7750 | 6851 | 4370 | 4370 | 56.39% | 63.79% | 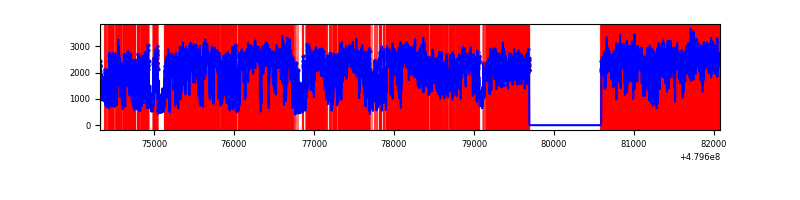 |
| B | 7750 | 6851 | 144 | 144 | 1.86% | 2.10% | 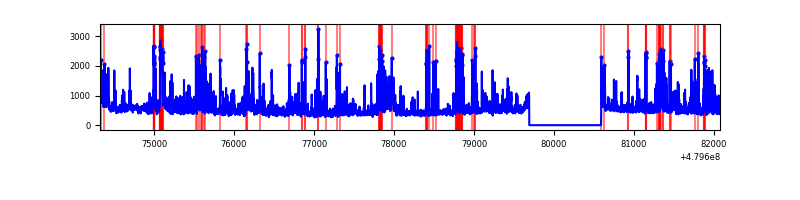 |
| C | 7750 | 6851 | 4862 | 4862 | 62.74% | 70.97% | 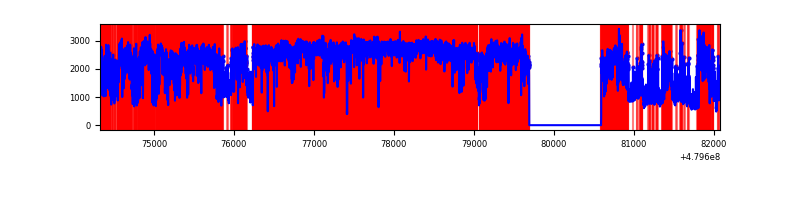 |
| D | 7750 | 6851 | 377 | 377 | 4.86% | 5.50% | 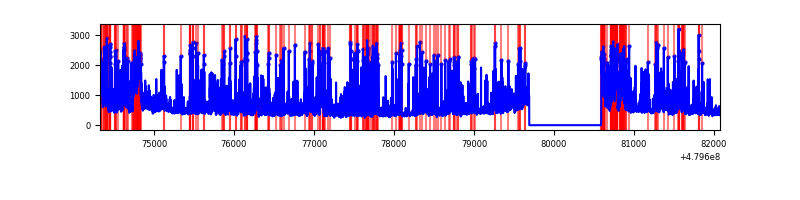 |
Top three noisy pixels from each quadrant. If the there are fewer than three noisy pixels in the level2.evt file, extra rows are filled as -1
| Pixel properties | Quadrant properties | ||||||
|---|---|---|---|---|---|---|---|
| Quadrant | DetID | PixID | Counts | Sigma | Mean | Median | Sigma |
| A | 4 | 207 | 6986719 | 56512.67 | 486 | 472 | 123.6 |
| A | 14 | 254 | 2124500 | 17181.54 | 486 | 472 | 123.6 |
| A | 12 | 80 | 1348605 | 10905.22 | 486 | 472 | 123.6 |
| B | 5 | 185 | 441668 | 2895.81 | 707 | 682 | 152.3 |
| B | 8 | 128 | 257361 | 1685.52 | 707 | 682 | 152.3 |
| B | 10 | 60 | 155742 | 1018.23 | 707 | 682 | 152.3 |
| C | 12 | 247 | 9179105 | 68731.86 | 486 | 481 | 133.5 |
| C | 4 | 12 | 3245144 | 24296.86 | 486 | 481 | 133.5 |
| C | 13 | 3 | 200833 | 1500.29 | 486 | 481 | 133.5 |
| D | 7 | 96 | 485911 | 2549.22 | 681 | 659 | 190.4 |
| D | 3 | 12 | 329121 | 1725.54 | 681 | 659 | 190.4 |
| D | 8 | 176 | 322397 | 1690.21 | 681 | 659 | 190.4 |
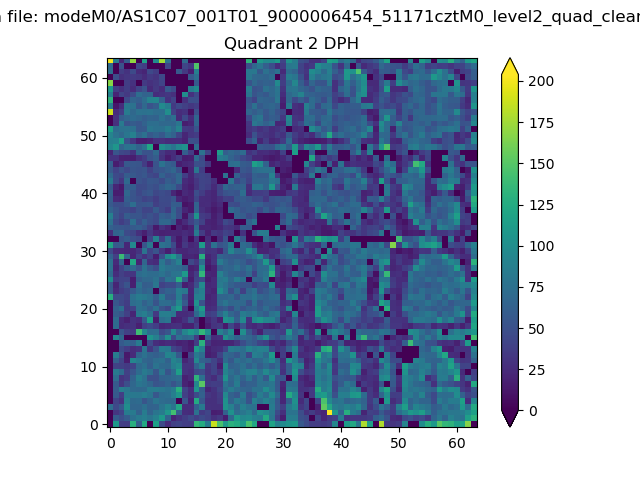
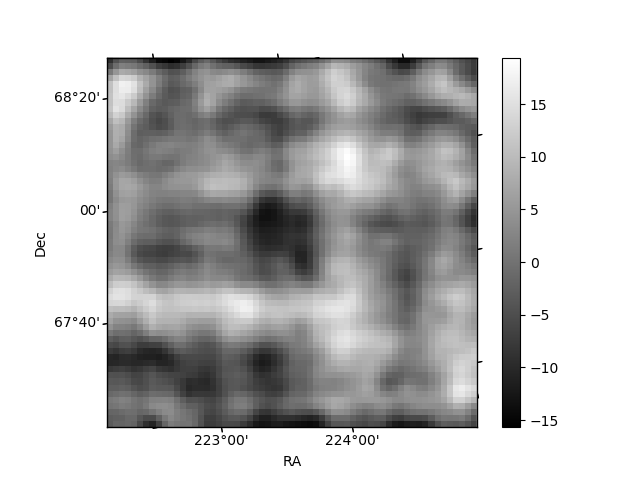
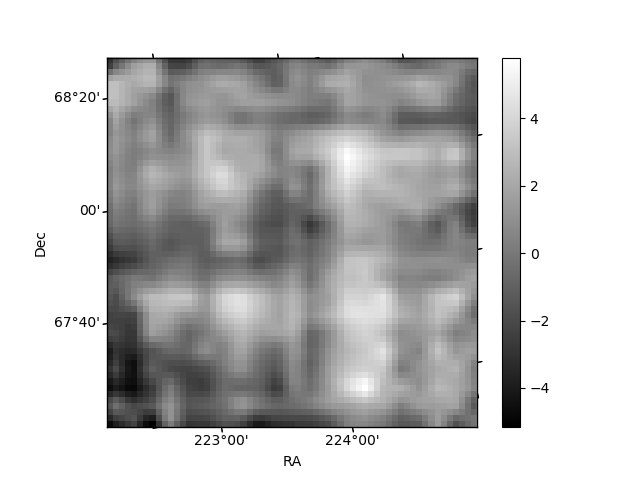
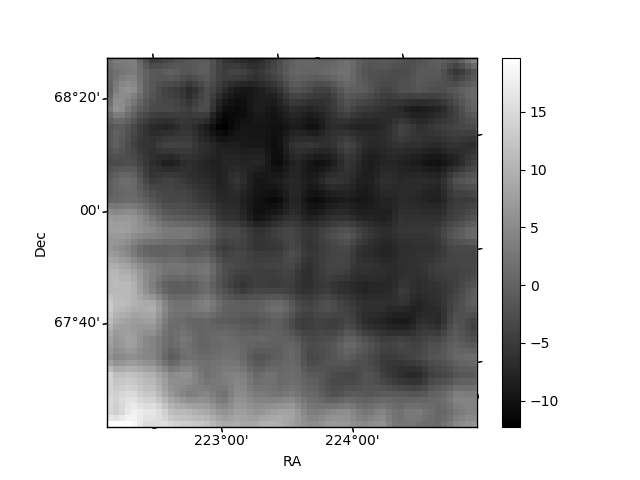
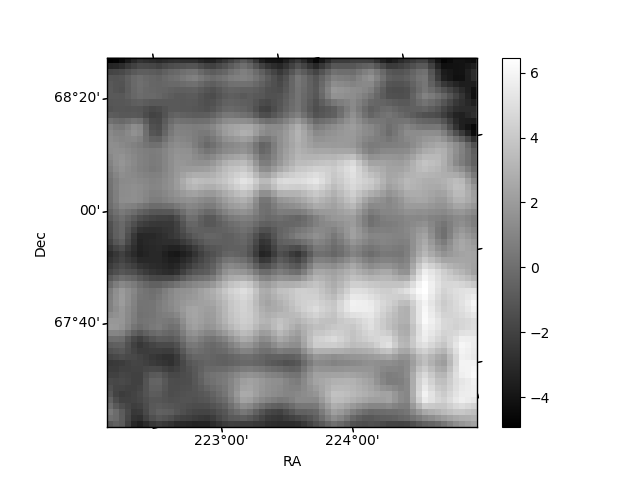
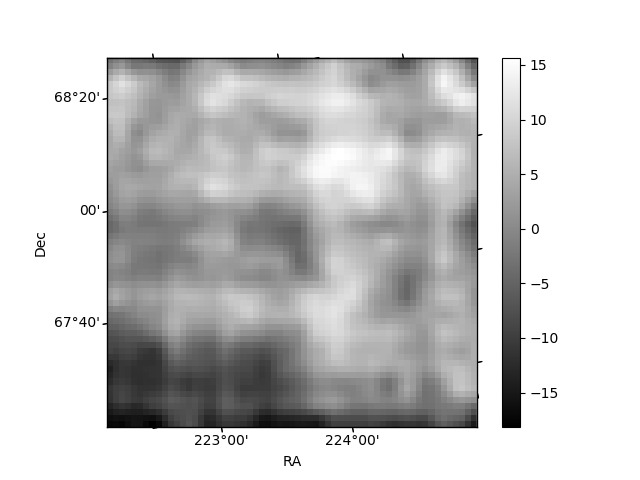
Histogram calculated using DETX and DETY for each event in the final _common_clean file
| Quadrant A | 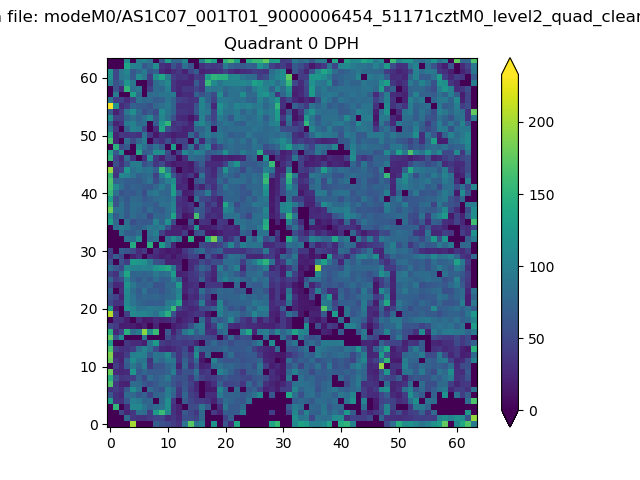 |
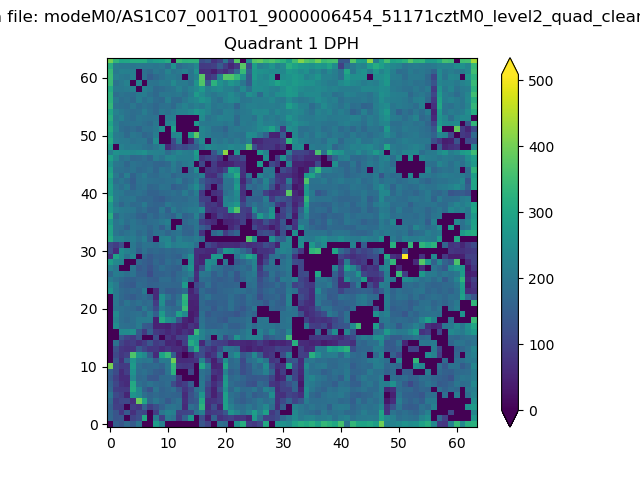 |
Quadrant B |
|---|---|---|---|
| Quadrant D | 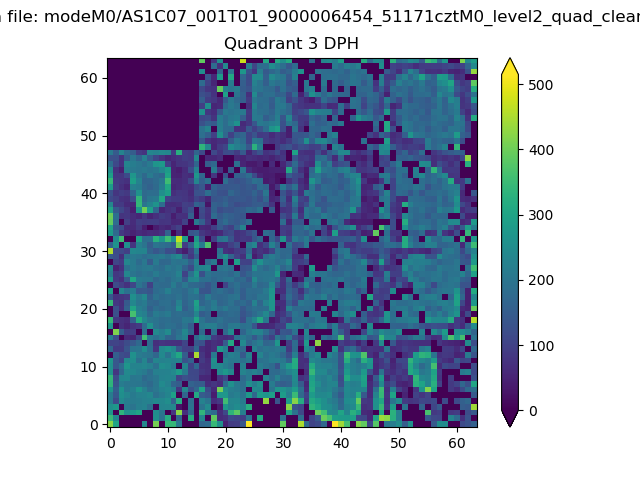 |
 |
Quadrant C |
| Plot type | Count rate plots | Images |
|---|---|---|
| Comparison with Poisson distribution Blue bars denote a histogram of data divided into 1 sec bins. Red curve is a Poisson curve with rate = median count rate of data. |
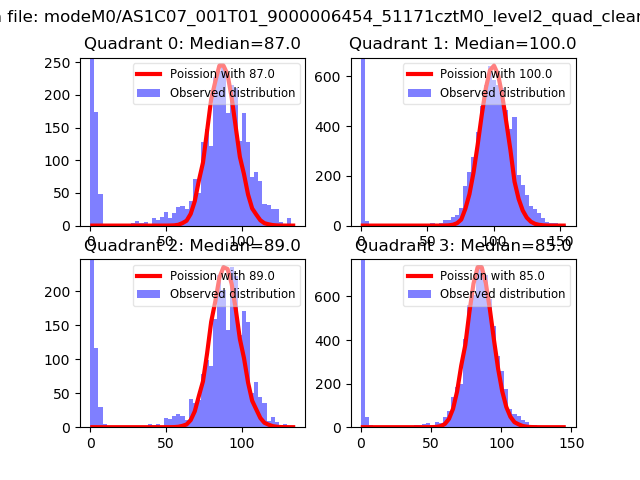 |
 |
| Quadrant-wise count rates Data is divided into 100 sec bins |
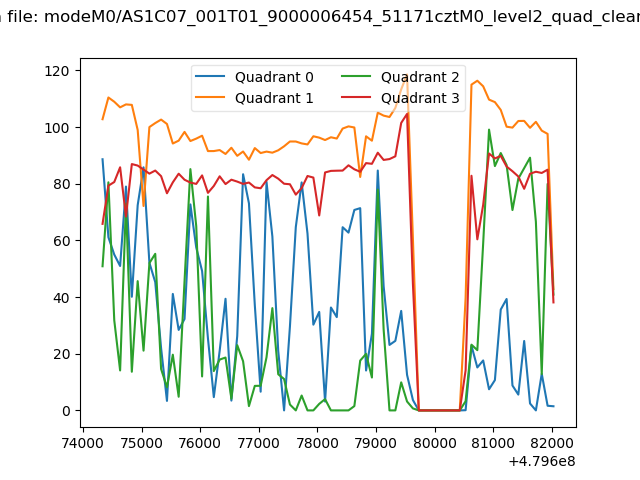 |
|
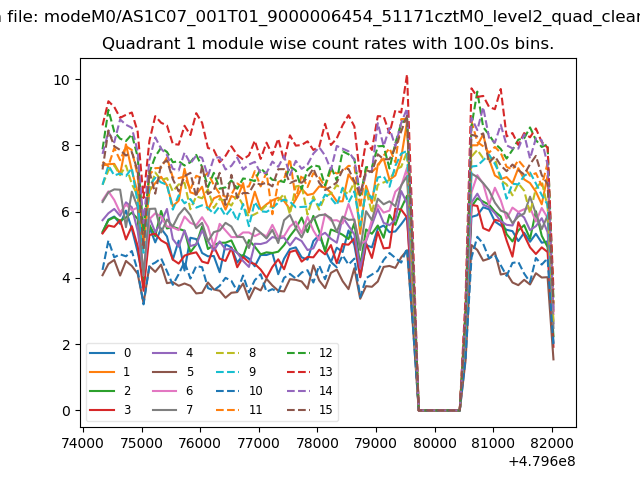
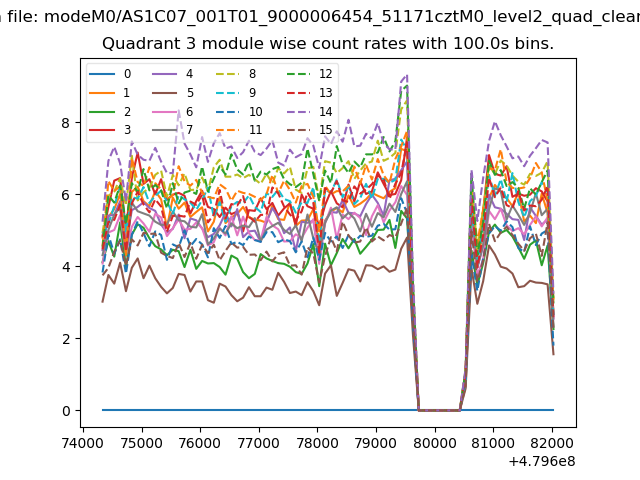
| Module-wise count rates for Quadrant A Data is divided into 100 sec bins |
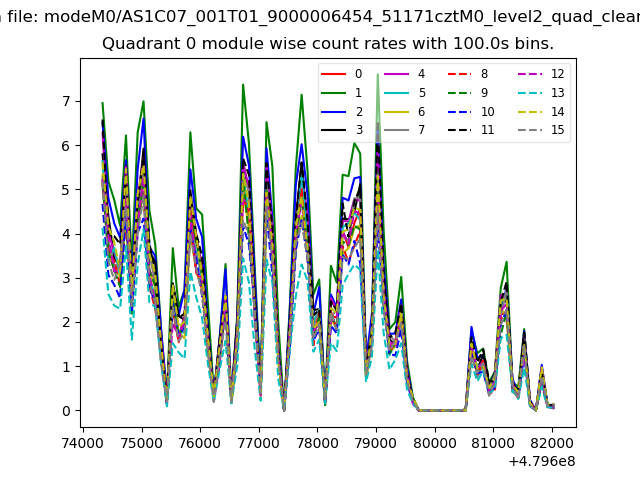 |
 |
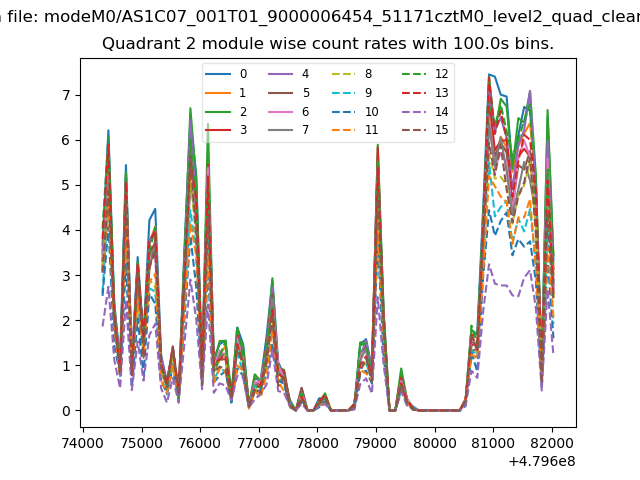
| Module-wise count rates for Quadrant B Data is divided into 100 sec bins |
 |
 |
| Module-wise count rates for Quadrant C Data is divided into 100 sec bins |
 |
 |
| Module-wise count rates for Quadrant D Data is divided into 100 sec bins |
 |
 |
| Parameter | Plot |
|---|---|
| CZT HV Monitor | 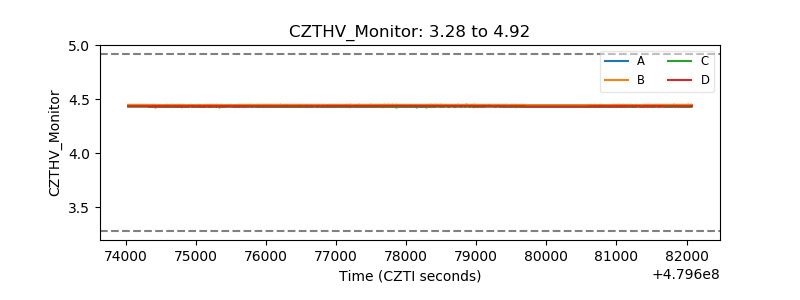 |
| D_VDD | 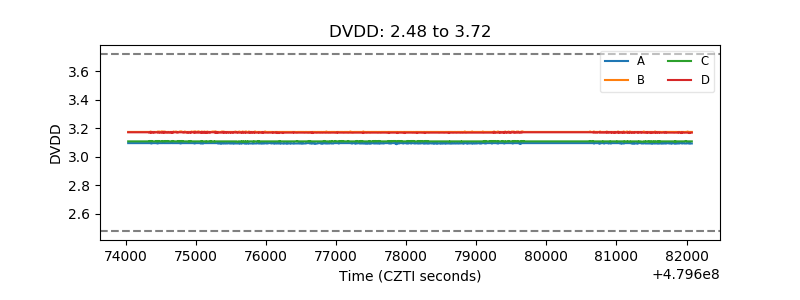 |
| Temperature 1 | 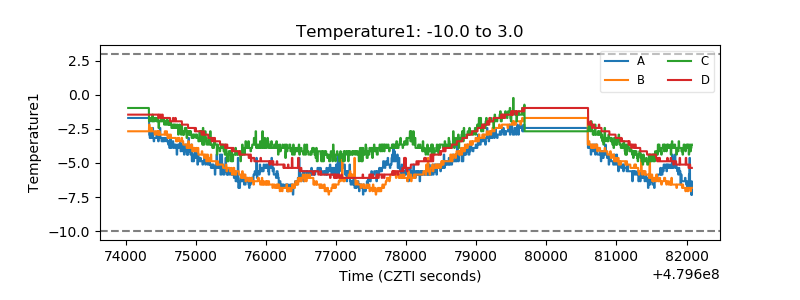 |
| Veto HV Monitor | 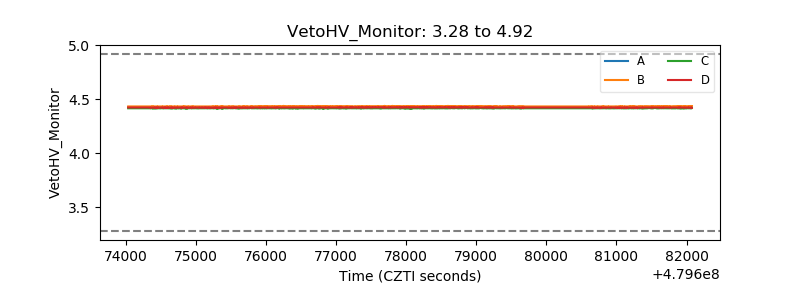 |
| Veto LLD | 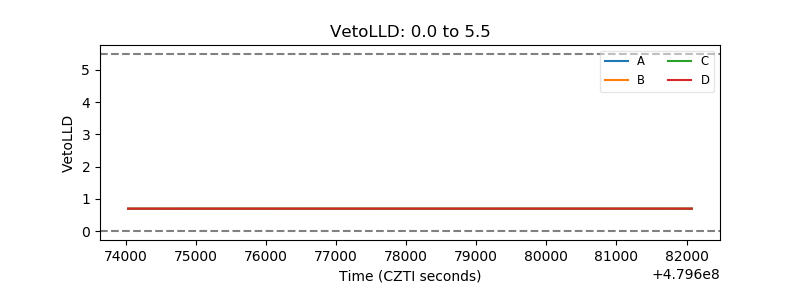 |
| Alpha Counter | 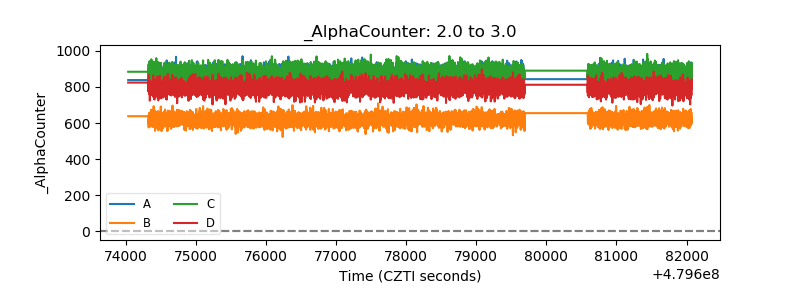 |
| _CPM_Rate | 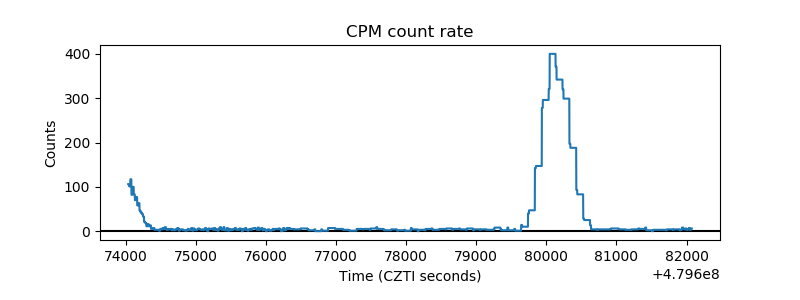 |
| CZT Counter | 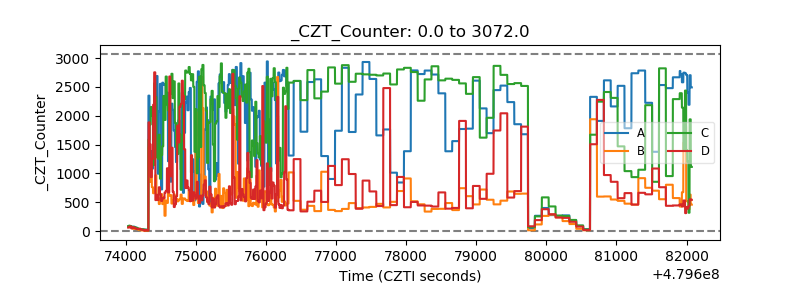 |
| +2.5 Volts monitor | 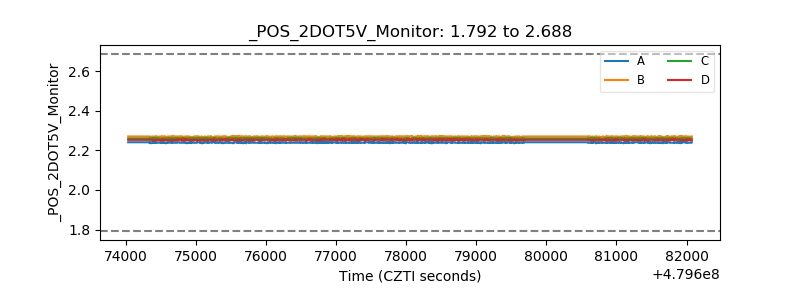 |
| +5 Volts monitor | 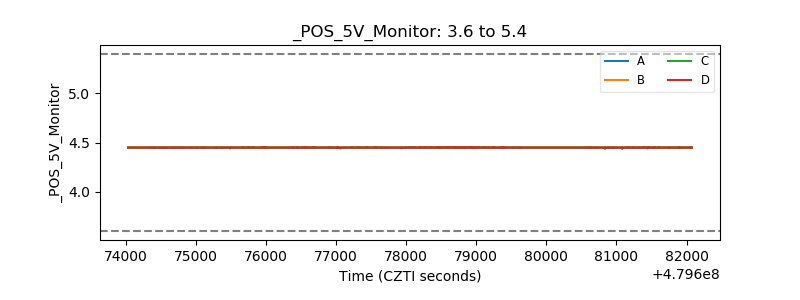 |
| _ROLL_ROT | 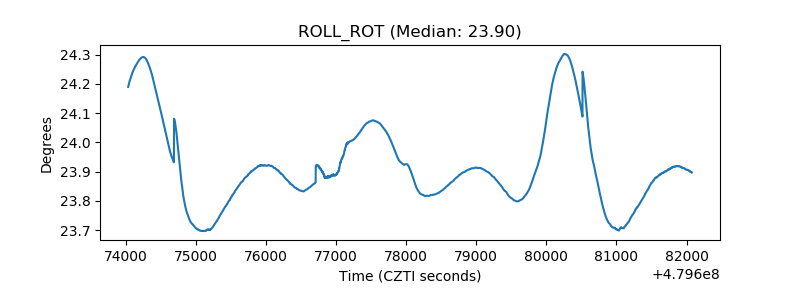 |
| _Roll_DEC | 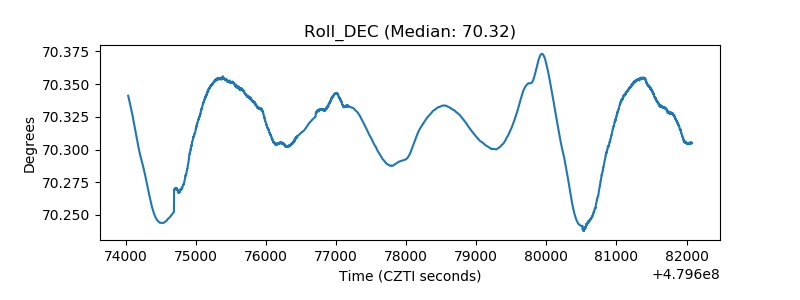 |
| _Roll_RA | 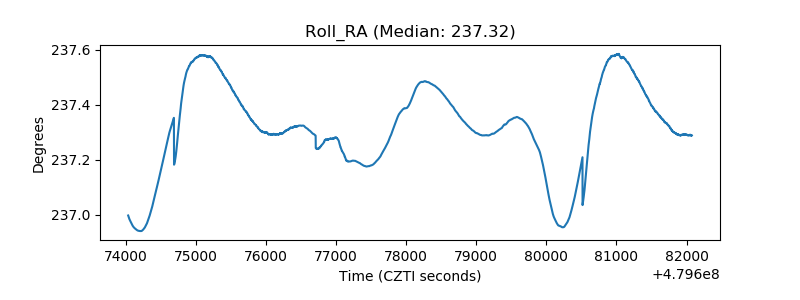 |
| Veto Counter | 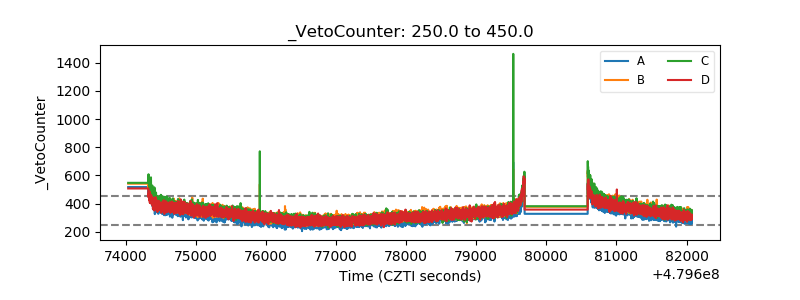 |