| Param | Original file | Final file |
|---|---|---|
| Filename | modeM0/AS1C07_001T01_9000006454_51173cztM0_level2.fits | modeM0/AS1C07_001T01_9000006454_51173cztM0_level2_quad_clean.evt |
| Size (bytes) | 891,204,480 | 76,573,440 |
| Size | 849.9 MB | 73.0 MB |
| Events in quadrant A | 12,049,322 | 308,255 |
| Events in quadrant B | 4,349,077 | 634,358 |
| Events in quadrant C | 11,196,405 | 402,404 |
| Events in quadrant D | 4,900,979 | 527,174 |
| Mode M0 | |||
|---|---|---|---|
| Quadrant | BADHDUFLAG | Total packets | Discarded packets |
| A | 0 | 40136 | 2 |
| B | 0 | 17468 | 2 |
| C | 0 | 37734 | 4 |
| D | 0 | 19200 | 2 |
| Mode SS | |||
|---|---|---|---|
| Quadrant | BADHDUFLAG | Total packets | Discarded packets |
| A | 0 | 130 | 0 |
| B | 0 | 130 | 0 |
| C | 0 | 130 | 0 |
| D | 0 | 130 | 0 |
| Mode M9 | |||
|---|---|---|---|
| Quadrant | BADHDUFLAG | Total packets | Discarded packets |
| A | 0 | 10 | 0 |
| B | 0 | 10 | 0 |
| C | 0 | 10 | 0 |
| D | 0 | 10 | 0 |
| Quadrant | Total seconds | Saturated seconds | Saturation percentage |
|---|---|---|---|
| A | 6392 | 3555 | 55.616395% |
| B | 6393 | 324 | 5.068043% |
| C | 6392 | 2319 | 36.279725% |
| D | 6392 | 439 | 6.867960% |
Noise dominated data is calculated using 1-second bins in cleaned event files. If a bin has >2000 counts, and if more than 50% of those come from <1% of pixels, then it is considered to be noise-dominated and hence unusable.
| Quadrant | # 1 sec bins | Bins with >0 counts | Bins with >2000 counts | High rate bins dominated by noise | Noise dominated (total time) | Noise dominated (detector-on time) | Marked lightcurve |
|---|---|---|---|---|---|---|---|
| A | 7437 | 6393 | 3454 | 3454 | 46.44% | 54.03% | 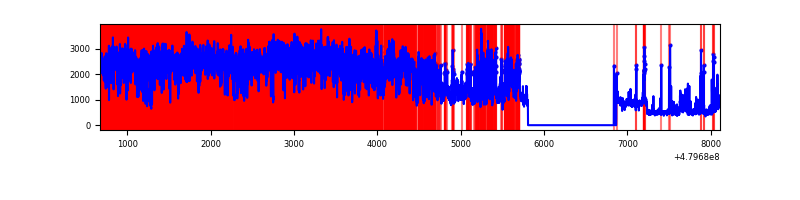 |
| B | 7438 | 6394 | 192 | 192 | 2.58% | 3.00% | 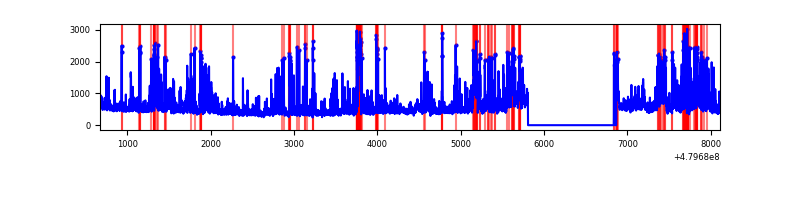 |
| C | 7437 | 6393 | 2494 | 2494 | 33.54% | 39.01% | 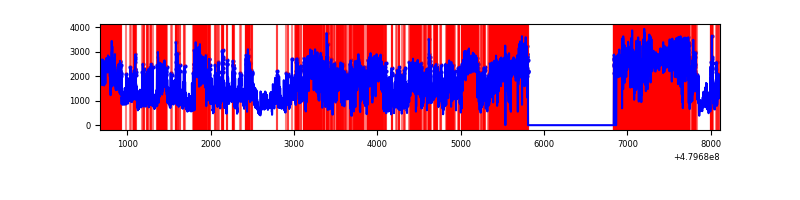 |
| D | 7437 | 6393 | 447 | 447 | 6.01% | 6.99% | 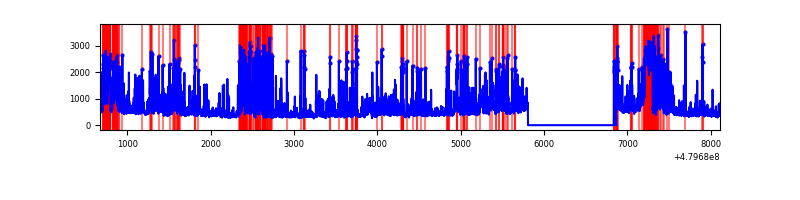 |
Top three noisy pixels from each quadrant. If the there are fewer than three noisy pixels in the level2.evt file, extra rows are filled as -1
| Pixel properties | Quadrant properties | ||||||
|---|---|---|---|---|---|---|---|
| Quadrant | DetID | PixID | Counts | Sigma | Mean | Median | Sigma |
| A | 4 | 207 | 6027415 | 49558.71 | 485 | 471 | 121.6 |
| A | 4 | 4 | 1420510 | 11676.78 | 485 | 471 | 121.6 |
| A | 12 | 3 | 791840 | 6507.32 | 485 | 471 | 121.6 |
| B | 8 | 128 | 630862 | 4552.13 | 653 | 630 | 138.4 |
| B | 5 | 185 | 304777 | 2196.84 | 653 | 630 | 138.4 |
| B | 0 | 171 | 150702 | 1083.96 | 653 | 630 | 138.4 |
| C | 12 | 247 | 5098263 | 35230.91 | 520 | 513 | 144.7 |
| C | 4 | 12 | 3155328 | 21803.15 | 520 | 513 | 144.7 |
| C | 13 | 3 | 285321 | 1968.33 | 520 | 513 | 144.7 |
| D | 7 | 96 | 579565 | 3316.11 | 623 | 602 | 174.6 |
| D | 2 | 62 | 358032 | 2047.24 | 623 | 602 | 174.6 |
| D | 2 | 216 | 262655 | 1500.95 | 623 | 602 | 174.6 |
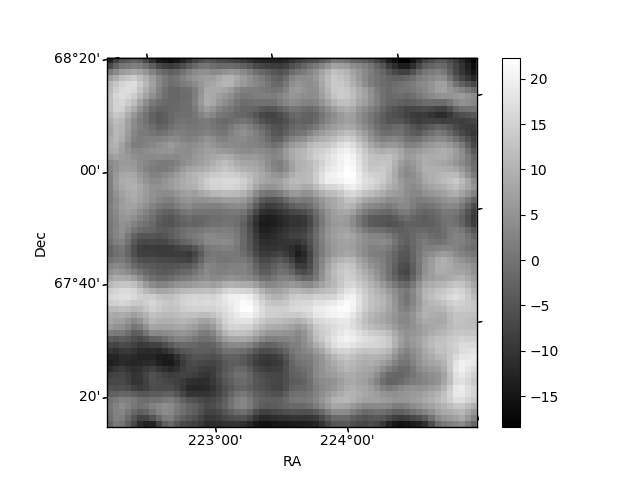
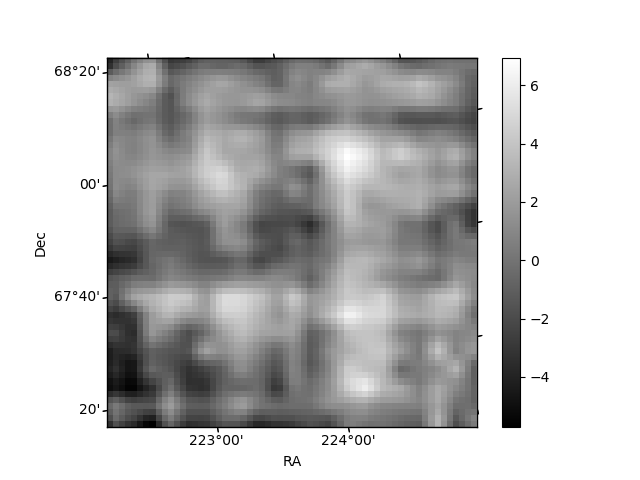
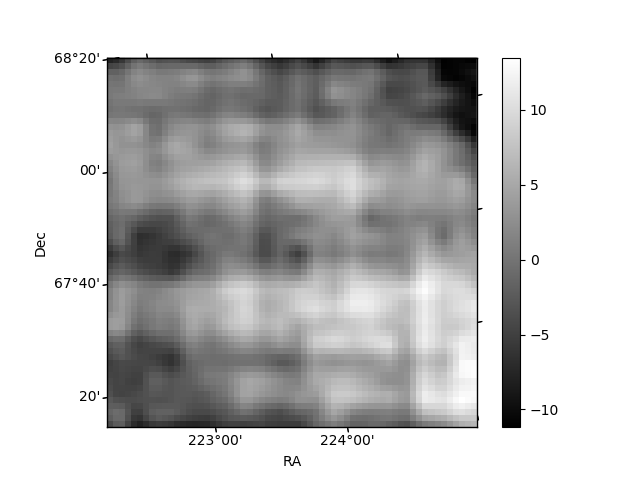
Histogram calculated using DETX and DETY for each event in the final _common_clean file
| Quadrant A | 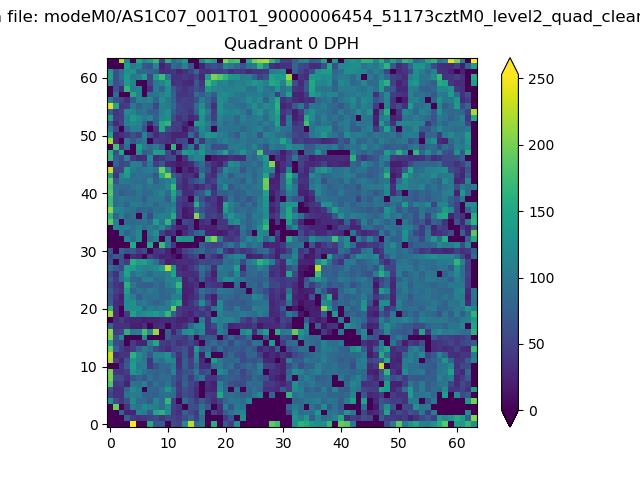 |
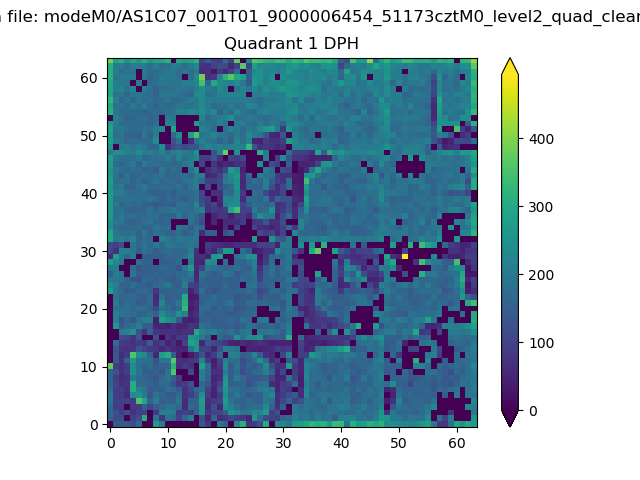 |
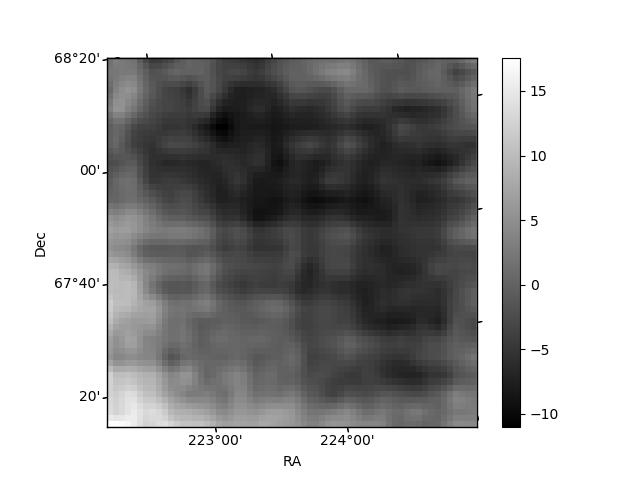
Quadrant B |
|---|---|---|---|
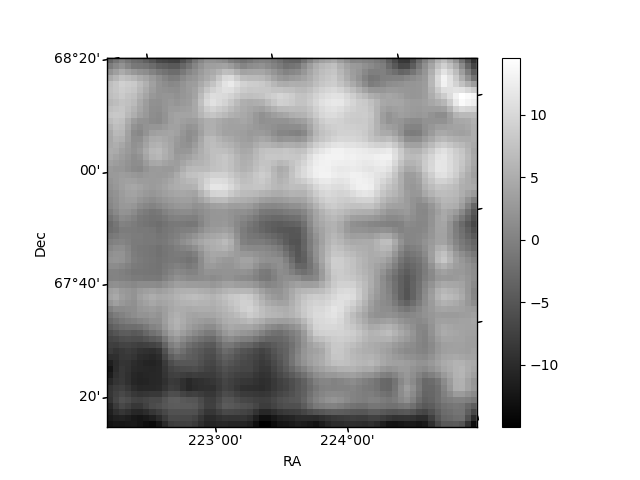
| Quadrant D | 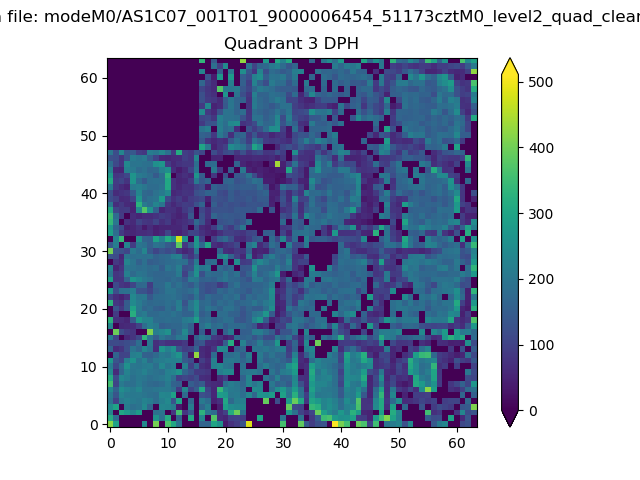 |
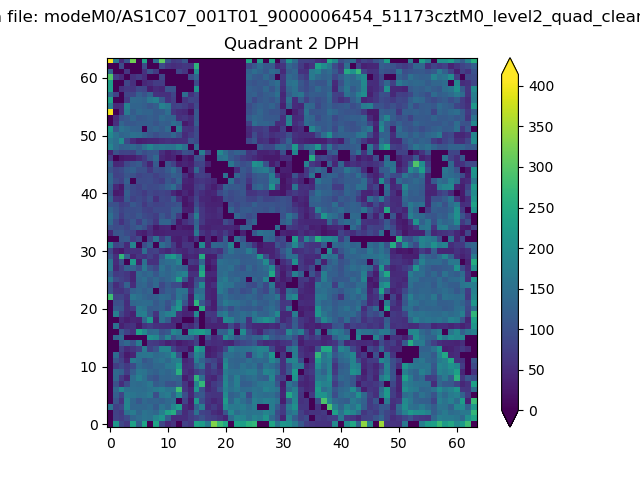 |
Quadrant C |
| Plot type | Count rate plots | Images |
|---|---|---|
| Comparison with Poisson distribution Blue bars denote a histogram of data divided into 1 sec bins. Red curve is a Poisson curve with rate = median count rate of data. |
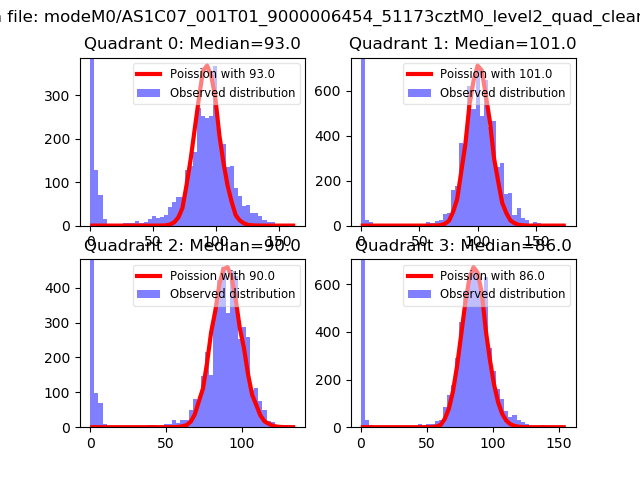 |
 |
| Quadrant-wise count rates Data is divided into 100 sec bins |
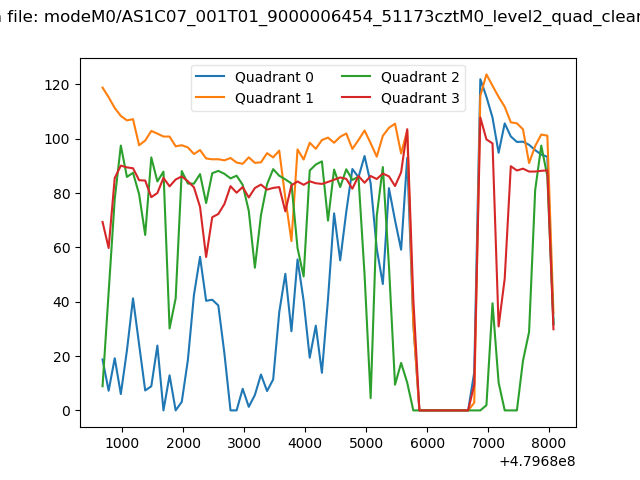 |
|
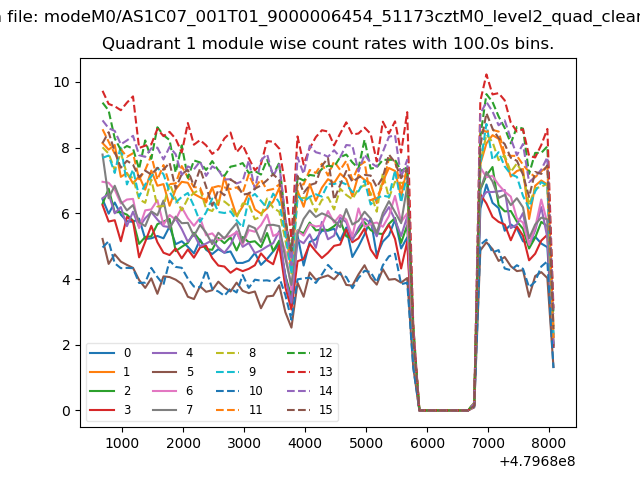
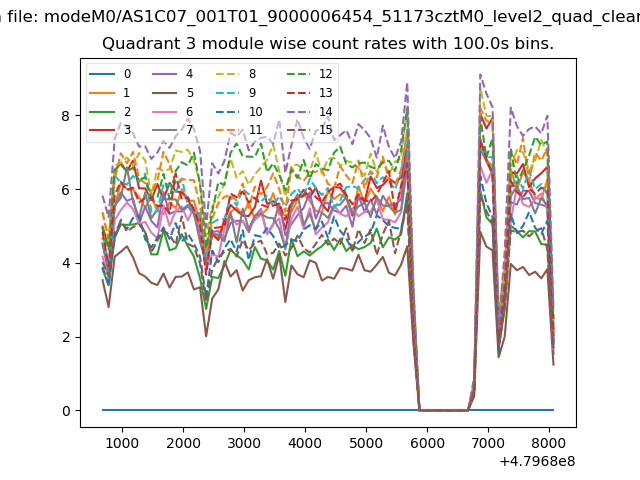
| Module-wise count rates for Quadrant A Data is divided into 100 sec bins |
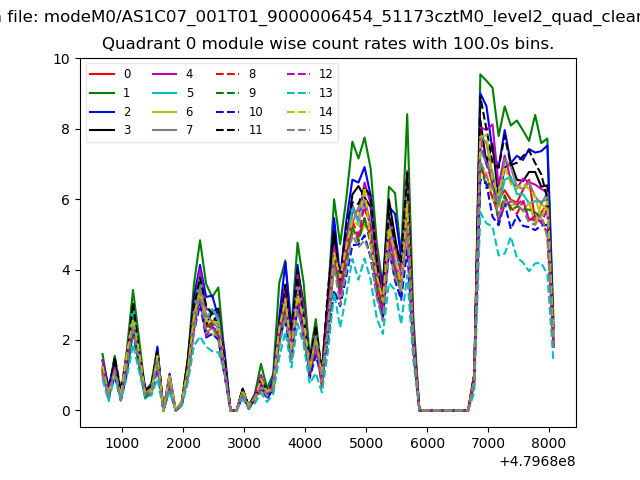 |
 |
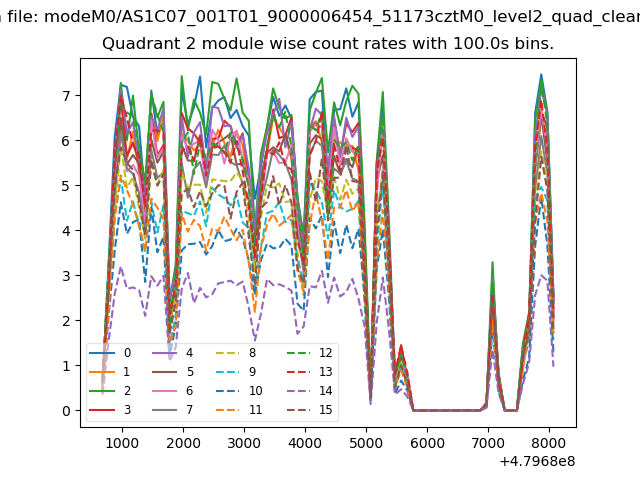
| Module-wise count rates for Quadrant B Data is divided into 100 sec bins |
 |
 |
| Module-wise count rates for Quadrant C Data is divided into 100 sec bins |
 |
 |
| Module-wise count rates for Quadrant D Data is divided into 100 sec bins |
 |
 |
| Parameter | Plot |
|---|---|
| CZT HV Monitor | 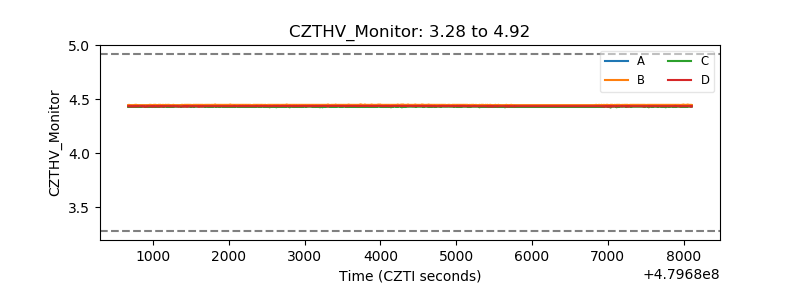 |
| D_VDD |  |
| Temperature 1 | 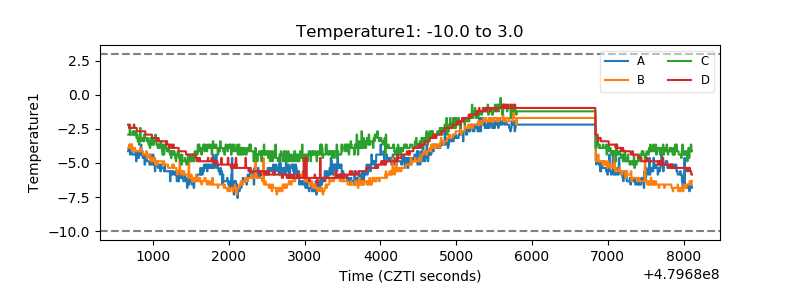 |
| Veto HV Monitor |  |
| Veto LLD | 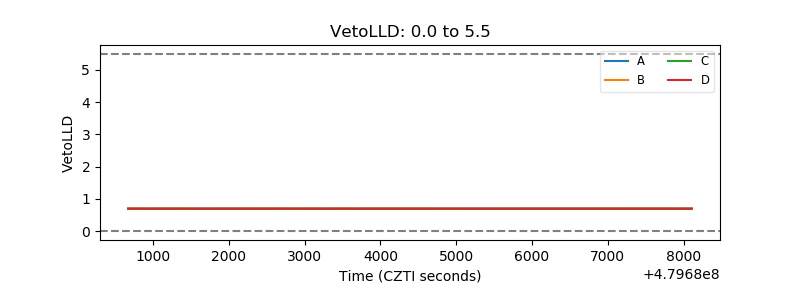 |
| Alpha Counter | 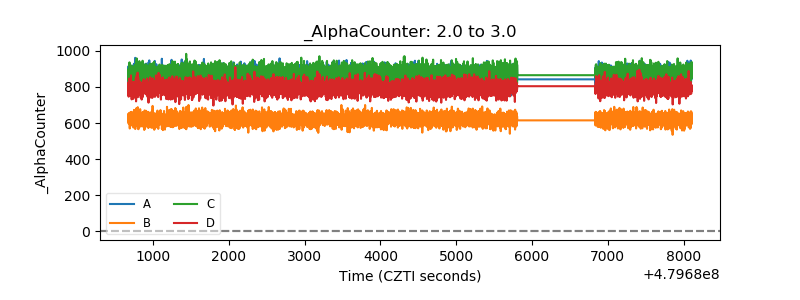 |
| _CPM_Rate | 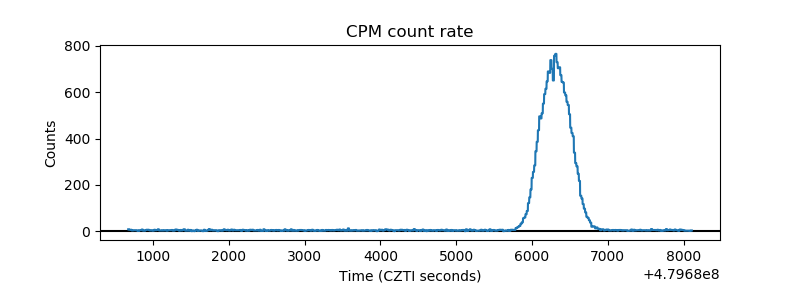 |
| CZT Counter | 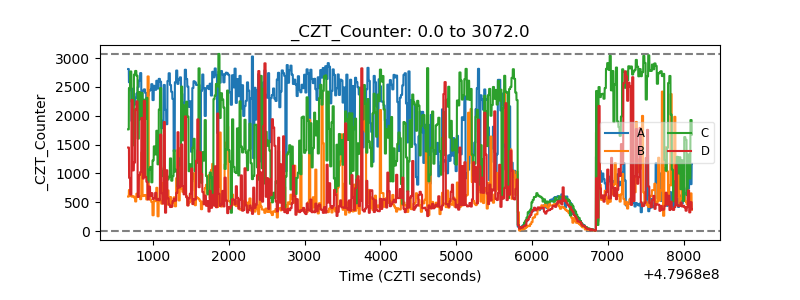 |
| +2.5 Volts monitor | 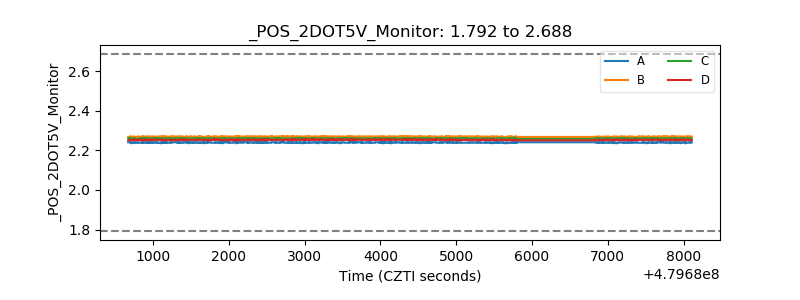 |
| +5 Volts monitor | 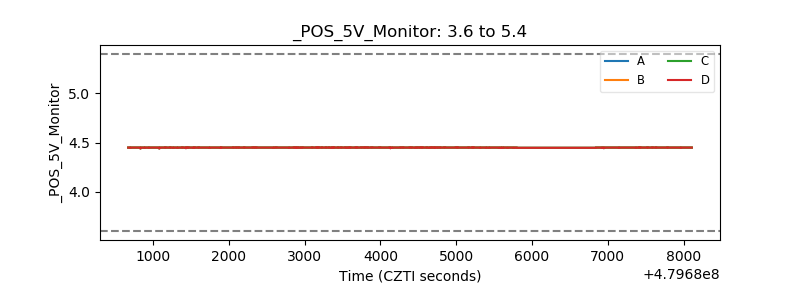 |
| _ROLL_ROT | 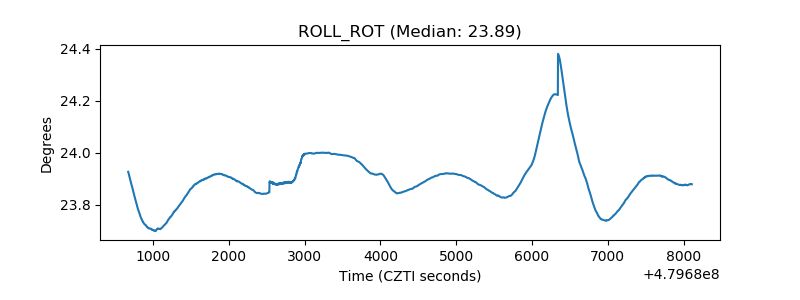 |
| _Roll_DEC | 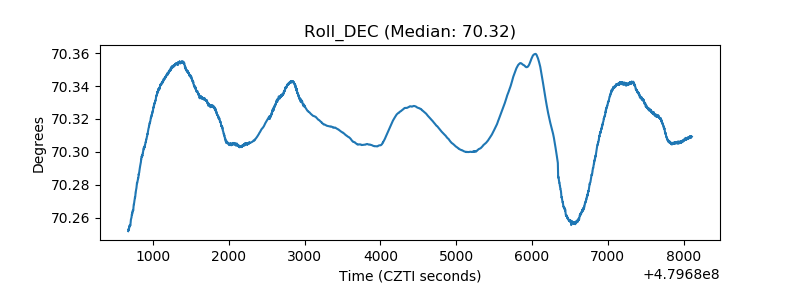 |
| _Roll_RA | 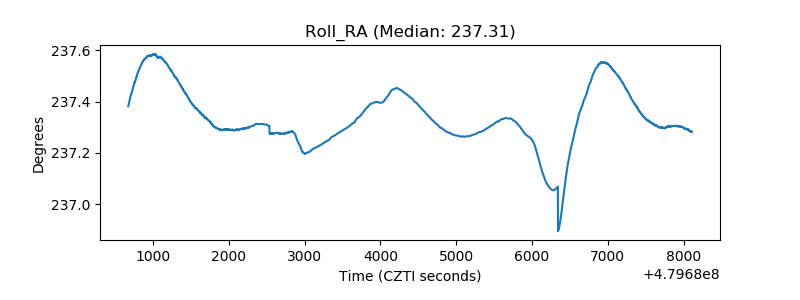 |
| Veto Counter | 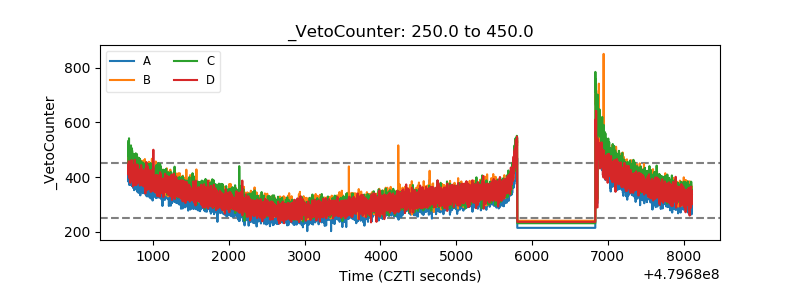 |