| Param | Original file | Final file |
|---|---|---|
| Filename | modeM0/AS1C07_001T01_9000006454_51174cztM0_level2.fits | modeM0/AS1C07_001T01_9000006454_51174cztM0_level2_quad_clean.evt |
| Size (bytes) | 693,815,040 | 88,634,880 |
| Size | 661.7 MB | 84.5 MB |
| Events in quadrant A | 5,781,220 | 590,859 |
| Events in quadrant B | 4,230,772 | 653,393 |
| Events in quadrant C | 10,900,542 | 452,070 |
| Events in quadrant D | 4,278,198 | 542,593 |
| Mode M0 | |||
|---|---|---|---|
| Quadrant | BADHDUFLAG | Total packets | Discarded packets |
| A | 0 | 21560 | 2 |
| B | 0 | 17177 | 2 |
| C | 0 | 36828 | 2 |
| D | 0 | 17409 | 2 |
| Mode SS | |||
|---|---|---|---|
| Quadrant | BADHDUFLAG | Total packets | Discarded packets |
| A | 0 | 130 | 0 |
| B | 0 | 130 | 0 |
| C | 0 | 130 | 0 |
| D | 0 | 130 | 0 |
| Mode M9 | |||
|---|---|---|---|
| Quadrant | BADHDUFLAG | Total packets | Discarded packets |
| A | 0 | 11 | 0 |
| B | 0 | 11 | 0 |
| C | 0 | 11 | 0 |
| D | 0 | 11 | 0 |
| Quadrant | Total seconds | Saturated seconds | Saturation percentage |
|---|---|---|---|
| A | 6371 | 281 | 4.410611% |
| B | 6372 | 259 | 4.064658% |
| C | 6372 | 1877 | 29.456999% |
| D | 6372 | 282 | 4.425612% |
Noise dominated data is calculated using 1-second bins in cleaned event files. If a bin has >2000 counts, and if more than 50% of those come from <1% of pixels, then it is considered to be noise-dominated and hence unusable.
| Quadrant | # 1 sec bins | Bins with >0 counts | Bins with >2000 counts | High rate bins dominated by noise | Noise dominated (total time) | Noise dominated (detector-on time) | Marked lightcurve |
|---|---|---|---|---|---|---|---|
| A | 7491 | 6372 | 278 | 278 | 3.71% | 4.36% | 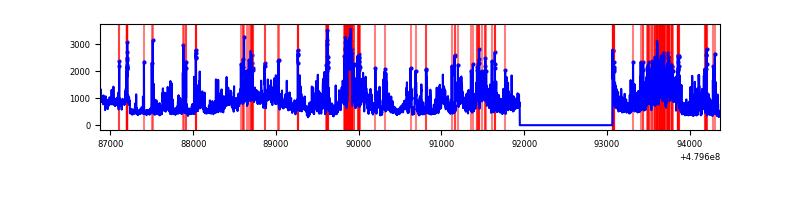 |
| B | 7492 | 6373 | 173 | 173 | 2.31% | 2.71% | 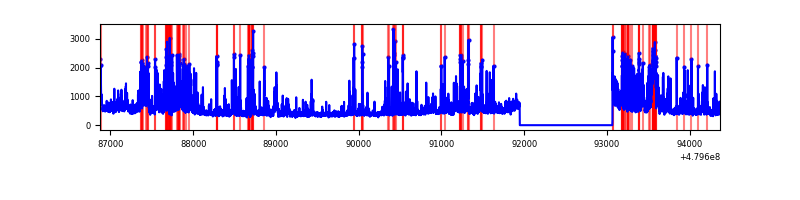 |
| C | 7492 | 6373 | 2111 | 2111 | 28.18% | 33.12% | 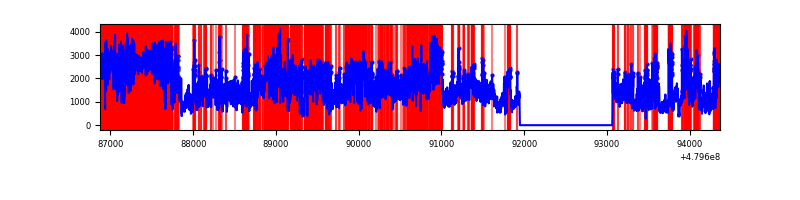 |
| D | 7492 | 6373 | 266 | 266 | 3.55% | 4.17% | 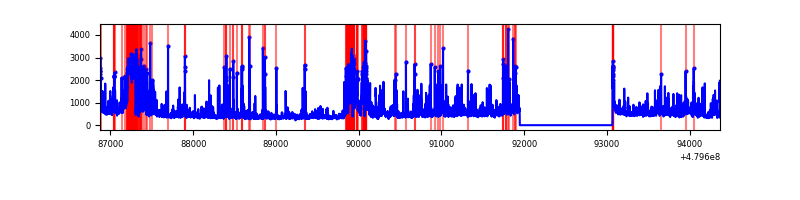 |
Top three noisy pixels from each quadrant. If the there are fewer than three noisy pixels in the level2.evt file, extra rows are filled as -1
| Pixel properties | Quadrant properties | ||||||
|---|---|---|---|---|---|---|---|
| Quadrant | DetID | PixID | Counts | Sigma | Mean | Median | Sigma |
| A | 4 | 4 | 1149025 | 7122.16 | 648 | 632 | 161.2 |
| A | 12 | 3 | 1015489 | 6293.99 | 648 | 632 | 161.2 |
| A | 4 | 249 | 236644 | 1463.71 | 648 | 632 | 161.2 |
| B | 8 | 128 | 623560 | 4464.49 | 658 | 636 | 139.5 |
| B | 5 | 185 | 355249 | 2541.51 | 658 | 636 | 139.5 |
| B | 7 | 252 | 94032 | 669.37 | 658 | 636 | 139.5 |
| C | 12 | 247 | 4889715 | 31773.12 | 544 | 538 | 153.9 |
| C | 4 | 12 | 2969363 | 19293.39 | 544 | 538 | 153.9 |
| C | 13 | 3 | 256970 | 1666.47 | 544 | 538 | 153.9 |
| D | 7 | 96 | 573711 | 3255.35 | 625 | 602 | 176.1 |
| D | 2 | 62 | 391150 | 2218.38 | 625 | 602 | 176.1 |
| D | 8 | 176 | 164410 | 930.46 | 625 | 602 | 176.1 |
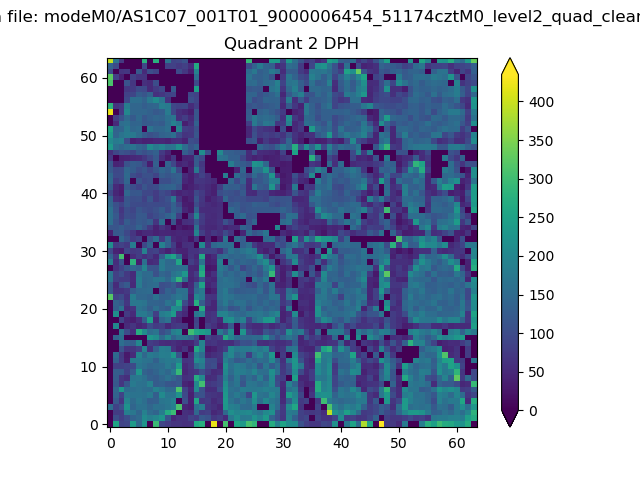
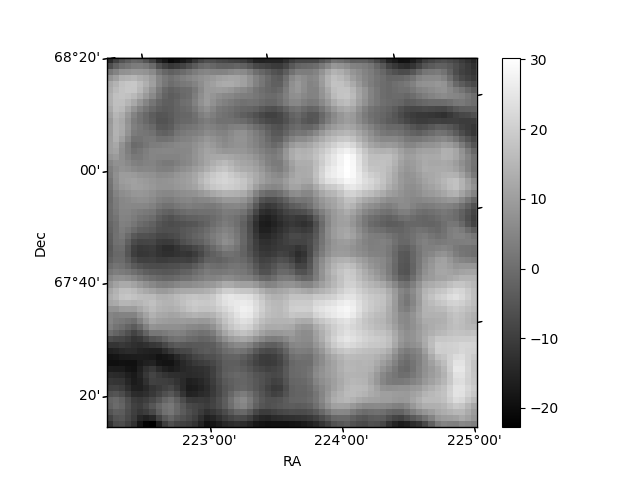
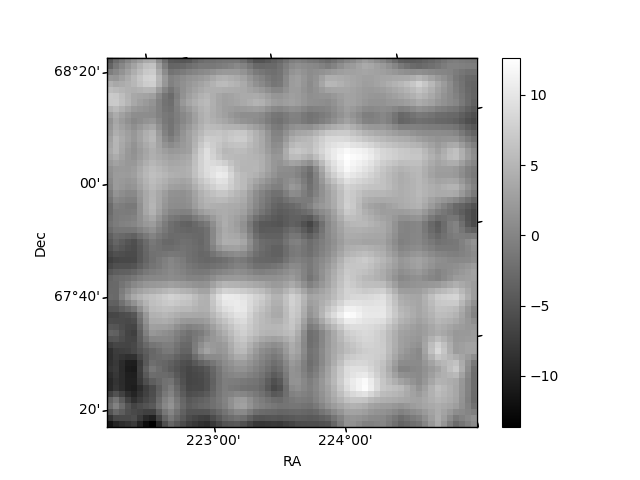
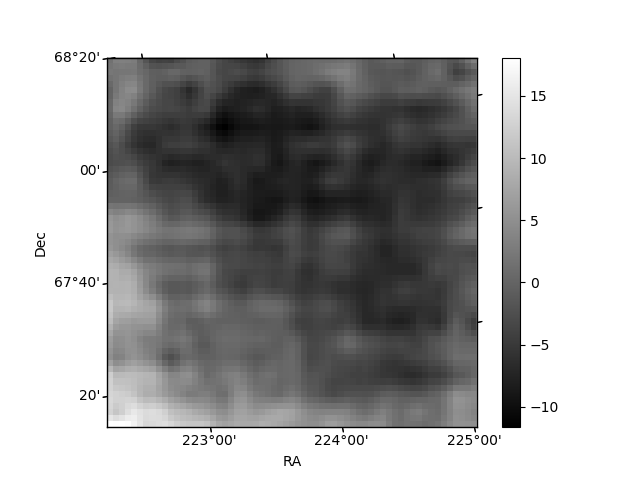
Histogram calculated using DETX and DETY for each event in the final _common_clean file
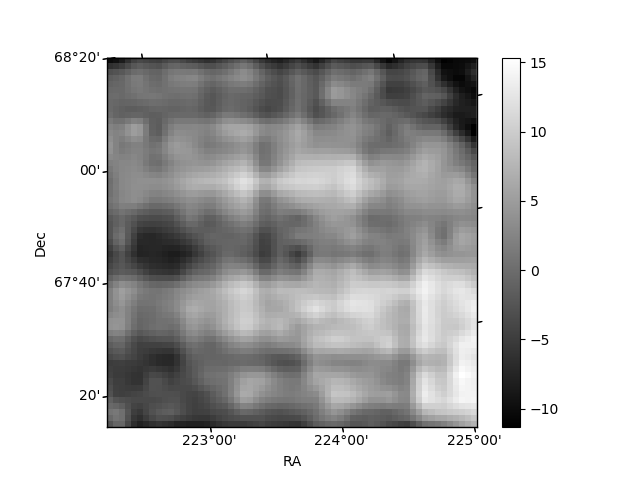
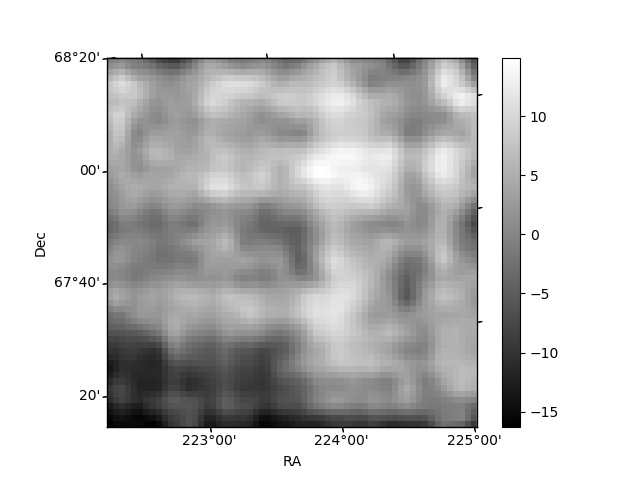
| Quadrant A | 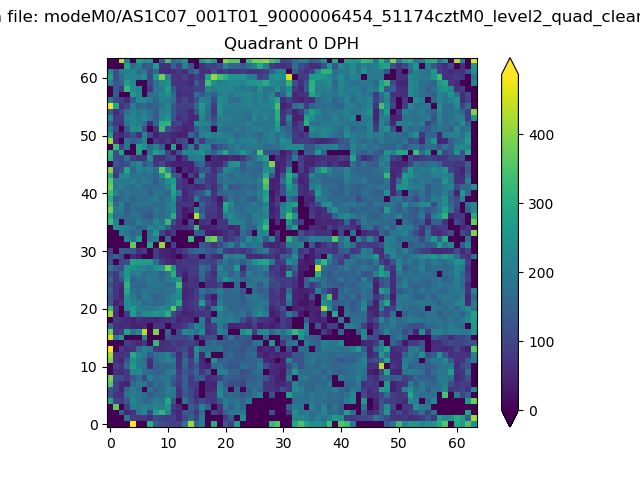 |
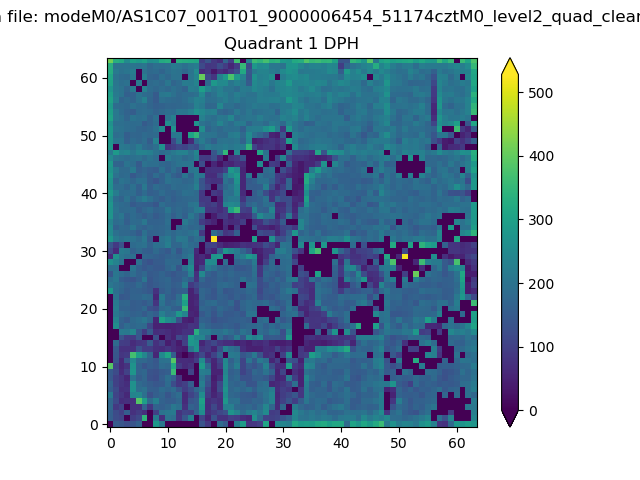 |
Quadrant B |
|---|---|---|---|
| Quadrant D | 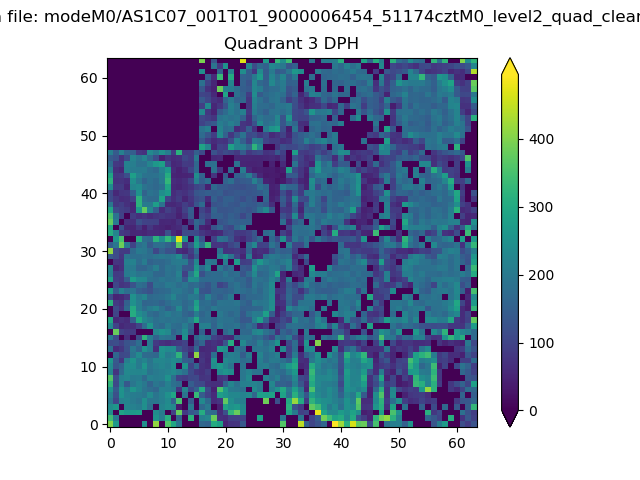 |
 |
Quadrant C |
| Plot type | Count rate plots | Images |
|---|---|---|
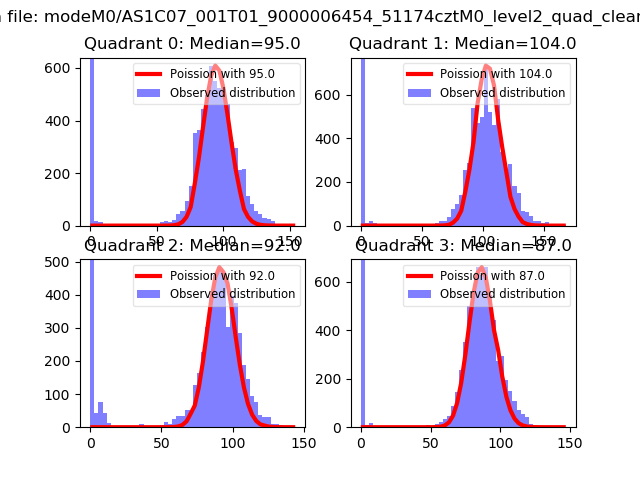
| Comparison with Poisson distribution Blue bars denote a histogram of data divided into 1 sec bins. Red curve is a Poisson curve with rate = median count rate of data. |
 |
 |
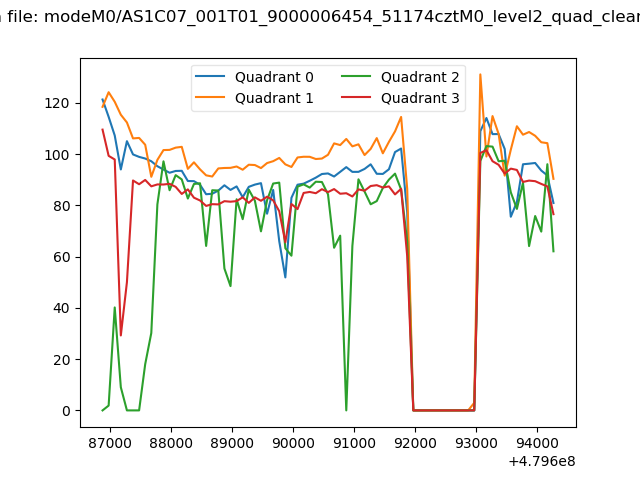
| Quadrant-wise count rates Data is divided into 100 sec bins |
 |
|
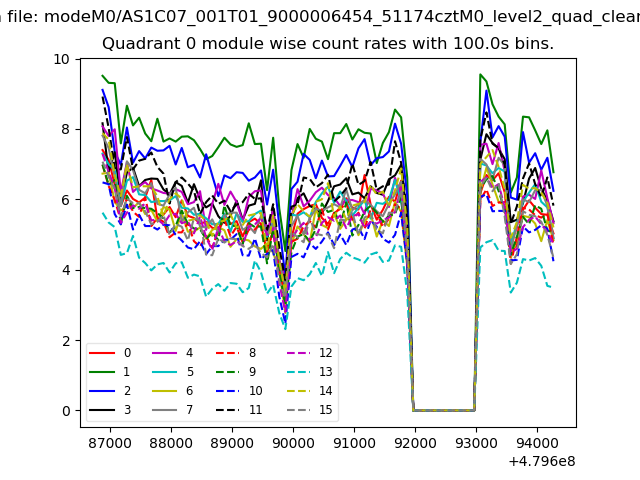
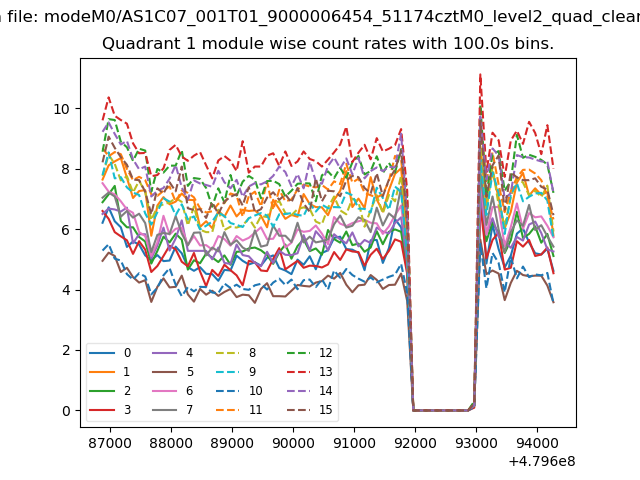
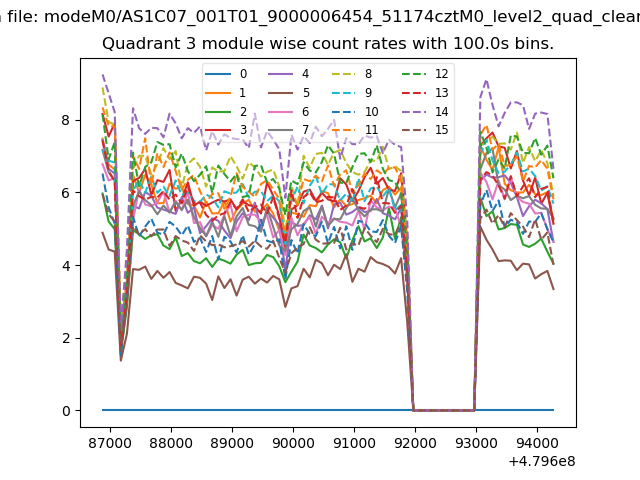
| Module-wise count rates for Quadrant A Data is divided into 100 sec bins |
 |
 |
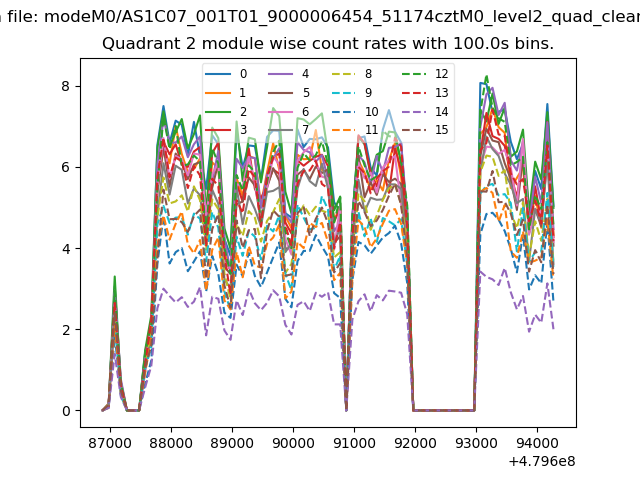
| Module-wise count rates for Quadrant B Data is divided into 100 sec bins |
 |
 |
| Module-wise count rates for Quadrant C Data is divided into 100 sec bins |
 |
 |
| Module-wise count rates for Quadrant D Data is divided into 100 sec bins |
 |
 |
| Parameter | Plot |
|---|---|
| CZT HV Monitor | 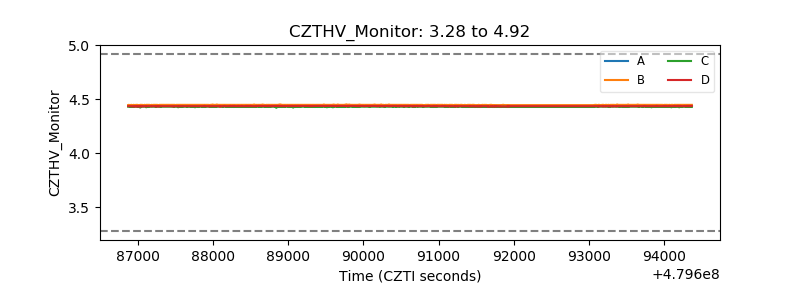 |
| D_VDD | 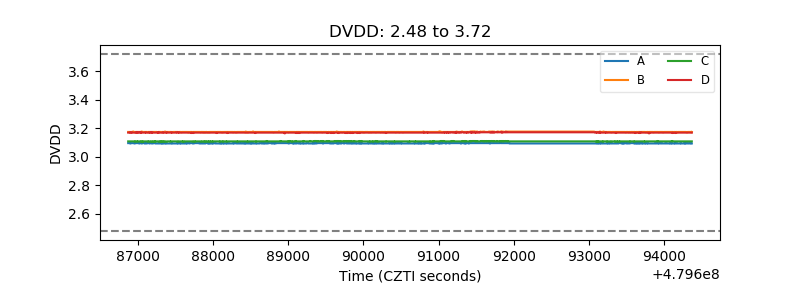 |
| Temperature 1 | 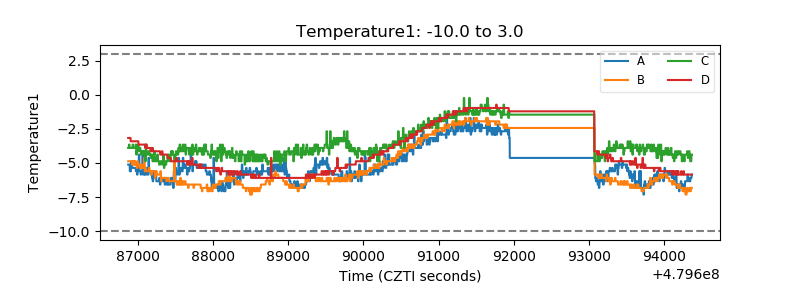 |
| Veto HV Monitor | 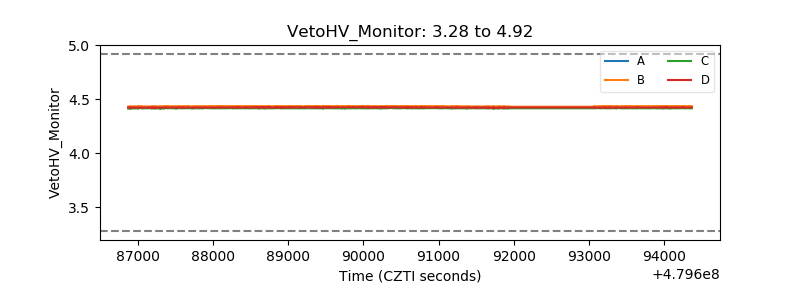 |
| Veto LLD | 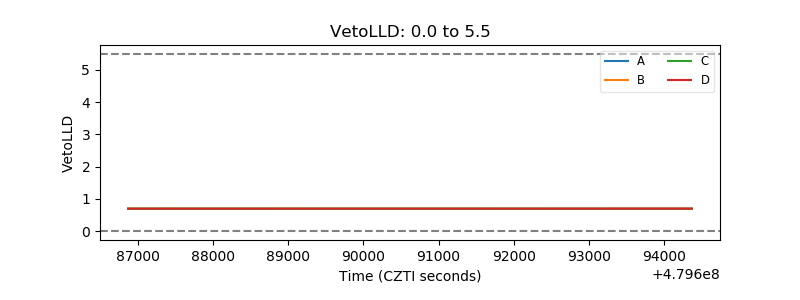 |
| Alpha Counter | 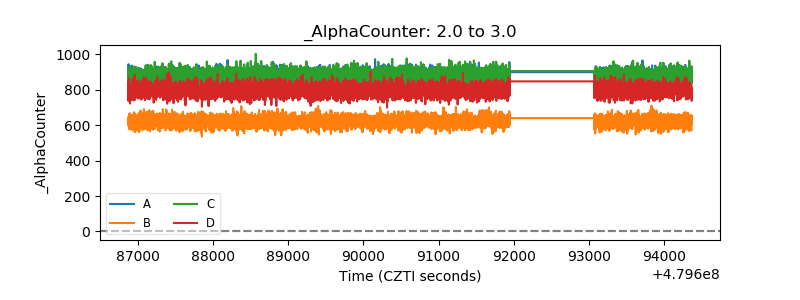 |
| _CPM_Rate | 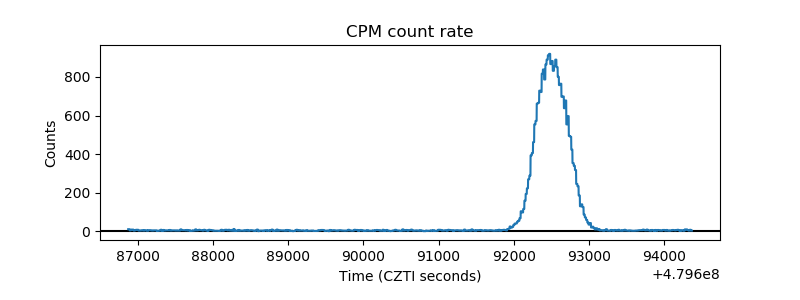 |
| CZT Counter | 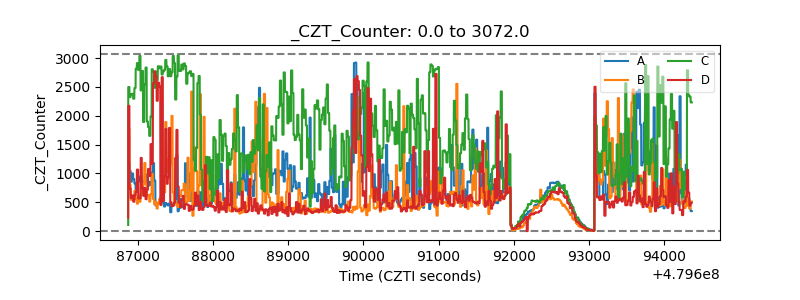 |
| +2.5 Volts monitor | 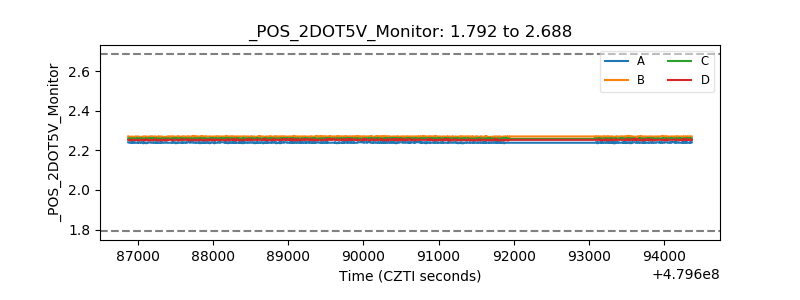 |
| +5 Volts monitor | 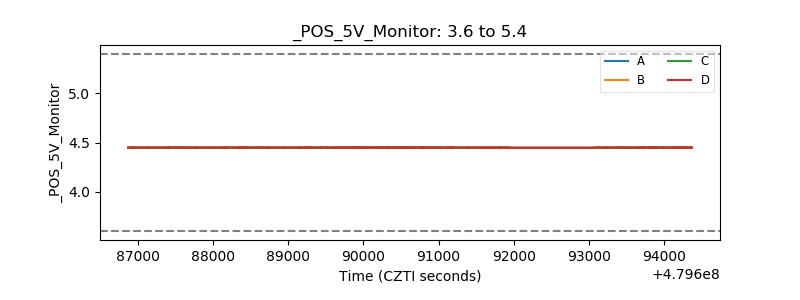 |
| _ROLL_ROT | 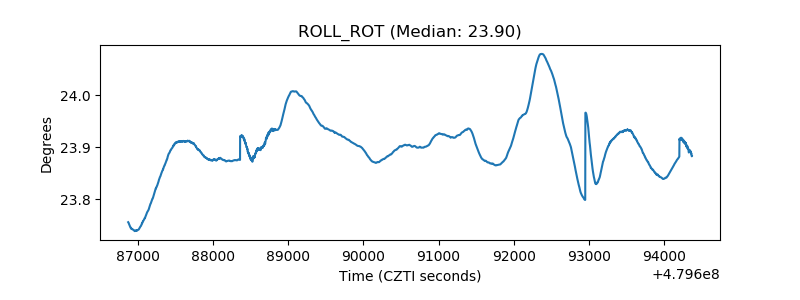 |
| _Roll_DEC | 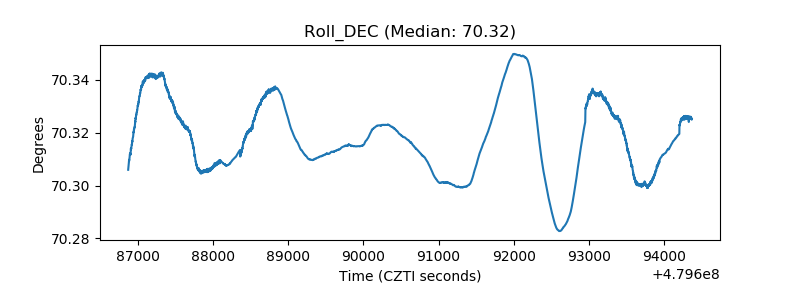 |
| _Roll_RA | 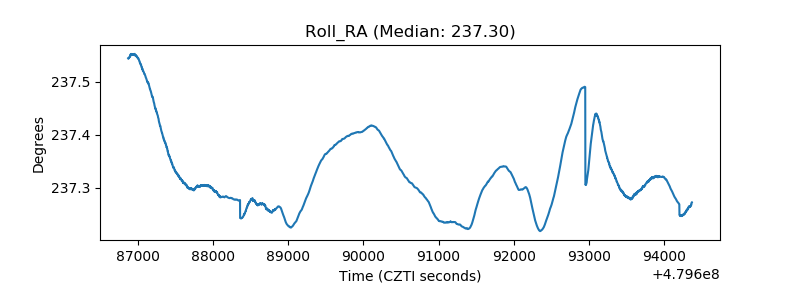 |
| Veto Counter | 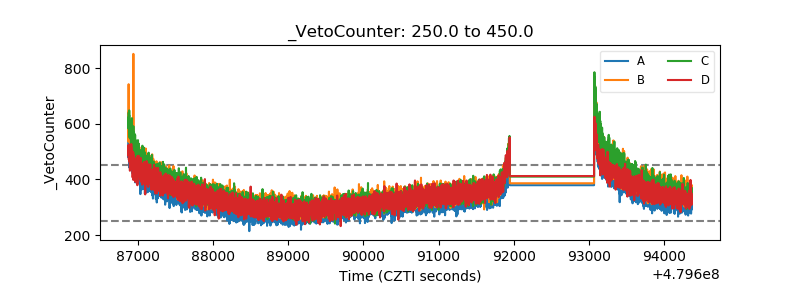 |