| Param | Original file | Final file |
|---|---|---|
| Filename | modeM0/AS1C07_001T01_9000006454_51175cztM0_level2.fits | modeM0/AS1C07_001T01_9000006454_51175cztM0_level2_quad_clean.evt |
| Size (bytes) | 715,135,680 | 95,918,400 |
| Size | 682.0 MB | 91.5 MB |
| Events in quadrant A | 6,011,242 | 625,251 |
| Events in quadrant B | 4,655,941 | 688,809 |
| Events in quadrant C | 9,071,251 | 565,873 |
| Events in quadrant D | 6,211,462 | 553,169 |
| Mode M0 | |||
|---|---|---|---|
| Quadrant | BADHDUFLAG | Total packets | Discarded packets |
| A | 0 | 22653 | 2 |
| B | 0 | 18653 | 2 |
| C | 0 | 31666 | 2 |
| D | 0 | 23393 | 2 |
| Mode SS | |||
|---|---|---|---|
| Quadrant | BADHDUFLAG | Total packets | Discarded packets |
| A | 0 | 136 | 0 |
| B | 0 | 136 | 0 |
| C | 0 | 136 | 0 |
| D | 0 | 136 | 0 |
| Mode M9 | |||
|---|---|---|---|
| Quadrant | BADHDUFLAG | Total packets | Discarded packets |
| A | 0 | 21 | 0 |
| B | 0 | 22 | 0 |
| C | 0 | 22 | 0 |
| D | 0 | 22 | 0 |
| Quadrant | Total seconds | Saturated seconds | Saturation percentage |
|---|---|---|---|
| A | 6763 | 364 | 5.382227% |
| B | 6763 | 366 | 5.411799% |
| C | 6763 | 1134 | 16.767707% |
| D | 6762 | 681 | 10.070985% |
Noise dominated data is calculated using 1-second bins in cleaned event files. If a bin has >2000 counts, and if more than 50% of those come from <1% of pixels, then it is considered to be noise-dominated and hence unusable.
| Quadrant | # 1 sec bins | Bins with >0 counts | Bins with >2000 counts | High rate bins dominated by noise | Noise dominated (total time) | Noise dominated (detector-on time) | Marked lightcurve |
|---|---|---|---|---|---|---|---|
| A | 7913 | 6764 | 316 | 316 | 3.99% | 4.67% | 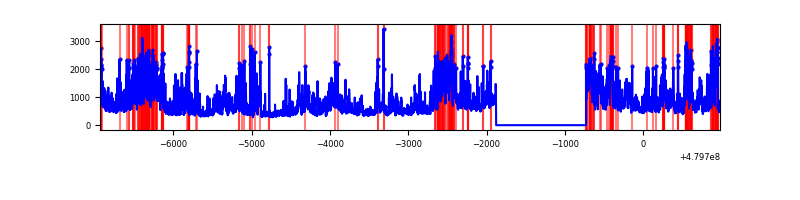 |
| B | 7913 | 6764 | 242 | 242 | 3.06% | 3.58% | 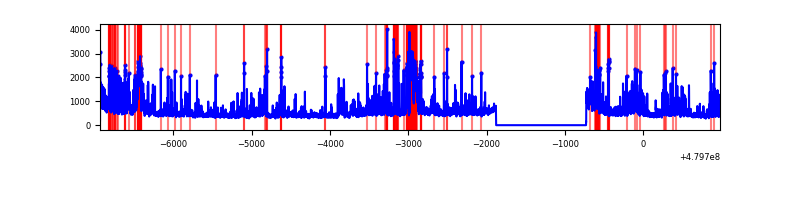 |
| C | 7913 | 6764 | 1282 | 1282 | 16.20% | 18.95% | 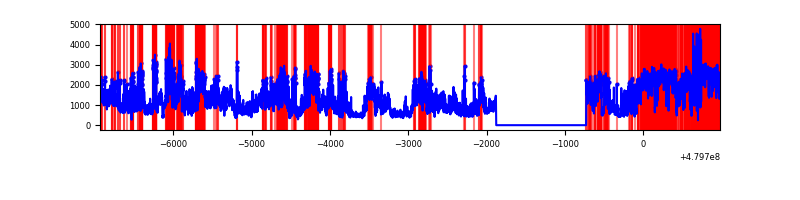 |
| D | 7912 | 6763 | 855 | 855 | 10.81% | 12.64% | 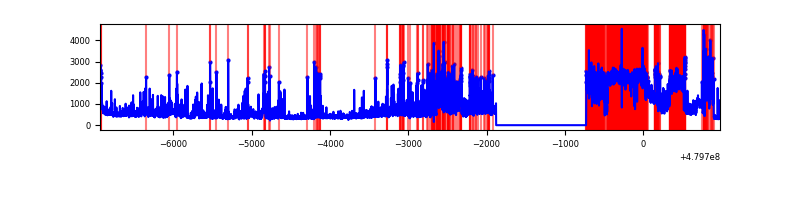 |
Top three noisy pixels from each quadrant. If the there are fewer than three noisy pixels in the level2.evt file, extra rows are filled as -1
| Pixel properties | Quadrant properties | ||||||
|---|---|---|---|---|---|---|---|
| Quadrant | DetID | PixID | Counts | Sigma | Mean | Median | Sigma |
| A | 12 | 3 | 1206232 | 7025.61 | 688 | 674 | 171.6 |
| A | 4 | 4 | 711899 | 4144.79 | 688 | 674 | 171.6 |
| A | 12 | 80 | 367409 | 2137.21 | 688 | 674 | 171.6 |
| B | 8 | 128 | 419855 | 2873.05 | 691 | 665 | 145.9 |
| B | 10 | 60 | 341321 | 2334.79 | 691 | 665 | 145.9 |
| B | 5 | 185 | 264162 | 1805.96 | 691 | 665 | 145.9 |
| C | 12 | 247 | 4617187 | 25506.99 | 661 | 656 | 181.0 |
| C | 4 | 12 | 544020 | 3002.16 | 661 | 656 | 181.0 |
| C | 15 | 158 | 467376 | 2578.69 | 661 | 656 | 181.0 |
| D | 2 | 62 | 2470868 | 13469.29 | 655 | 630 | 183.4 |
| D | 3 | 12 | 221392 | 1203.73 | 655 | 630 | 183.4 |
| D | 2 | 216 | 157714 | 856.52 | 655 | 630 | 183.4 |
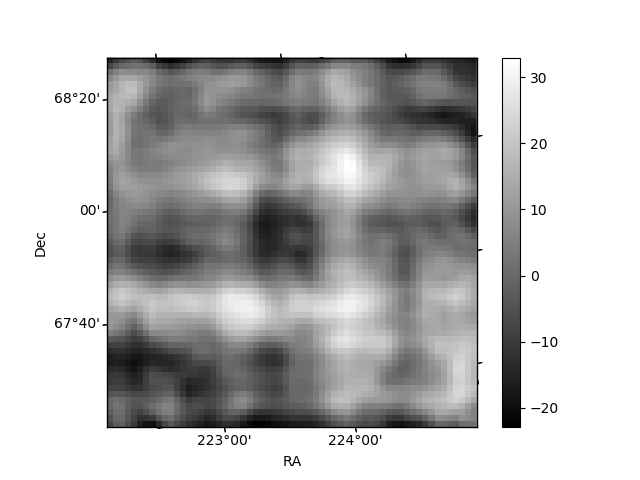
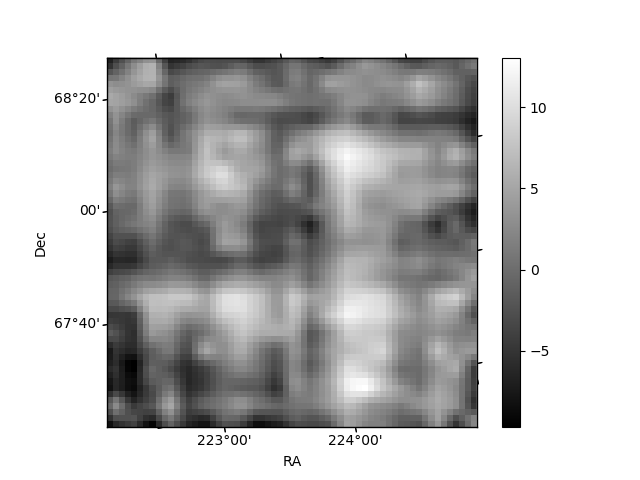
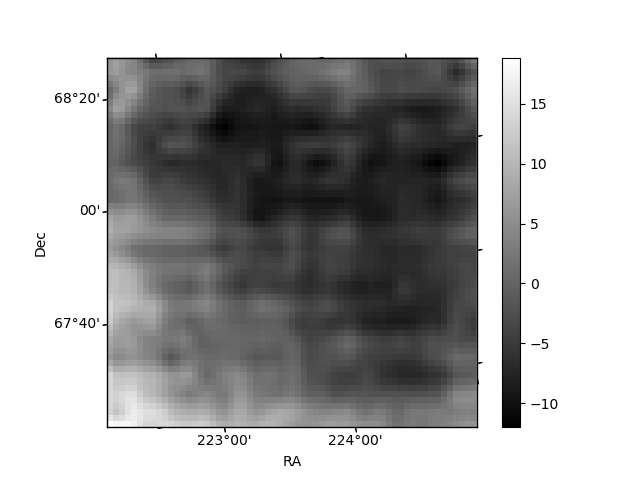
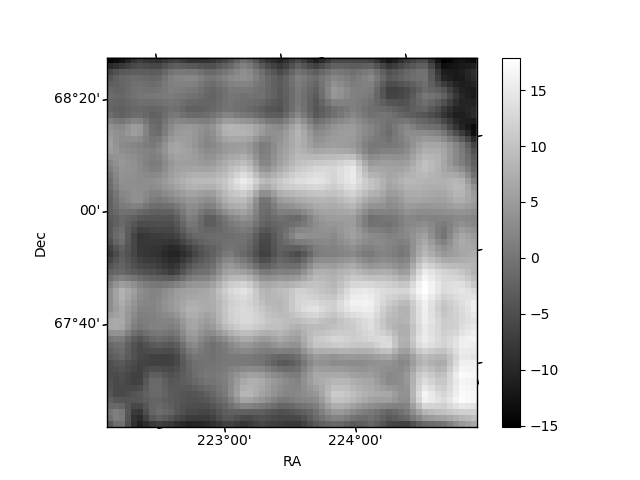
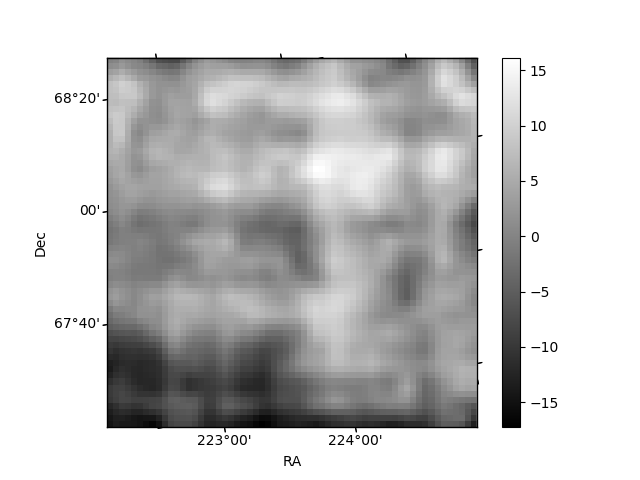
Histogram calculated using DETX and DETY for each event in the final _common_clean file
| Quadrant A | 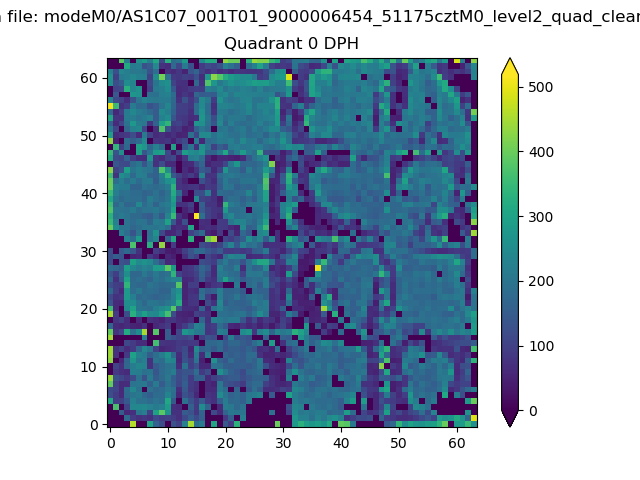 |
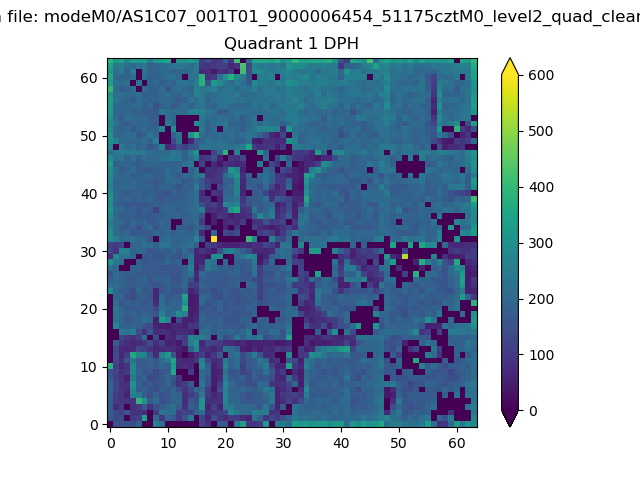 |
Quadrant B |
|---|---|---|---|
| Quadrant D | 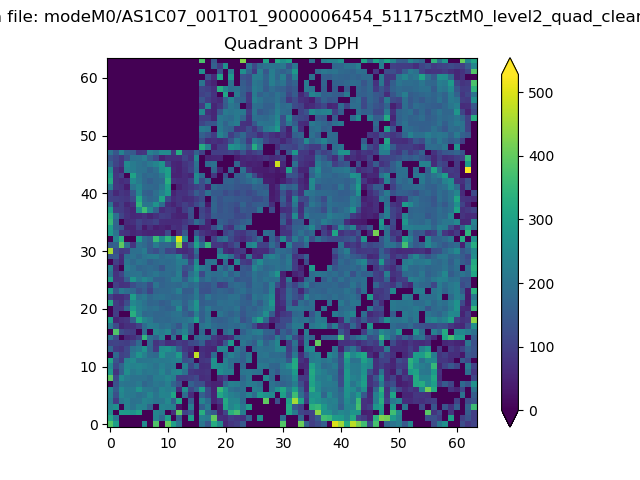 |
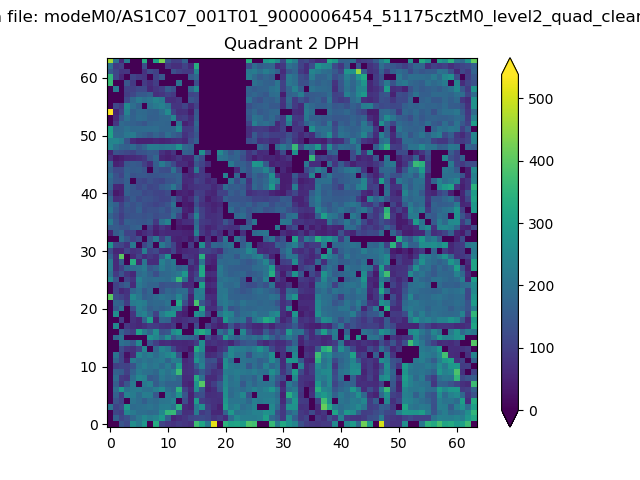 |
Quadrant C |
| Plot type | Count rate plots | Images |
|---|---|---|
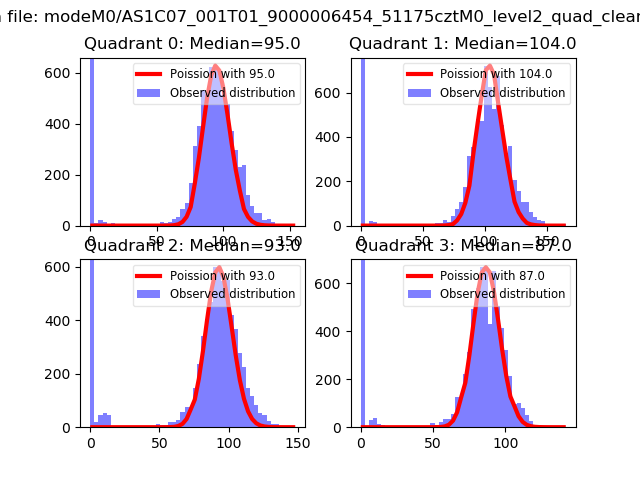
| Comparison with Poisson distribution Blue bars denote a histogram of data divided into 1 sec bins. Red curve is a Poisson curve with rate = median count rate of data. |
 |
 |
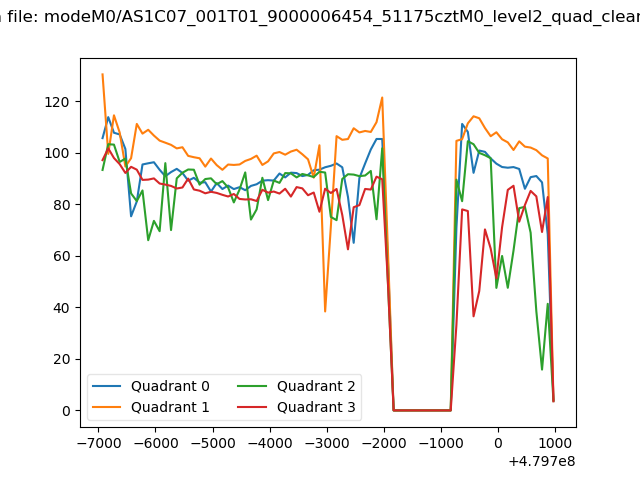
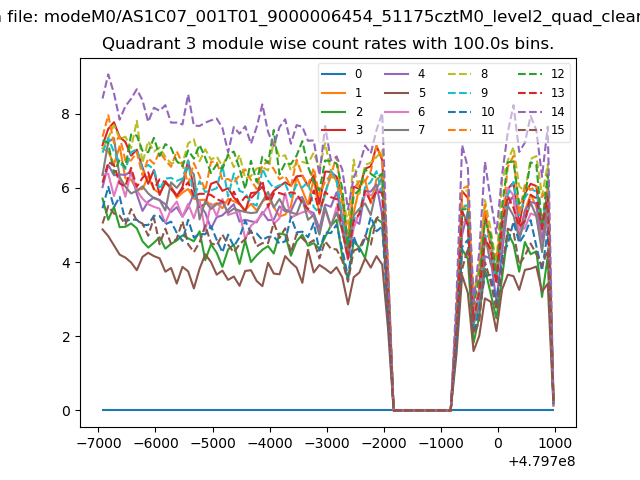
| Quadrant-wise count rates Data is divided into 100 sec bins |
 |
|
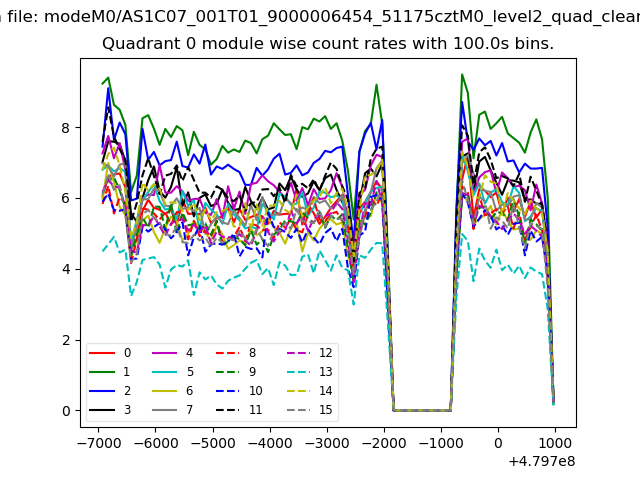
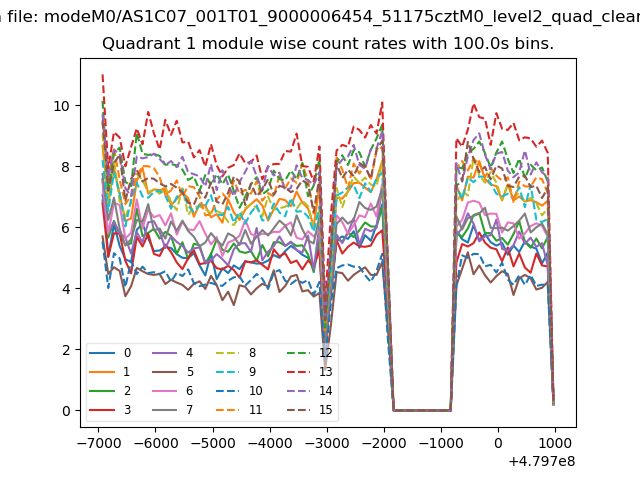
| Module-wise count rates for Quadrant A Data is divided into 100 sec bins |
 |
 |
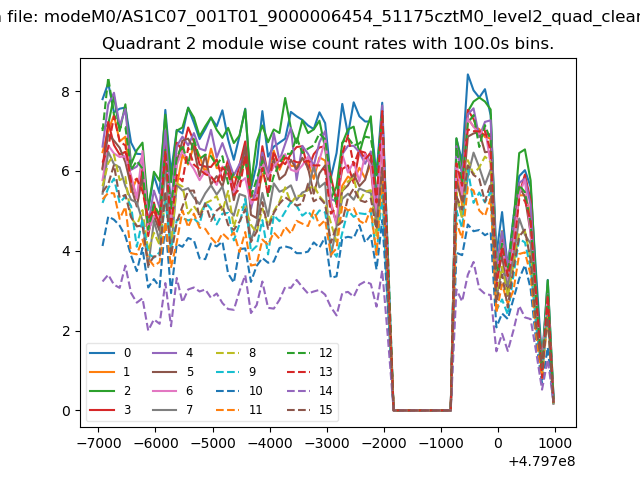
| Module-wise count rates for Quadrant B Data is divided into 100 sec bins |
 |
 |
| Module-wise count rates for Quadrant C Data is divided into 100 sec bins |
 |
 |
| Module-wise count rates for Quadrant D Data is divided into 100 sec bins |
 |
 |
| Parameter | Plot |
|---|---|
| CZT HV Monitor | 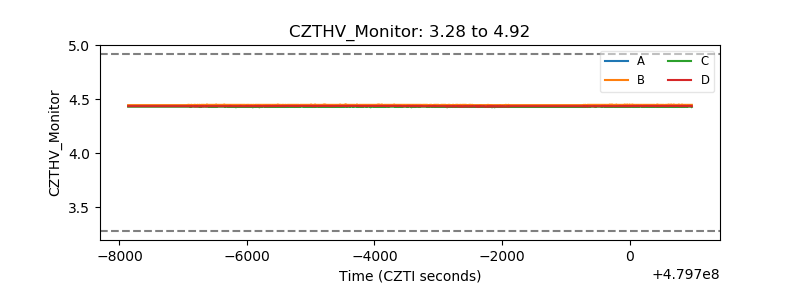 |
| D_VDD | 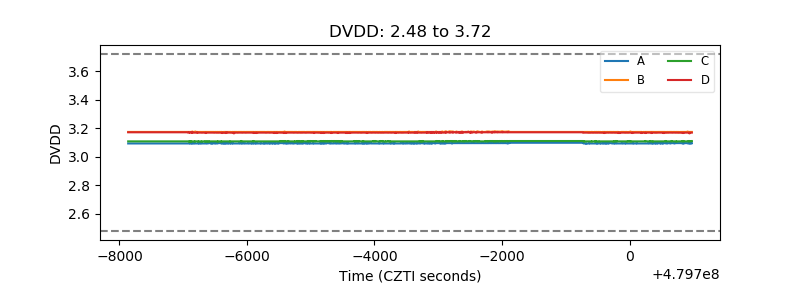 |
| Temperature 1 | 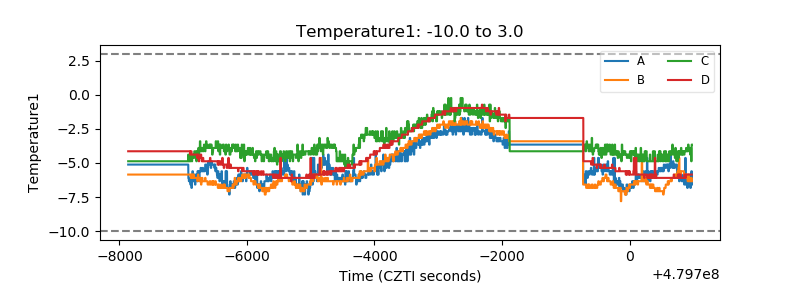 |
| Veto HV Monitor | 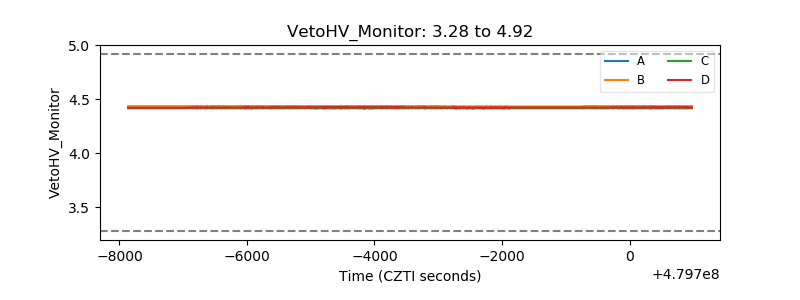 |
| Veto LLD | 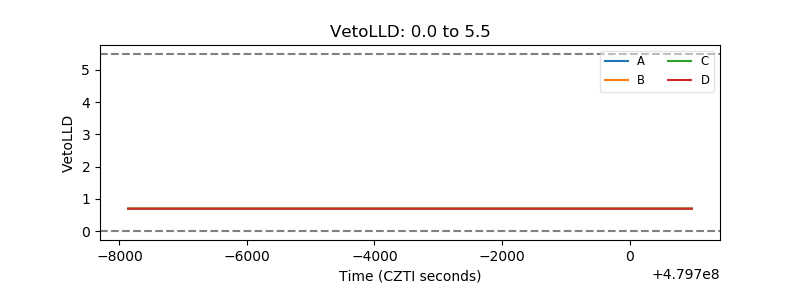 |
| Alpha Counter | 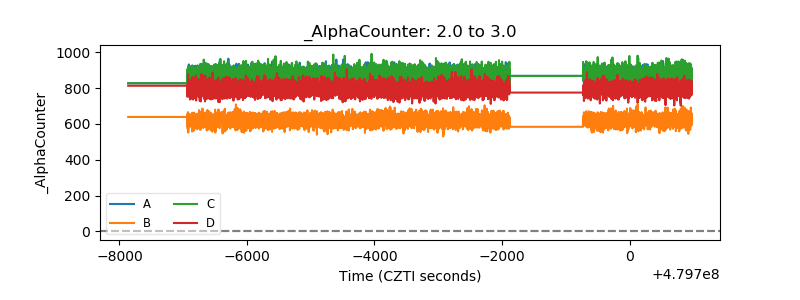 |
| _CPM_Rate | 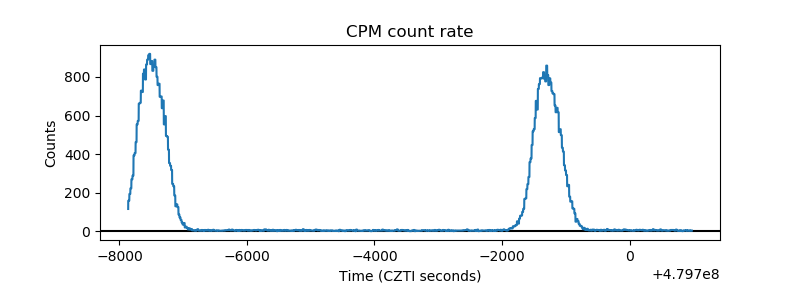 |
| CZT Counter | 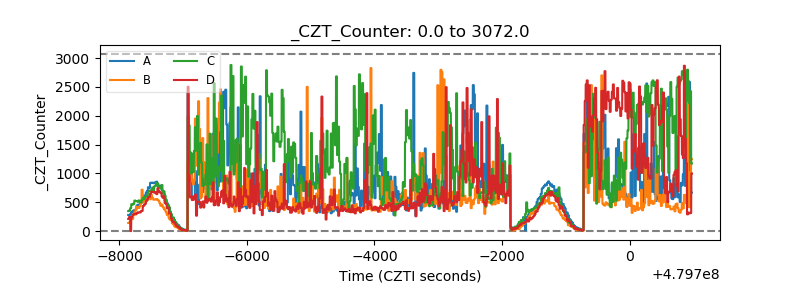 |
| +2.5 Volts monitor |  |
| +5 Volts monitor | 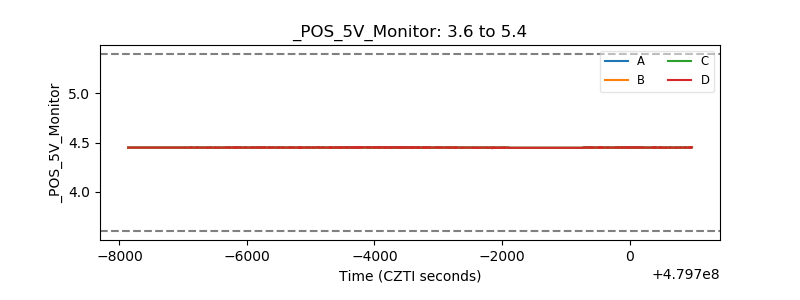 |
| _ROLL_ROT | 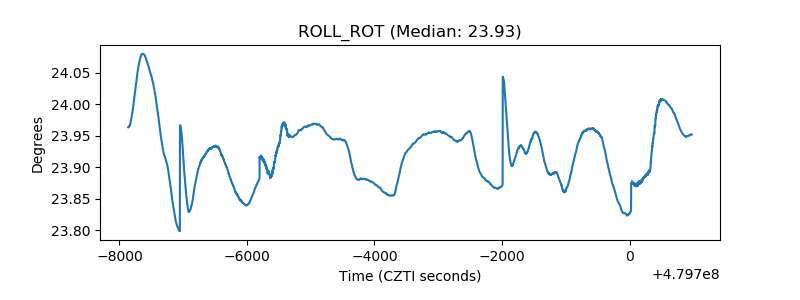 |
| _Roll_DEC | 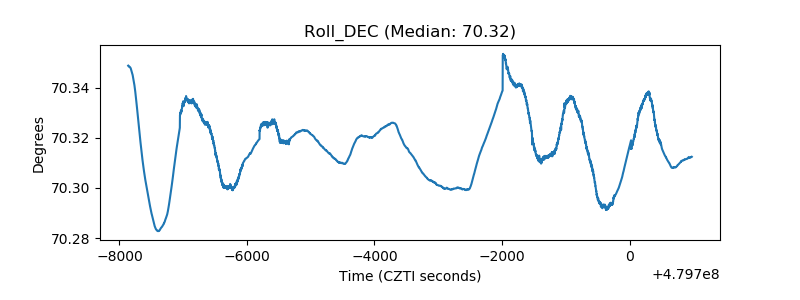 |
| _Roll_RA | 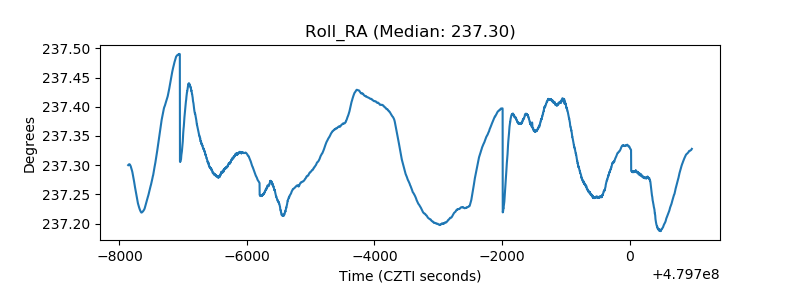 |
| Veto Counter | 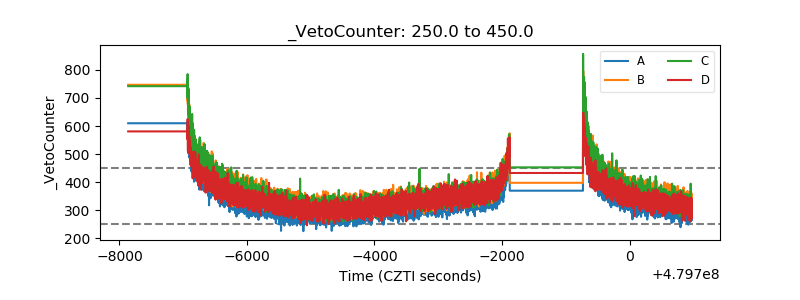 |