| Param | Original file | Final file |
|---|---|---|
| Filename | modeM0/AS1C07_001T01_9000006454_51178cztM0_level2.fits | modeM0/AS1C07_001T01_9000006454_51178cztM0_level2_quad_clean.evt |
| Size (bytes) | 293,679,360 | 45,129,600 |
| Size | 280.1 MB | 43.0 MB |
| Events in quadrant A | 2,938,417 | 284,788 |
| Events in quadrant B | 2,694,263 | 305,712 |
| Events in quadrant C | 2,991,615 | 252,814 |
| Events in quadrant D | 1,983,010 | 282,548 |
| Mode M0 | |||
|---|---|---|---|
| Quadrant | BADHDUFLAG | Total packets | Discarded packets |
| A | 0 | 21621 | 10568 |
| B | 0 | 20404 | 10044 |
| C | 0 | 27438 | 16373 |
| D | 0 | 18228 | 9621 |
| Mode SS | |||
|---|---|---|---|
| Quadrant | BADHDUFLAG | Total packets | Discarded packets |
| A | 0 | 132 | 60 |
| B | 0 | 133 | 52 |
| C | 0 | 131 | 58 |
| D | 0 | 134 | 56 |
| Mode M9 | |||
|---|---|---|---|
| Quadrant | BADHDUFLAG | Total packets | Discarded packets |
| A | 0 | 12 | 1 |
| B | 0 | 12 | 2 |
| C | 0 | 12 | 2 |
| D | 0 | 11 | 1 |
| Quadrant | Total seconds | Saturated seconds | Saturation percentage |
|---|---|---|---|
| A | 3410 | 258 | 7.565982% |
| B | 3403 | 278 | 8.169262% |
| C | 3139 | 351 | 11.181905% |
| D | 3507 | 87 | 2.480753% |
Noise dominated data is calculated using 1-second bins in cleaned event files. If a bin has >2000 counts, and if more than 50% of those come from <1% of pixels, then it is considered to be noise-dominated and hence unusable.
| Quadrant | # 1 sec bins | Bins with >0 counts | Bins with >2000 counts | High rate bins dominated by noise | Noise dominated (total time) | Noise dominated (detector-on time) | Marked lightcurve |
|---|---|---|---|---|---|---|---|
| A | 7680 | 3945 | 178 | 178 | 2.32% | 4.51% | 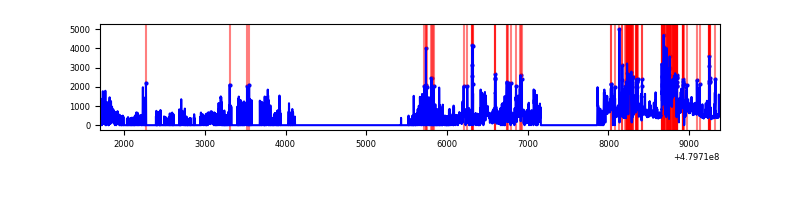 |
| B | 7677 | 3962 | 119 | 119 | 1.55% | 3.00% | 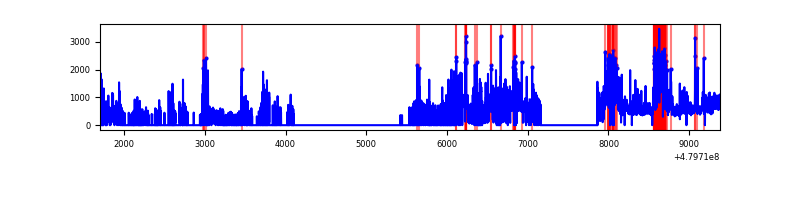 |
| C | 7673 | 3663 | 231 | 231 | 3.01% | 6.31% | 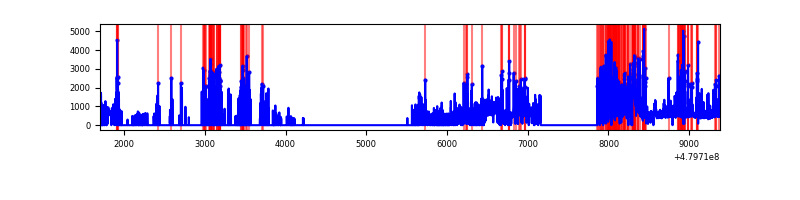 |
| D | 7669 | 4049 | 54 | 54 | 0.70% | 1.33% | 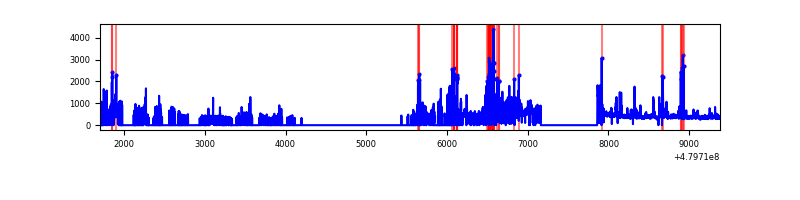 |
Top three noisy pixels from each quadrant. If the there are fewer than three noisy pixels in the level2.evt file, extra rows are filled as -1
| Pixel properties | Quadrant properties | ||||||
|---|---|---|---|---|---|---|---|
| Quadrant | DetID | PixID | Counts | Sigma | Mean | Median | Sigma |
| A | 12 | 3 | 386350 | 4324.0 | 353 | 344 | 89.3 |
| A | 7 | 206 | 380734 | 4261.09 | 353 | 344 | 89.3 |
| A | 14 | 254 | 163204 | 1824.34 | 353 | 344 | 89.3 |
| B | 5 | 185 | 251184 | 3283.84 | 353 | 340 | 76.4 |
| B | 10 | 60 | 237726 | 3107.66 | 353 | 340 | 76.4 |
| B | 0 | 171 | 118481 | 1546.6 | 353 | 340 | 76.4 |
| C | 4 | 12 | 871936 | 9778.79 | 313 | 309 | 89.1 |
| C | 12 | 247 | 297229 | 3331.15 | 313 | 309 | 89.1 |
| C | 13 | 3 | 243927 | 2733.15 | 313 | 309 | 89.1 |
| D | 2 | 62 | 143709 | 1441.13 | 351 | 339 | 99.5 |
| D | 12 | 191 | 112807 | 1130.51 | 351 | 339 | 99.5 |
| D | 8 | 176 | 80684 | 807.61 | 351 | 339 | 99.5 |
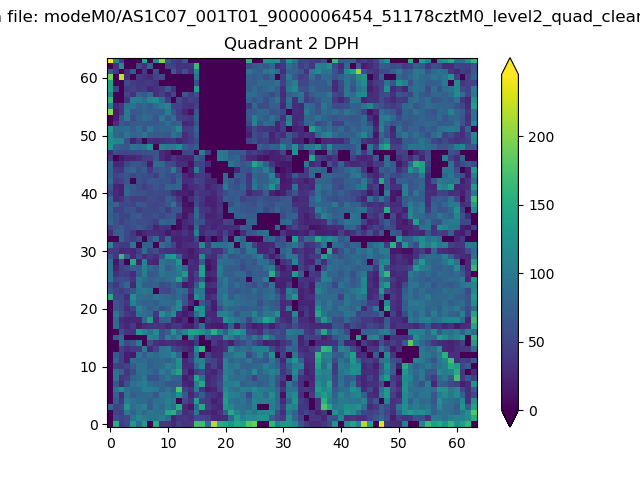
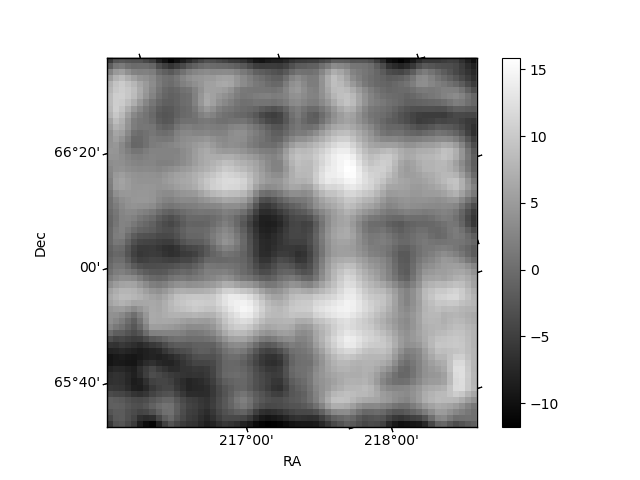
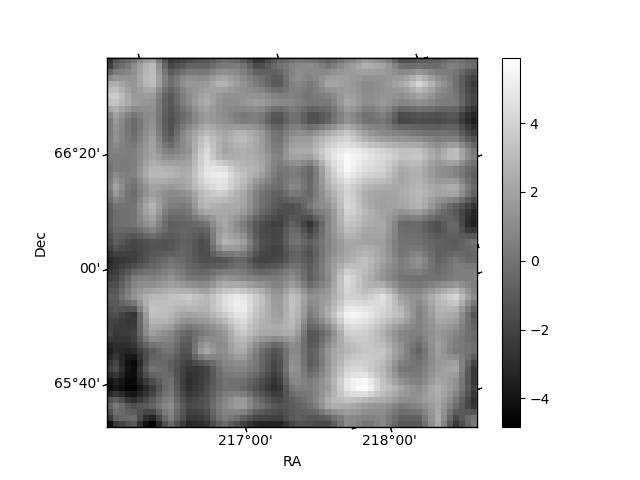
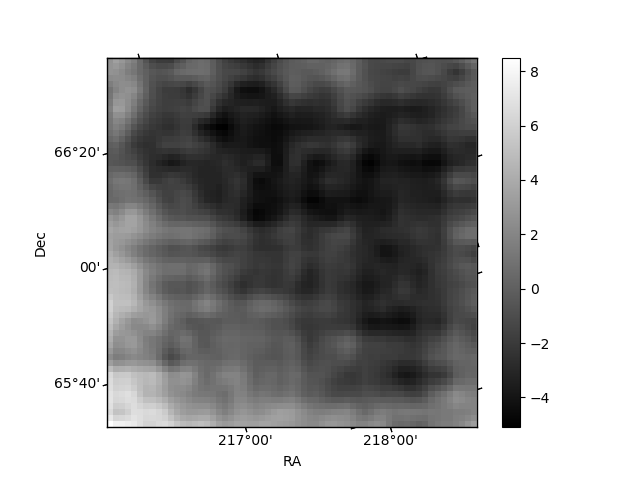
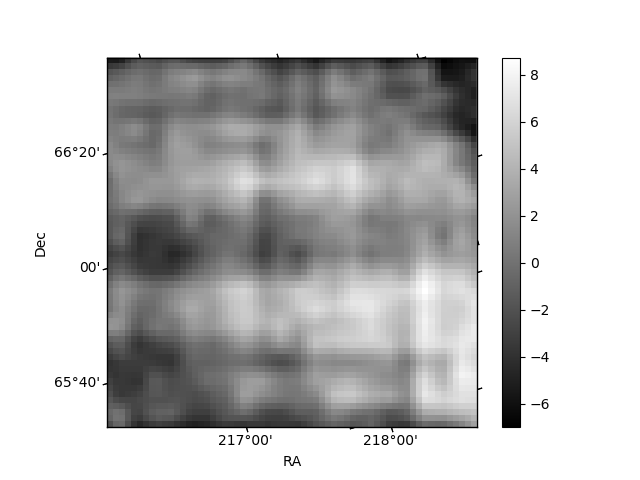
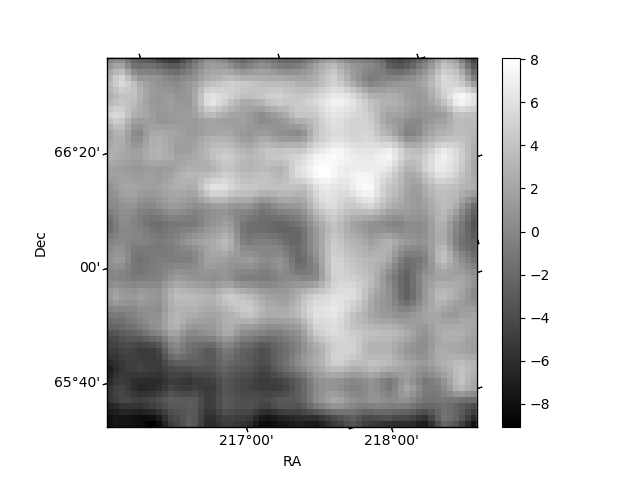
Histogram calculated using DETX and DETY for each event in the final _common_clean file
| Quadrant A | 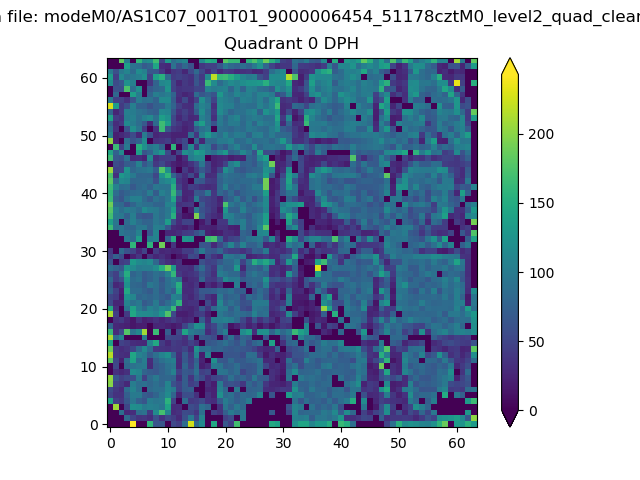 |
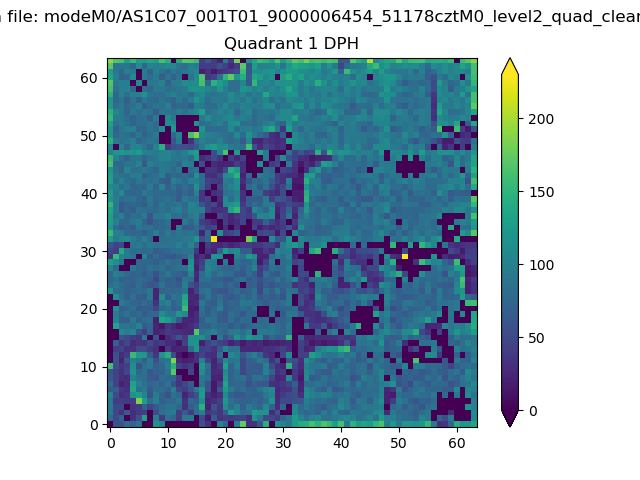 |
Quadrant B |
|---|---|---|---|
| Quadrant D | 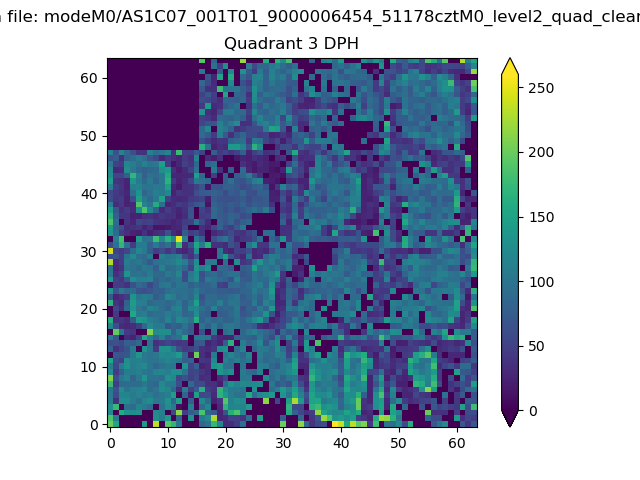 |
 |
Quadrant C |
| Plot type | Count rate plots | Images |
|---|---|---|
| Comparison with Poisson distribution Blue bars denote a histogram of data divided into 1 sec bins. Red curve is a Poisson curve with rate = median count rate of data. |
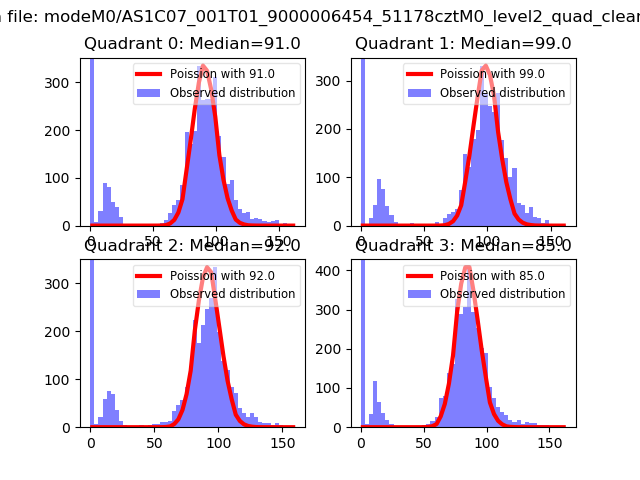 |
 |
| Quadrant-wise count rates Data is divided into 100 sec bins |
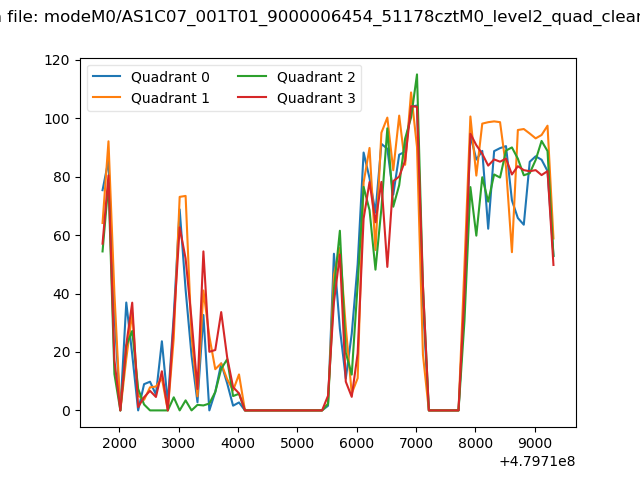 |
|
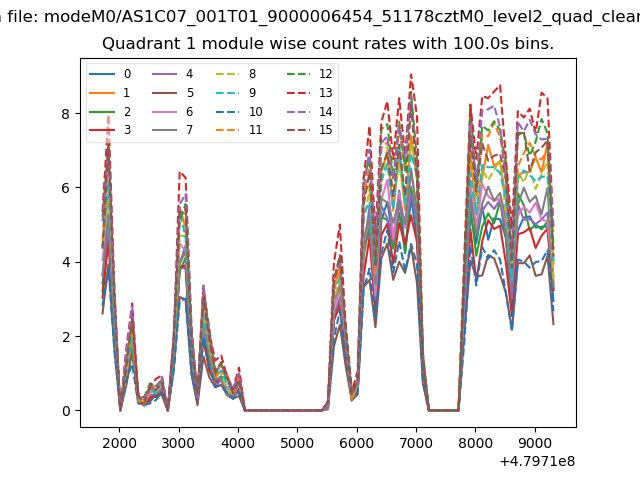
| Module-wise count rates for Quadrant A Data is divided into 100 sec bins |
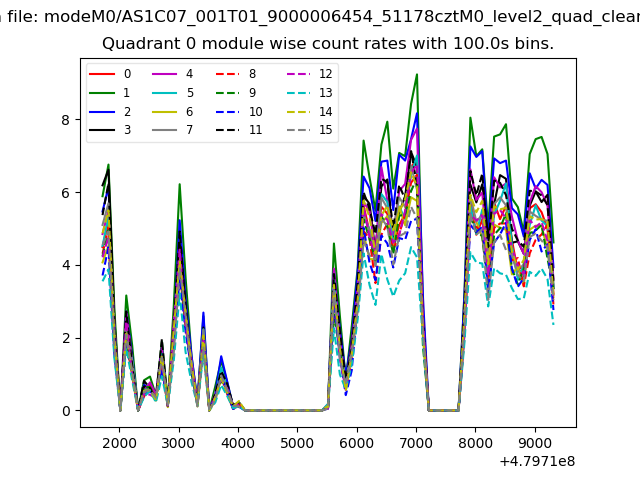 |
 |
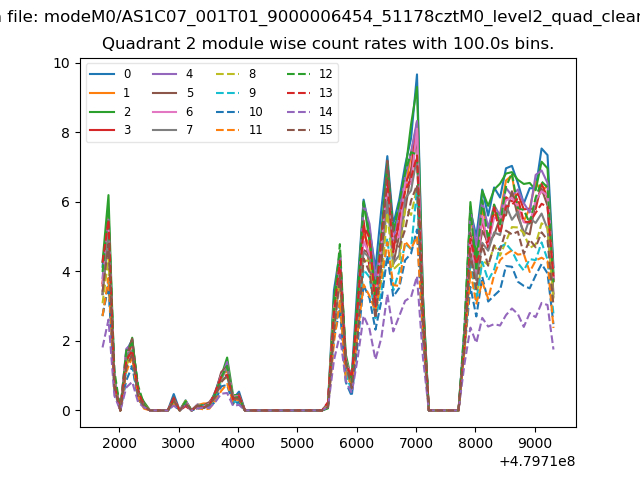
| Module-wise count rates for Quadrant B Data is divided into 100 sec bins |
 |
 |
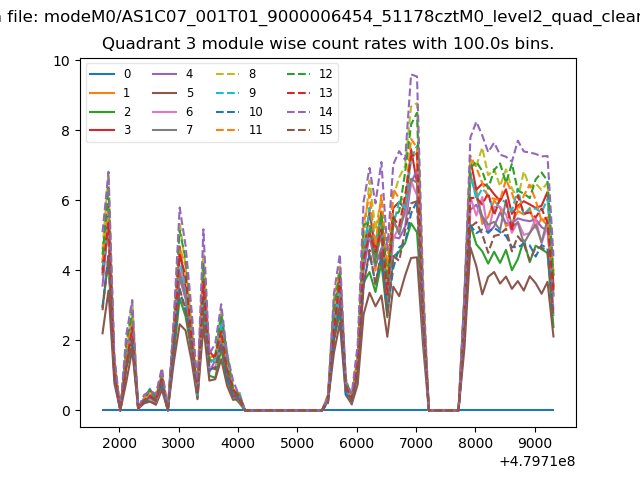
| Module-wise count rates for Quadrant C Data is divided into 100 sec bins |
 |
 |
| Module-wise count rates for Quadrant D Data is divided into 100 sec bins |
 |
 |
| Parameter | Plot |
|---|---|
| CZT HV Monitor | 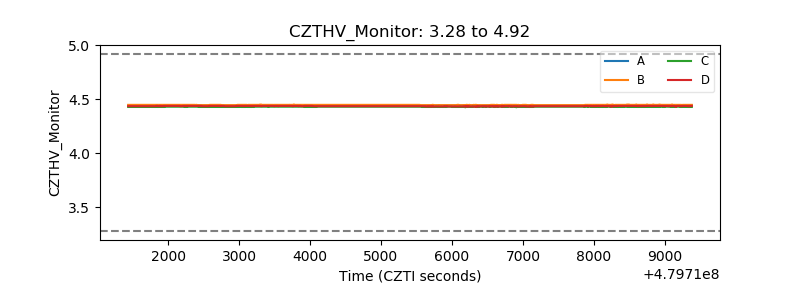 |
| D_VDD | 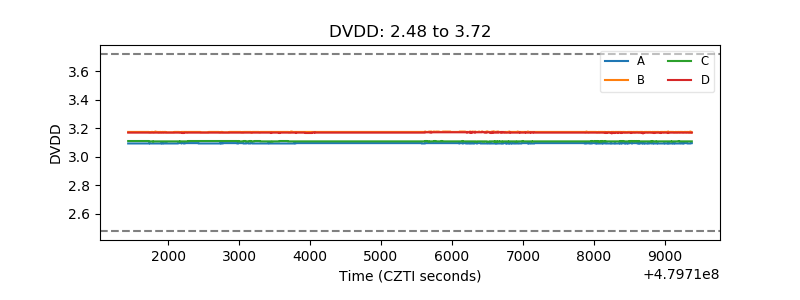 |
| Temperature 1 | 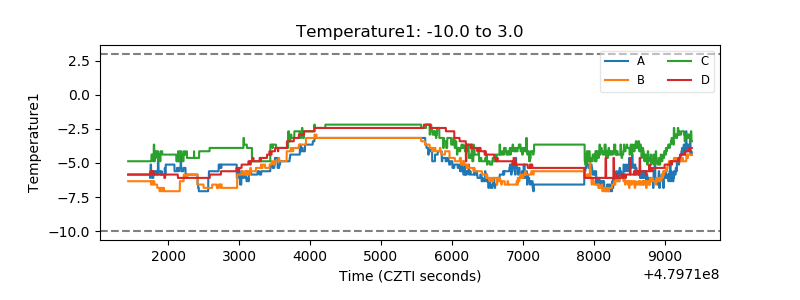 |
| Veto HV Monitor | 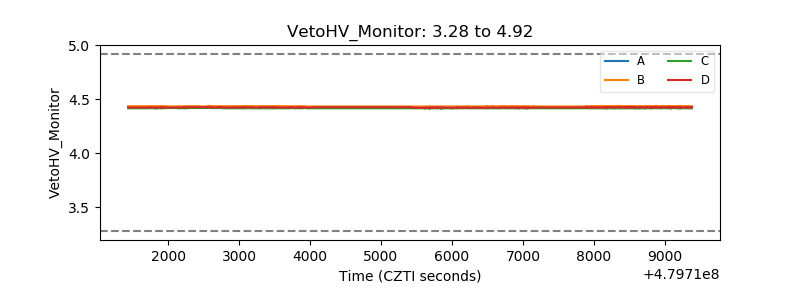 |
| Veto LLD |  |
| Alpha Counter | 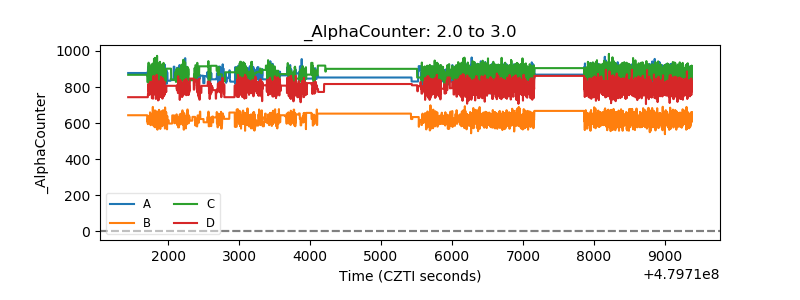 |
| _CPM_Rate | 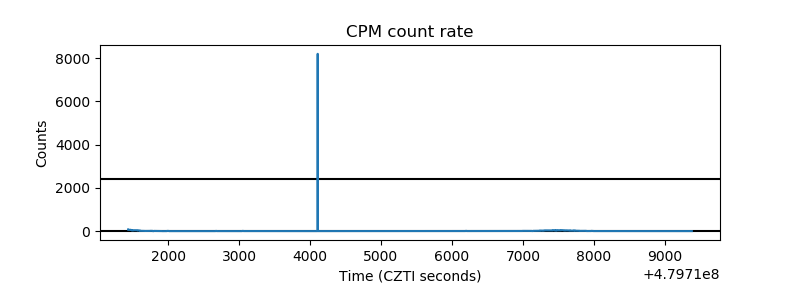 |
| CZT Counter | 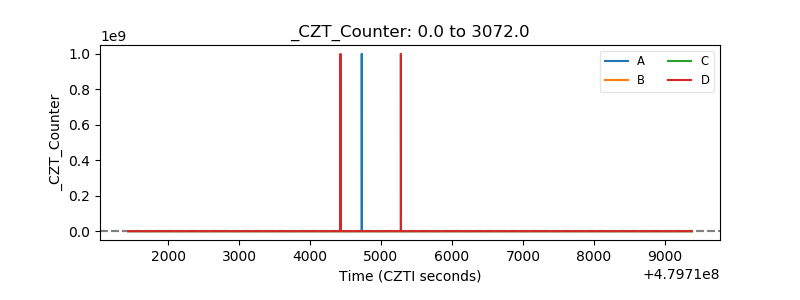 |
| +2.5 Volts monitor | 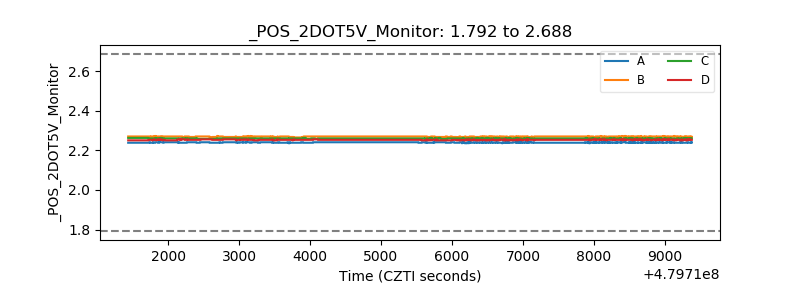 |
| +5 Volts monitor | 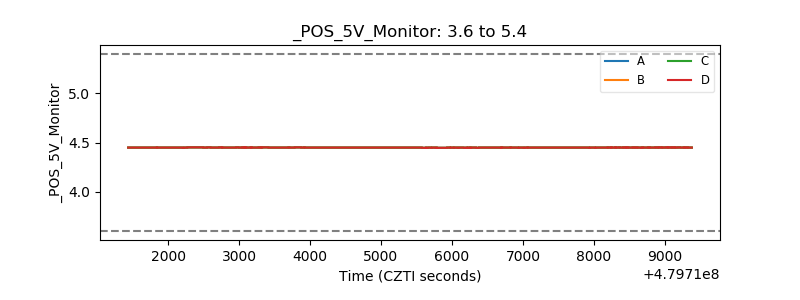 |
| _ROLL_ROT | 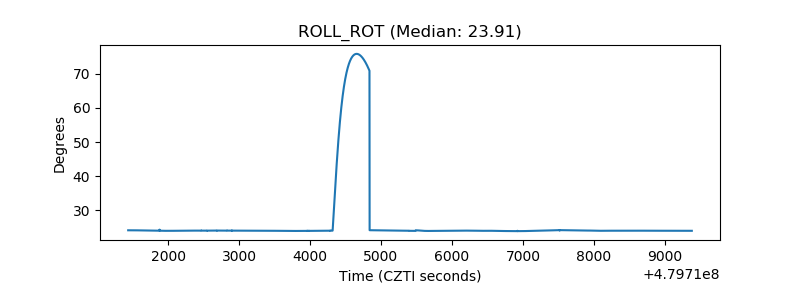 |
| _Roll_DEC | 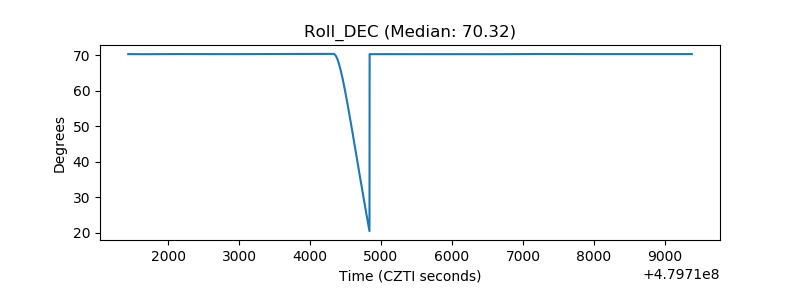 |
| _Roll_RA | 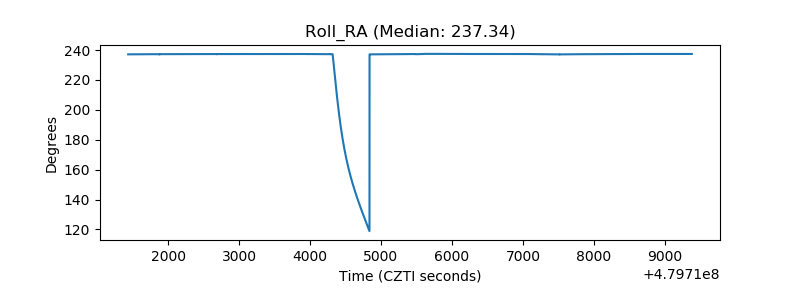 |
| Veto Counter | 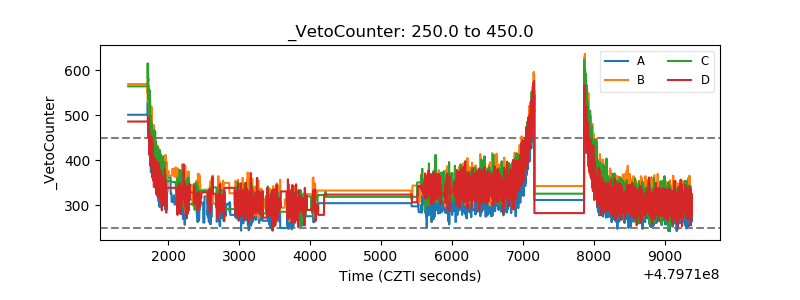 |