| Param | Original file | Final file |
|---|---|---|
| Filename | modeM0/AS1C07_001T01_9000006454_51180cztM0_level2.fits | modeM0/AS1C07_001T01_9000006454_51180cztM0_level2_quad_clean.evt |
| Size (bytes) | 776,652,480 | 103,449,600 |
| Size | 740.7 MB | 98.7 MB |
| Events in quadrant A | 7,716,308 | 644,548 |
| Events in quadrant B | 5,834,396 | 725,114 |
| Events in quadrant C | 9,182,875 | 614,623 |
| Events in quadrant D | 5,426,692 | 616,917 |
| Mode M0 | |||
|---|---|---|---|
| Quadrant | BADHDUFLAG | Total packets | Discarded packets |
| A | 0 | 28325 | 0 |
| B | 0 | 22619 | 0 |
| C | 0 | 32663 | 0 |
| D | 0 | 21499 | 0 |
| Mode SS | |||
|---|---|---|---|
| Quadrant | BADHDUFLAG | Total packets | Discarded packets |
| A | 0 | 154 | 0 |
| B | 0 | 154 | 0 |
| C | 0 | 154 | 0 |
| D | 0 | 154 | 0 |
| Quadrant | Total seconds | Saturated seconds | Saturation percentage |
|---|---|---|---|
| A | 7625 | 733 | 9.613115% |
| B | 7625 | 501 | 6.570492% |
| C | 7626 | 1129 | 14.804616% |
| D | 7626 | 395 | 5.179649% |
Noise dominated data is calculated using 1-second bins in cleaned event files. If a bin has >2000 counts, and if more than 50% of those come from <1% of pixels, then it is considered to be noise-dominated and hence unusable.
| Quadrant | # 1 sec bins | Bins with >0 counts | Bins with >2000 counts | High rate bins dominated by noise | Noise dominated (total time) | Noise dominated (detector-on time) | Marked lightcurve |
|---|---|---|---|---|---|---|---|
| A | 7625 | 7625 | 524 | 524 | 6.87% | 6.87% | 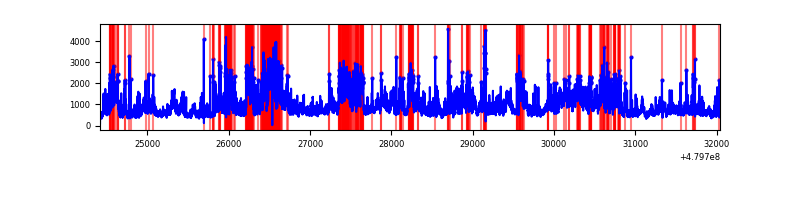 |
| B | 7625 | 7625 | 378 | 378 | 4.96% | 4.96% | 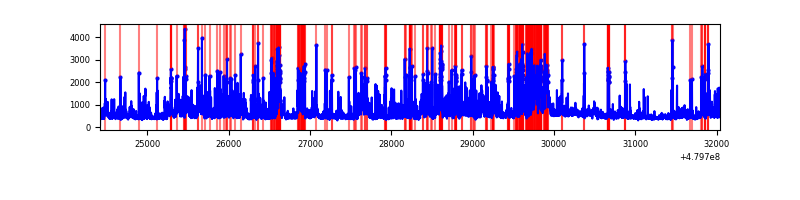 |
| C | 7626 | 7626 | 1099 | 1099 | 14.41% | 14.41% | 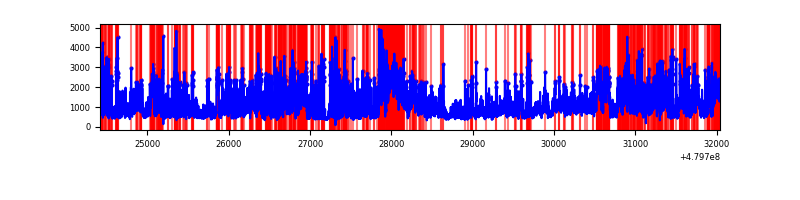 |
| D | 7626 | 7625 | 367 | 367 | 4.81% | 4.81% | 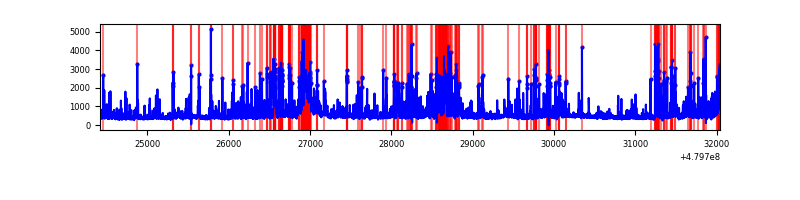 |
Top three noisy pixels from each quadrant. If the there are fewer than three noisy pixels in the level2.evt file, extra rows are filled as -1
| Pixel properties | Quadrant properties | ||||||
|---|---|---|---|---|---|---|---|
| Quadrant | DetID | PixID | Counts | Sigma | Mean | Median | Sigma |
| A | 12 | 3 | 1234148 | 6417.02 | 759 | 741 | 192.2 |
| A | 7 | 206 | 1110241 | 5772.38 | 759 | 741 | 192.2 |
| A | 9 | 160 | 561612 | 2918.03 | 759 | 741 | 192.2 |
| B | 5 | 172 | 667282 | 4108.61 | 761 | 736 | 162.2 |
| B | 10 | 60 | 543151 | 3343.47 | 761 | 736 | 162.2 |
| B | 8 | 128 | 336450 | 2069.35 | 761 | 736 | 162.2 |
| C | 4 | 12 | 2487002 | 12443.28 | 724 | 717 | 199.8 |
| C | 12 | 247 | 1551933 | 7763.48 | 724 | 717 | 199.8 |
| C | 4 | 13 | 941880 | 4710.3 | 724 | 717 | 199.8 |
| D | 3 | 12 | 493999 | 2378.79 | 734 | 706 | 207.4 |
| D | 12 | 2 | 413044 | 1988.4 | 734 | 706 | 207.4 |
| D | 8 | 176 | 384336 | 1849.96 | 734 | 706 | 207.4 |
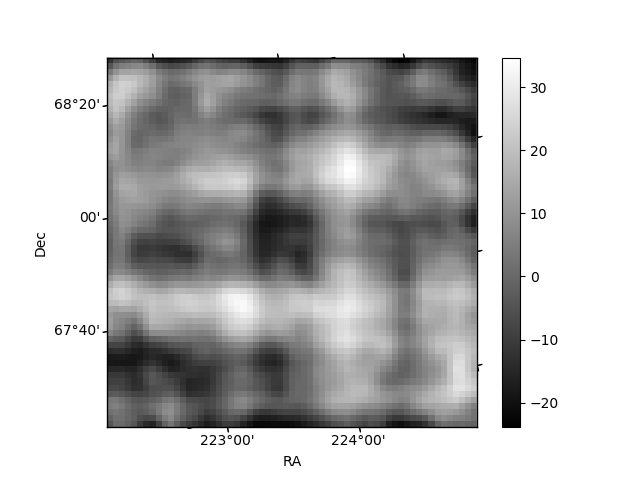
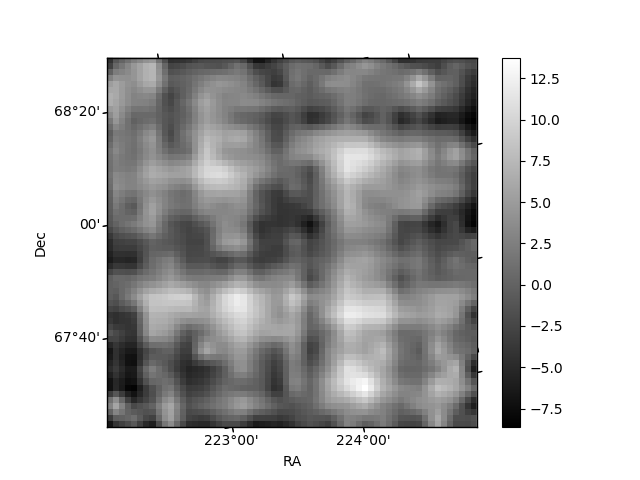
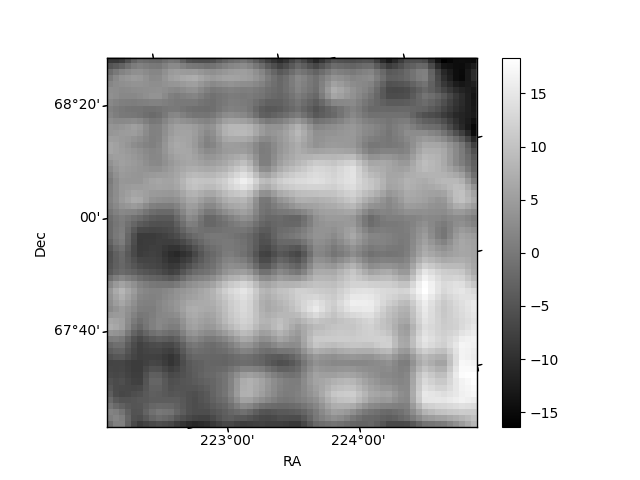
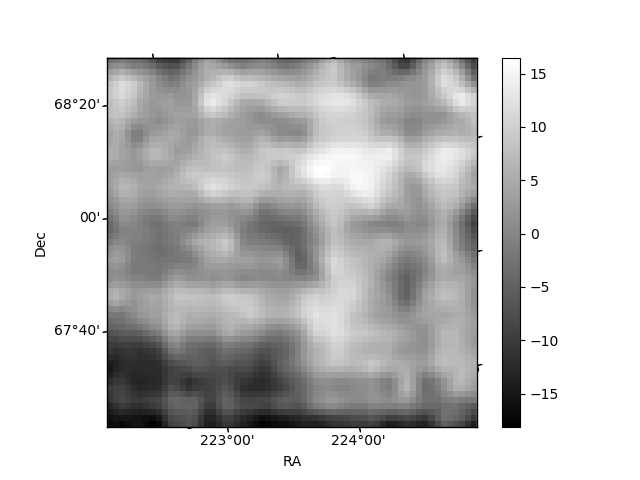
Histogram calculated using DETX and DETY for each event in the final _common_clean file
| Quadrant A | 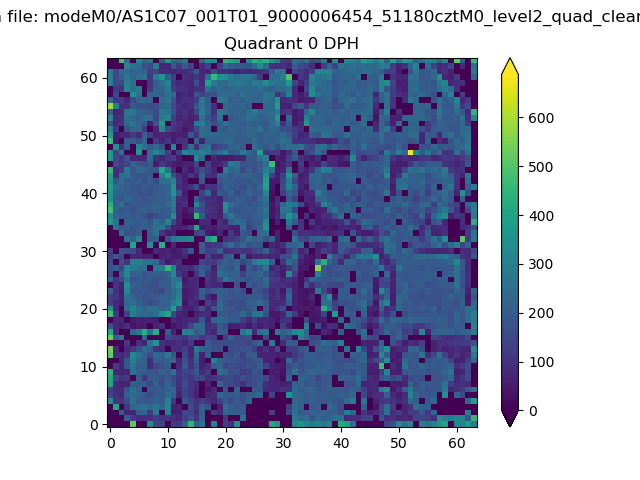 |
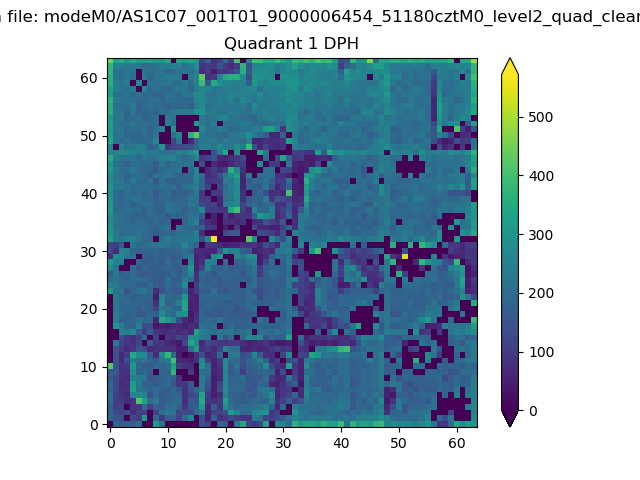 |
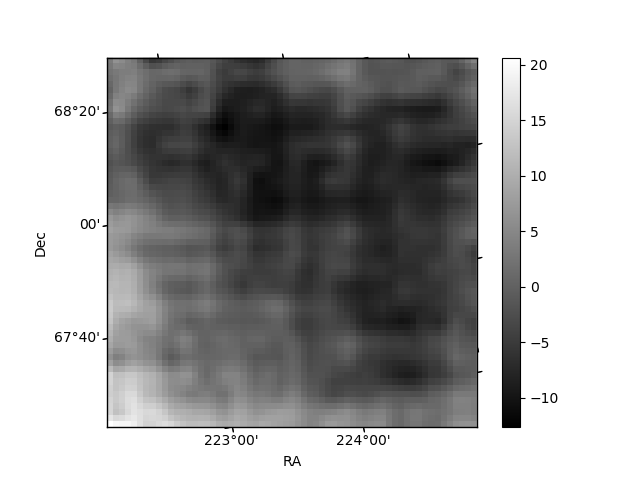
Quadrant B |
|---|---|---|---|
| Quadrant D | 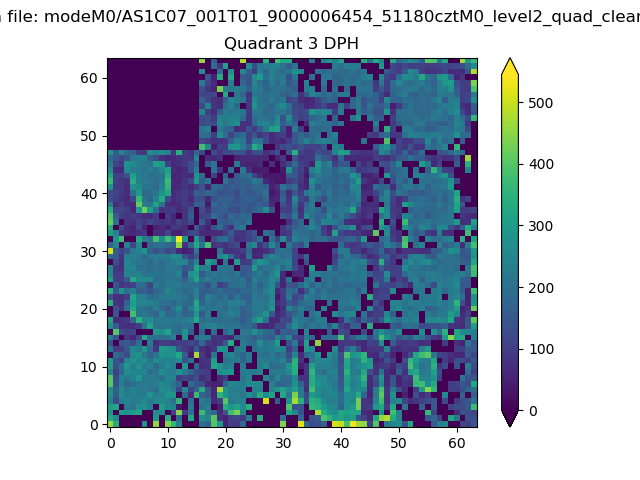 |
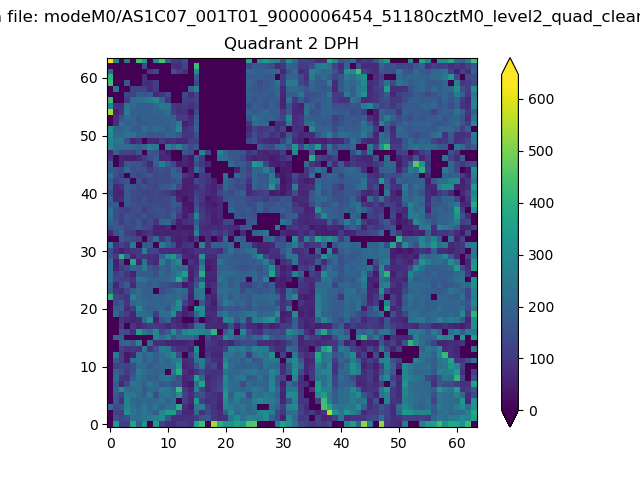 |
Quadrant C |
| Plot type | Count rate plots | Images |
|---|---|---|
| Comparison with Poisson distribution Blue bars denote a histogram of data divided into 1 sec bins. Red curve is a Poisson curve with rate = median count rate of data. |
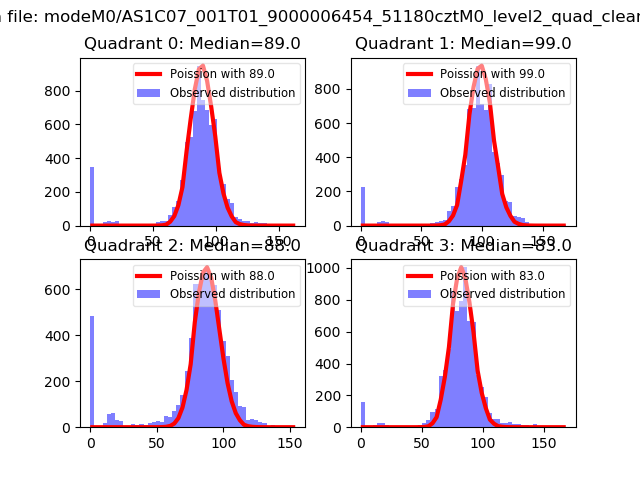 |
 |
| Quadrant-wise count rates Data is divided into 100 sec bins |
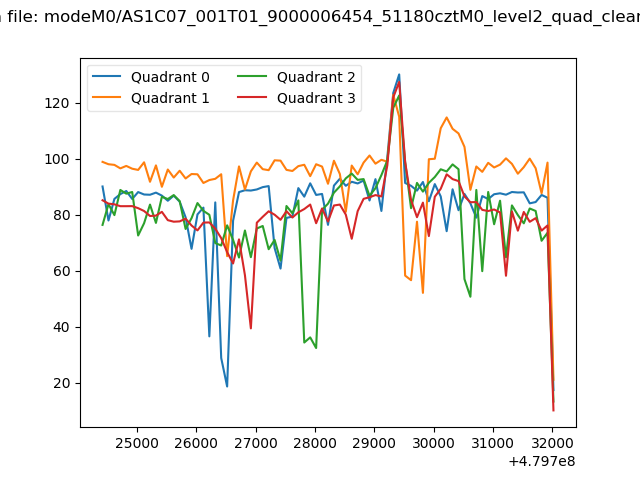 |
|
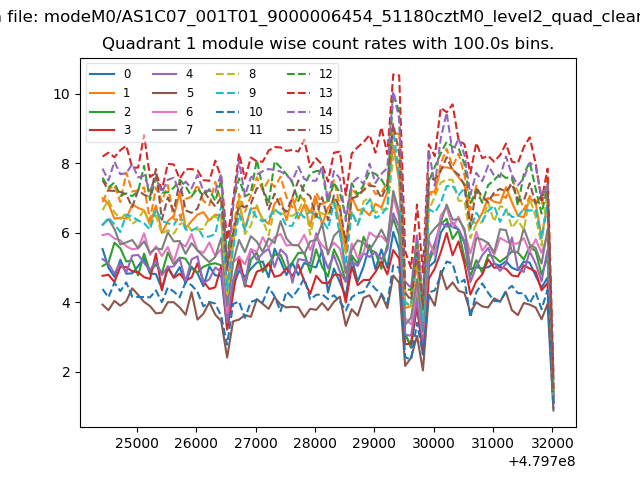
| Module-wise count rates for Quadrant A Data is divided into 100 sec bins |
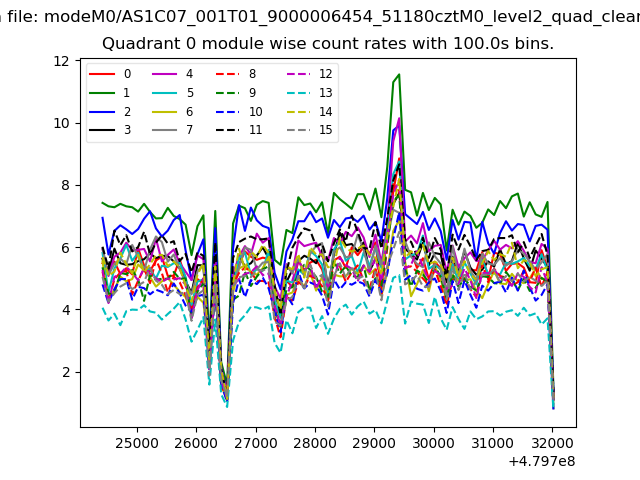 |
 |
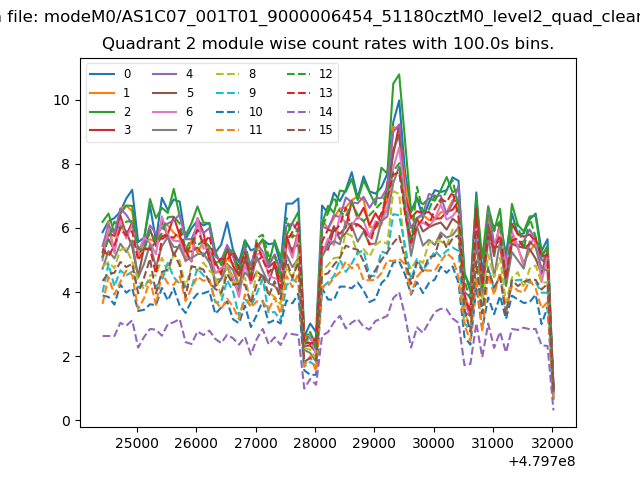
| Module-wise count rates for Quadrant B Data is divided into 100 sec bins |
 |
 |
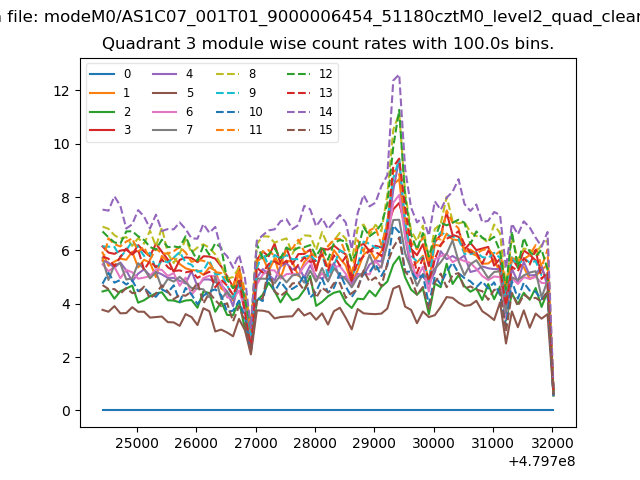
| Module-wise count rates for Quadrant C Data is divided into 100 sec bins |
 |
 |
| Module-wise count rates for Quadrant D Data is divided into 100 sec bins |
 |
 |
| Parameter | Plot |
|---|---|
| CZT HV Monitor |  |
| D_VDD | 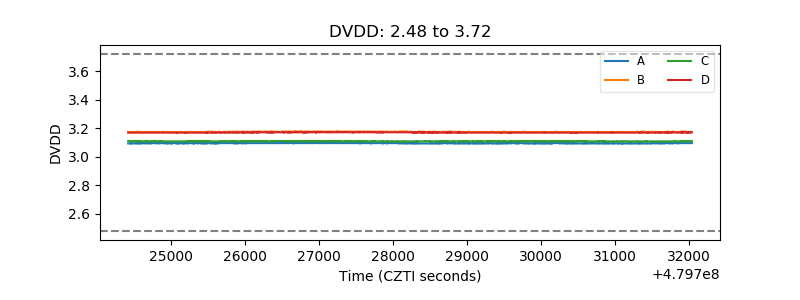 |
| Temperature 1 | 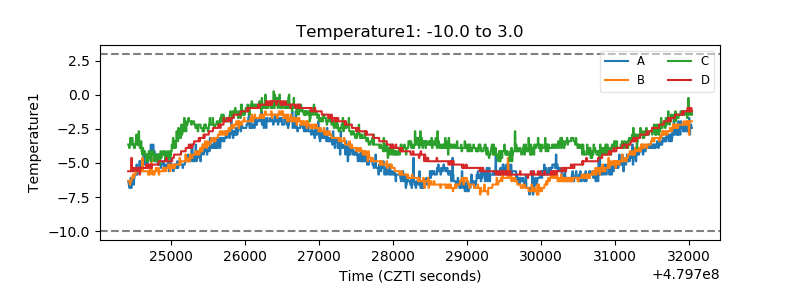 |
| Veto HV Monitor | 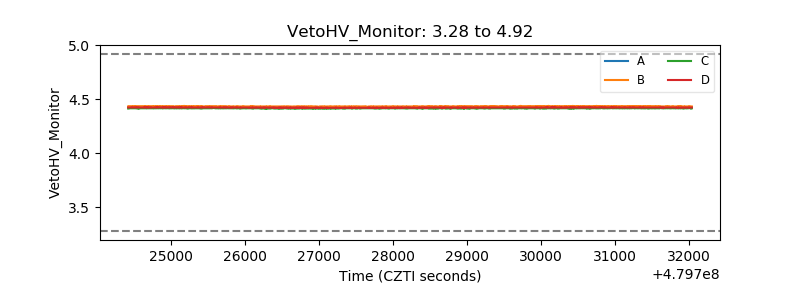 |
| Veto LLD | 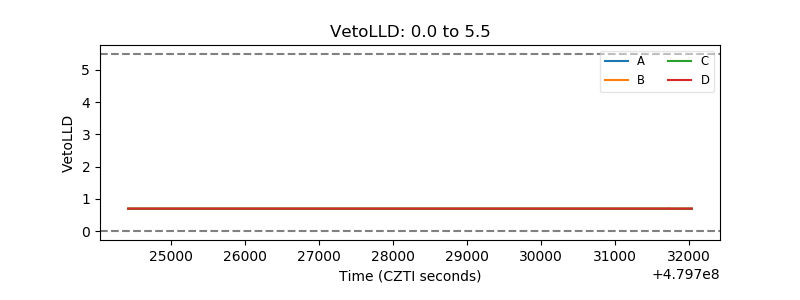 |
| Alpha Counter | 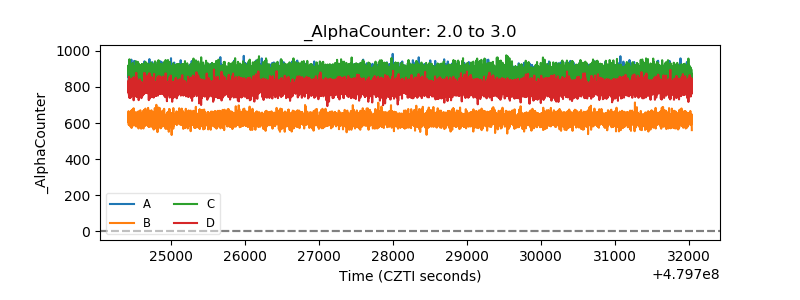 |
| _CPM_Rate | 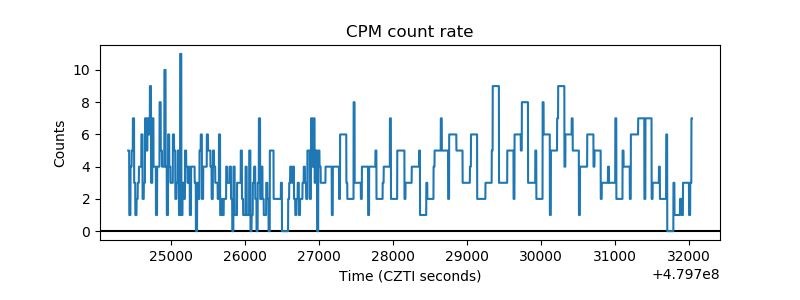 |
| CZT Counter | 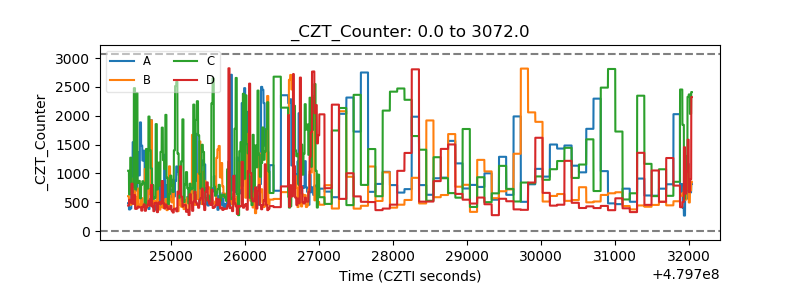 |
| +2.5 Volts monitor | 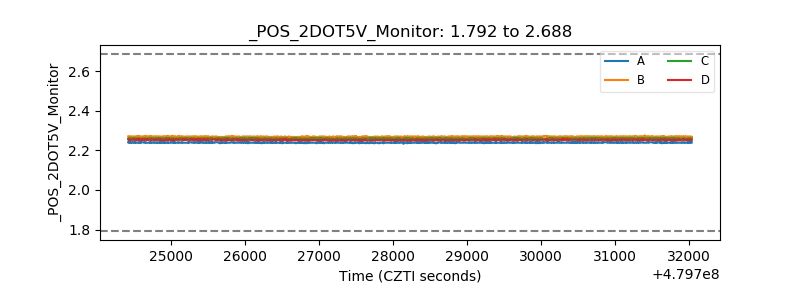 |
| +5 Volts monitor | 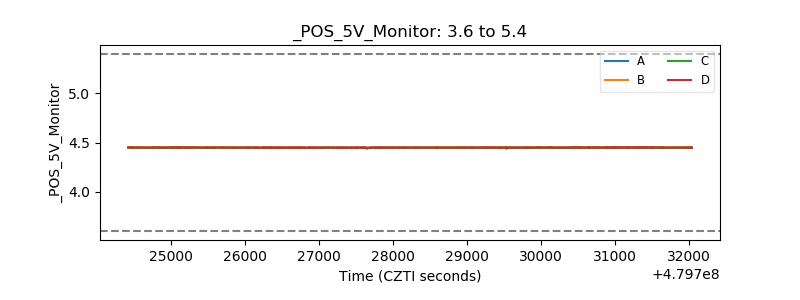 |
| _ROLL_ROT | 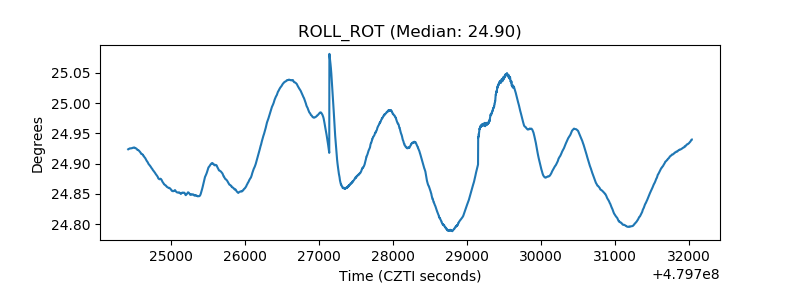 |
| _Roll_DEC | 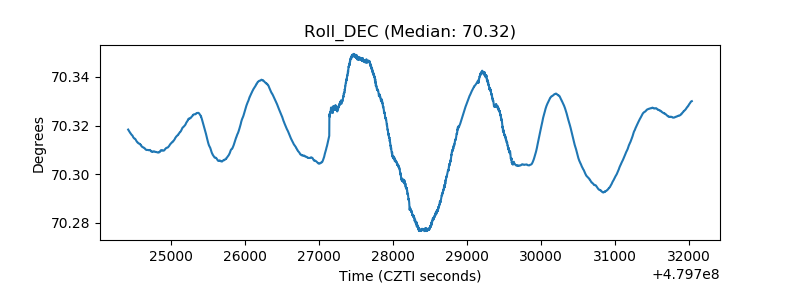 |
| _Roll_RA | 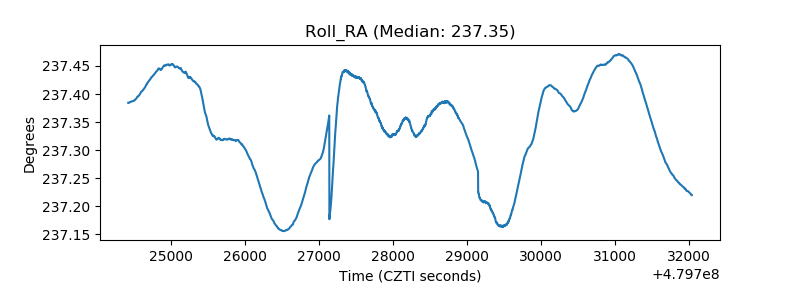 |
| Veto Counter | 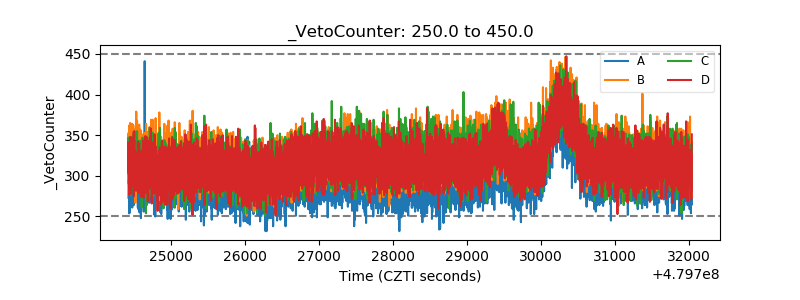 |