| Param | Original file | Final file |
|---|---|---|
| Filename | modeM0/AS1C07_001T01_9000006454_51181cztM0_level2.fits | modeM0/AS1C07_001T01_9000006454_51181cztM0_level2_quad_clean.evt |
| Size (bytes) | 773,928,000 | 104,258,880 |
| Size | 738.1 MB | 99.4 MB |
| Events in quadrant A | 6,039,614 | 695,074 |
| Events in quadrant B | 5,503,002 | 734,841 |
| Events in quadrant C | 8,744,965 | 623,460 |
| Events in quadrant D | 7,761,184 | 563,831 |
| Mode M0 | |||
|---|---|---|---|
| Quadrant | BADHDUFLAG | Total packets | Discarded packets |
| A | 0 | 23298 | 0 |
| B | 0 | 21709 | 0 |
| C | 0 | 31467 | 0 |
| D | 0 | 28465 | 0 |
| Mode SS | |||
|---|---|---|---|
| Quadrant | BADHDUFLAG | Total packets | Discarded packets |
| A | 0 | 154 | 0 |
| B | 0 | 154 | 0 |
| C | 0 | 154 | 0 |
| D | 0 | 154 | 0 |
| Quadrant | Total seconds | Saturated seconds | Saturation percentage |
|---|---|---|---|
| A | 7756 | 270 | 3.481176% |
| B | 7757 | 495 | 6.381333% |
| C | 7757 | 1024 | 13.200980% |
| D | 7757 | 1131 | 14.580379% |
Noise dominated data is calculated using 1-second bins in cleaned event files. If a bin has >2000 counts, and if more than 50% of those come from <1% of pixels, then it is considered to be noise-dominated and hence unusable.
| Quadrant | # 1 sec bins | Bins with >0 counts | Bins with >2000 counts | High rate bins dominated by noise | Noise dominated (total time) | Noise dominated (detector-on time) | Marked lightcurve |
|---|---|---|---|---|---|---|---|
| A | 7755 | 7755 | 160 | 160 | 2.06% | 2.06% | 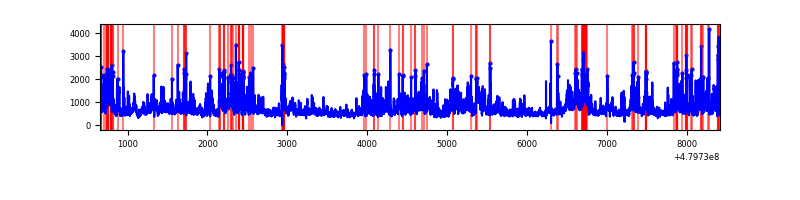 |
| B | 7757 | 7757 | 301 | 301 | 3.88% | 3.88% | 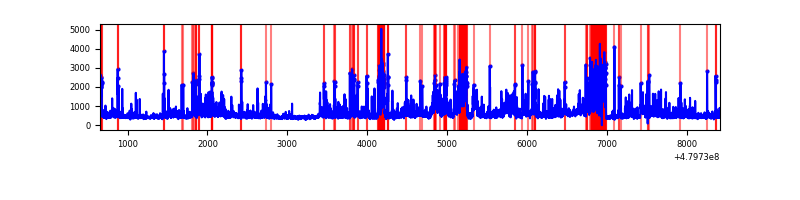 |
| C | 7757 | 7757 | 936 | 936 | 12.07% | 12.07% | 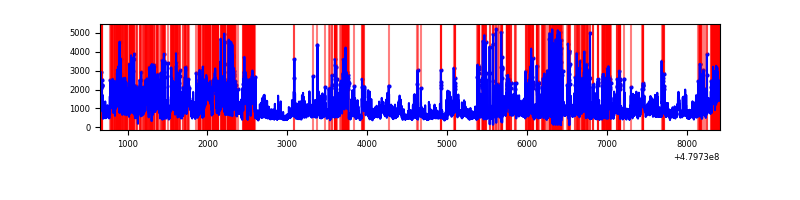 |
| D | 7757 | 7757 | 1100 | 1100 | 14.18% | 14.18% | 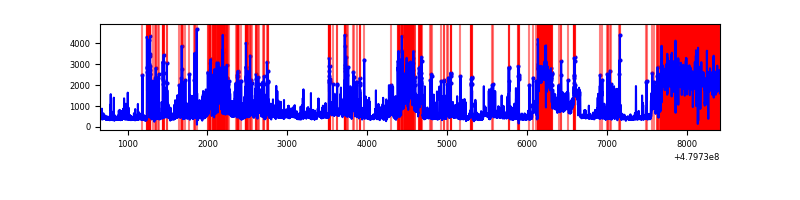 |
Top three noisy pixels from each quadrant. If the there are fewer than three noisy pixels in the level2.evt file, extra rows are filled as -1
| Pixel properties | Quadrant properties | ||||||
|---|---|---|---|---|---|---|---|
| Quadrant | DetID | PixID | Counts | Sigma | Mean | Median | Sigma |
| A | 12 | 3 | 726547 | 3647.4 | 798 | 778 | 199.0 |
| A | 9 | 160 | 512629 | 2572.34 | 798 | 778 | 199.0 |
| A | 14 | 254 | 303238 | 1520.03 | 798 | 778 | 199.0 |
| B | 12 | 32 | 699253 | 4177.03 | 780 | 754 | 167.2 |
| B | 10 | 60 | 392348 | 2341.74 | 780 | 754 | 167.2 |
| B | 4 | 171 | 223566 | 1332.42 | 780 | 754 | 167.2 |
| C | 12 | 247 | 2068285 | 10055.27 | 743 | 738 | 205.6 |
| C | 4 | 12 | 1186012 | 5764.44 | 743 | 738 | 205.6 |
| C | 4 | 13 | 788371 | 3830.56 | 743 | 738 | 205.6 |
| D | 2 | 62 | 1611928 | 7772.76 | 733 | 705 | 207.3 |
| D | 7 | 60 | 788777 | 3801.77 | 733 | 705 | 207.3 |
| D | 3 | 12 | 438227 | 2110.67 | 733 | 705 | 207.3 |
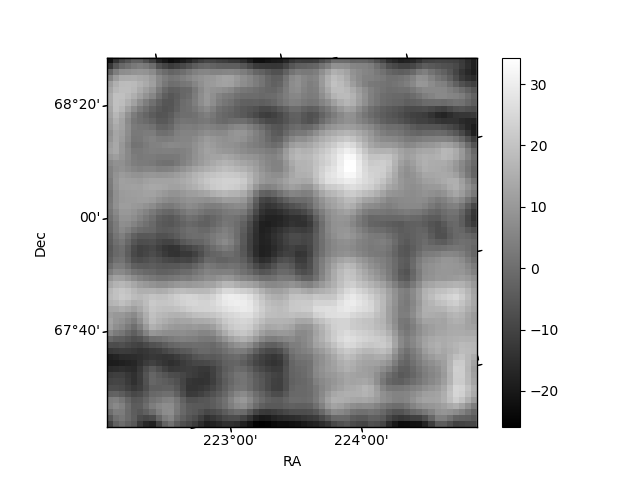
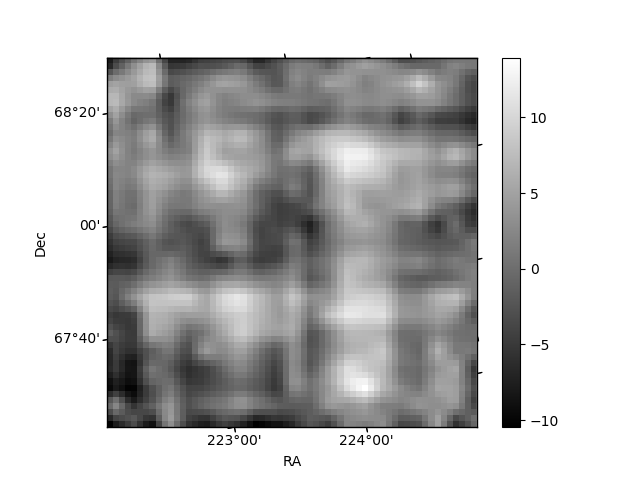
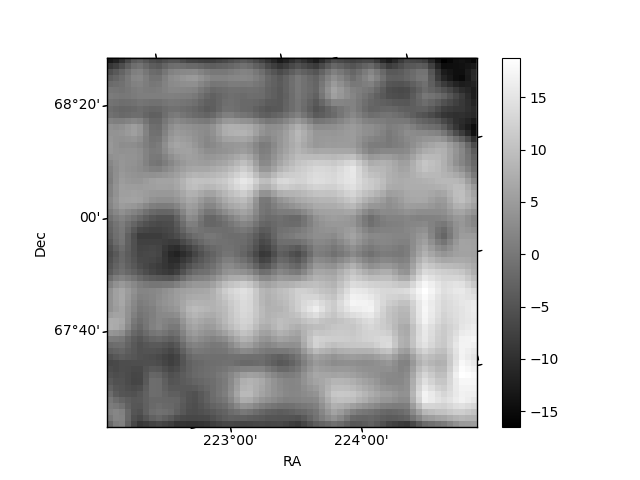
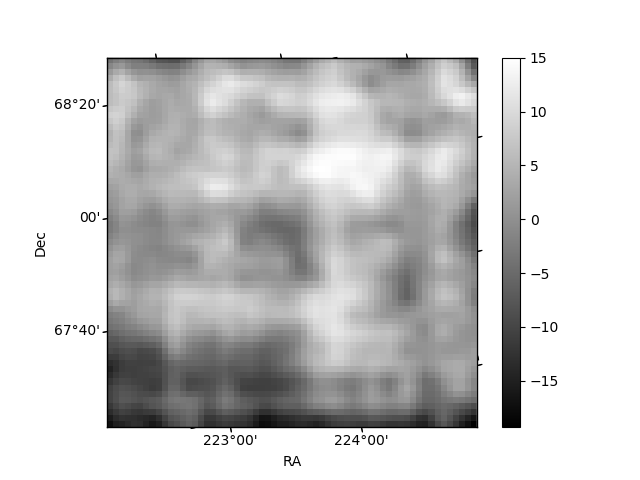
Histogram calculated using DETX and DETY for each event in the final _common_clean file
| Quadrant A | 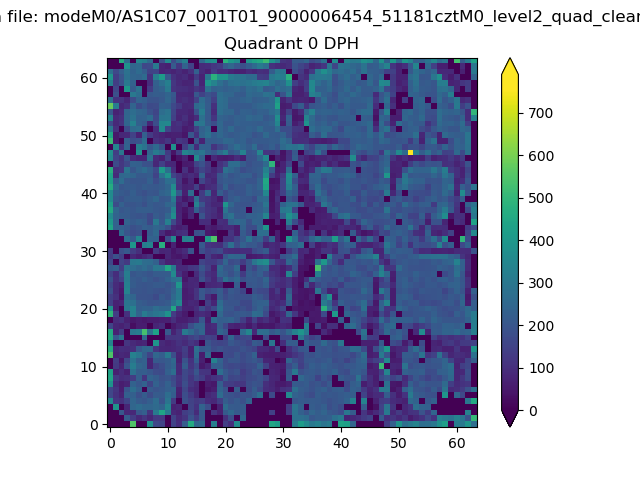 |
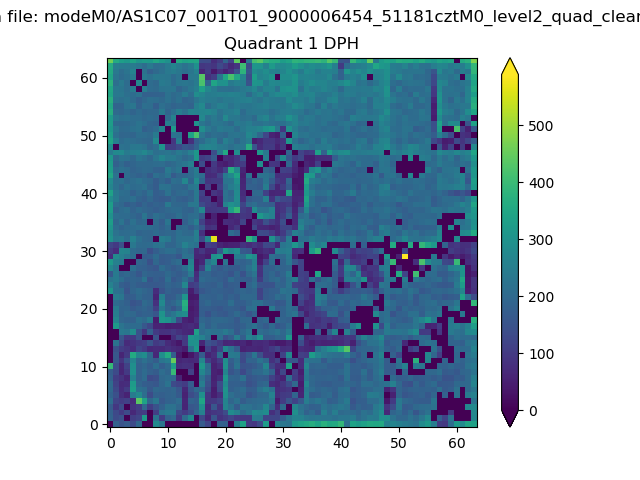 |
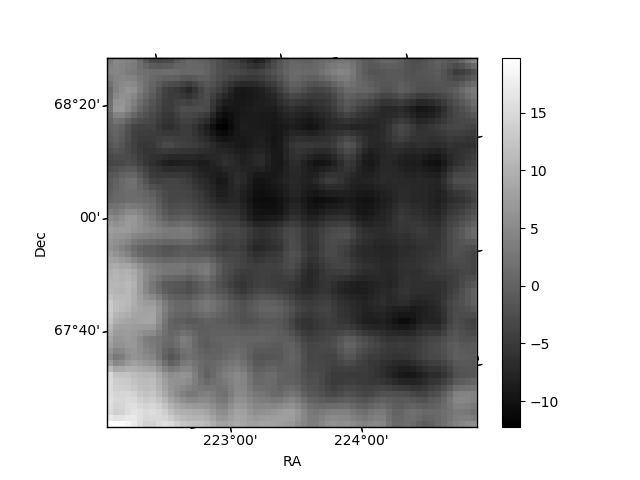
Quadrant B |
|---|---|---|---|
| Quadrant D | 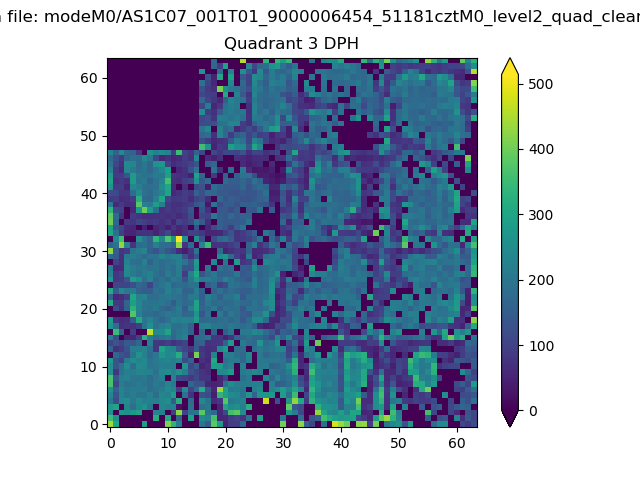 |
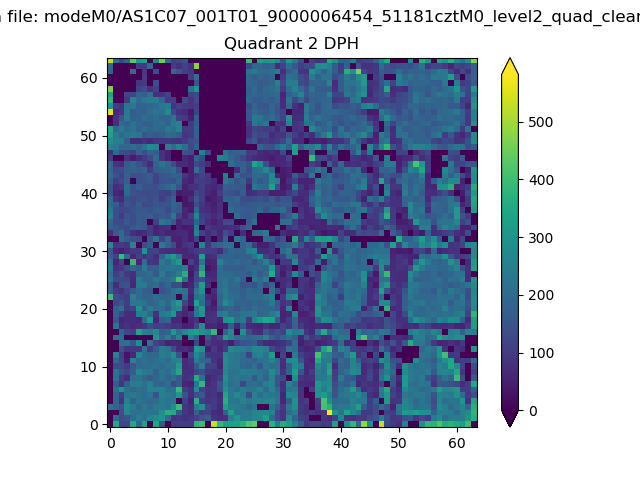 |
Quadrant C |
| Plot type | Count rate plots | Images |
|---|---|---|
| Comparison with Poisson distribution Blue bars denote a histogram of data divided into 1 sec bins. Red curve is a Poisson curve with rate = median count rate of data. |
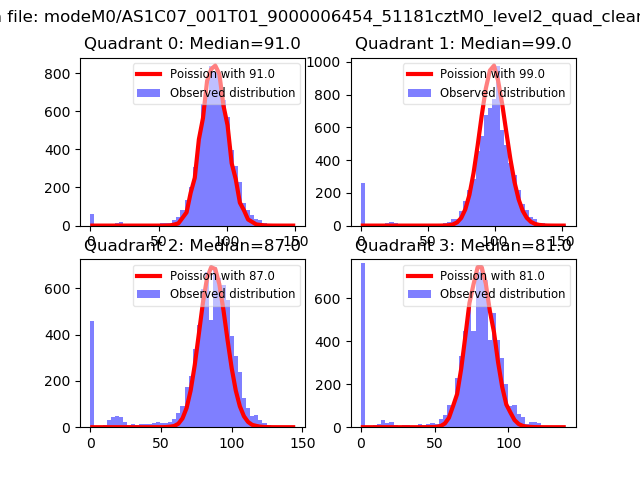 |
 |
| Quadrant-wise count rates Data is divided into 100 sec bins |
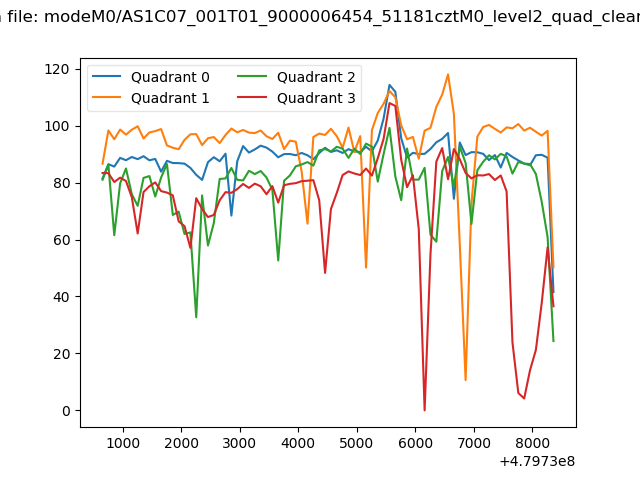 |
|
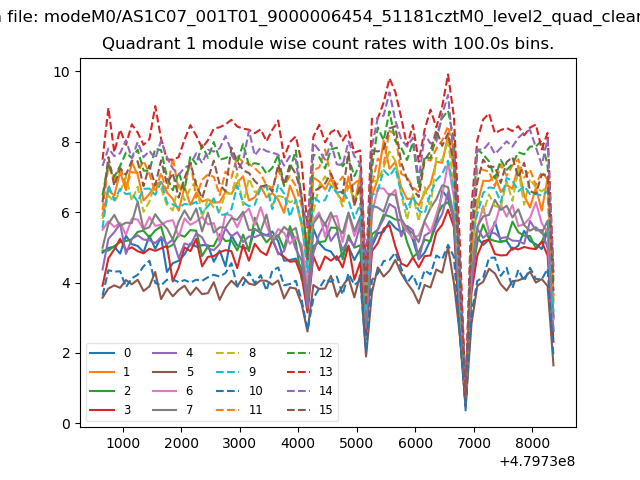
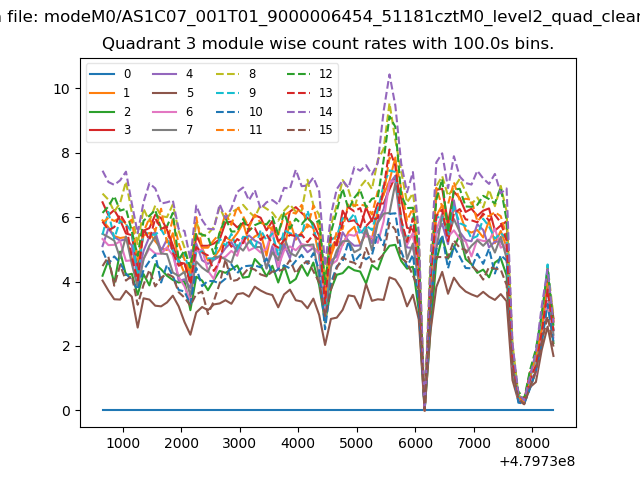
| Module-wise count rates for Quadrant A Data is divided into 100 sec bins |
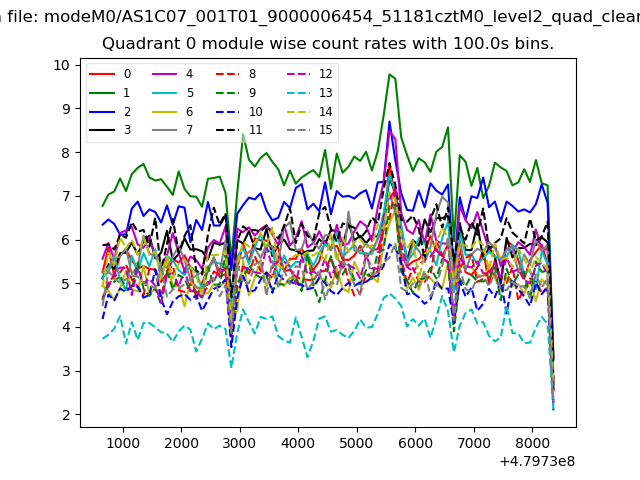 |
 |
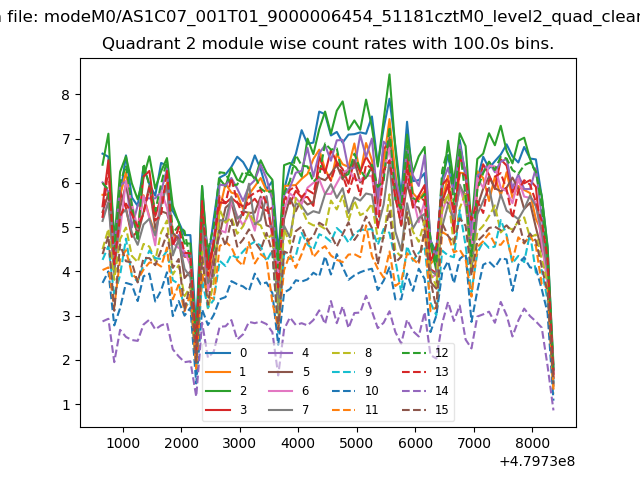
| Module-wise count rates for Quadrant B Data is divided into 100 sec bins |
 |
 |
| Module-wise count rates for Quadrant C Data is divided into 100 sec bins |
 |
 |
| Module-wise count rates for Quadrant D Data is divided into 100 sec bins |
 |
 |
| Parameter | Plot |
|---|---|
| CZT HV Monitor |  |
| D_VDD | 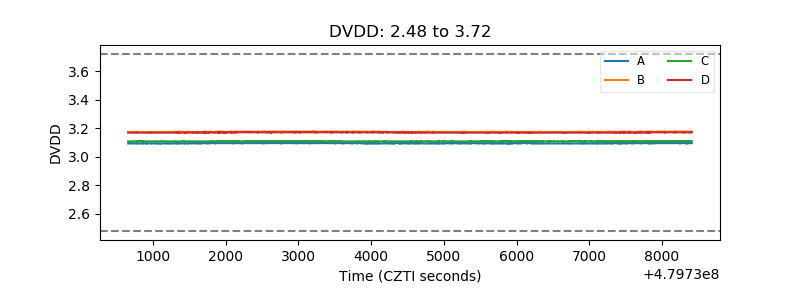 |
| Temperature 1 | 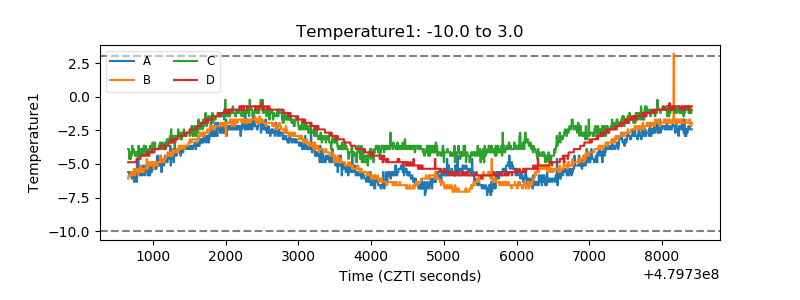 |
| Veto HV Monitor | 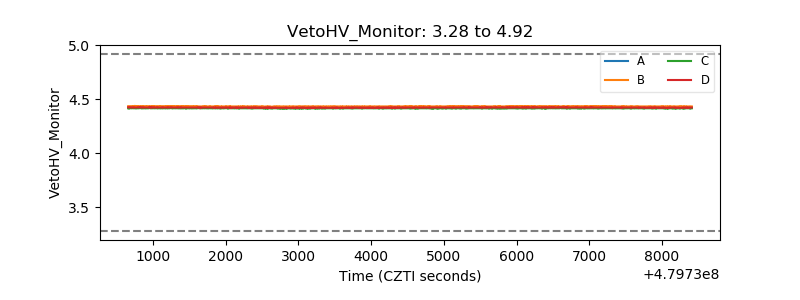 |
| Veto LLD | 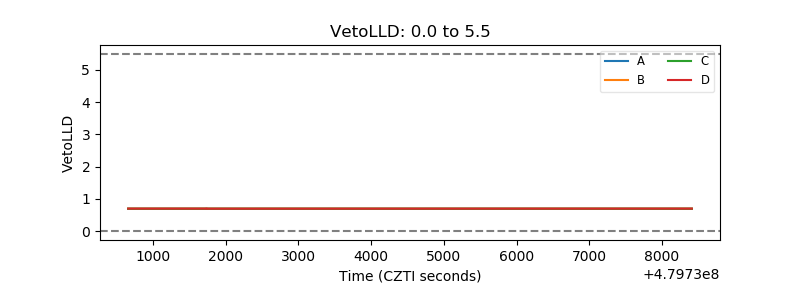 |
| Alpha Counter | 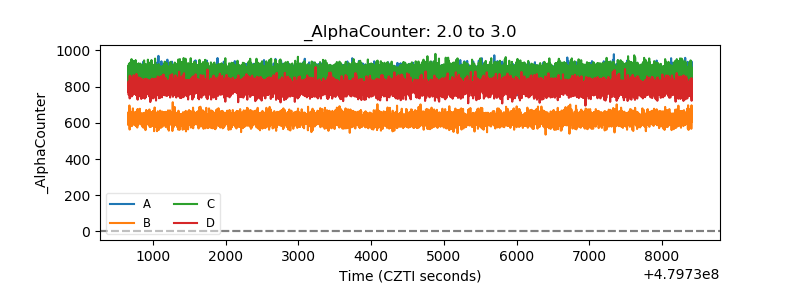 |
| _CPM_Rate | 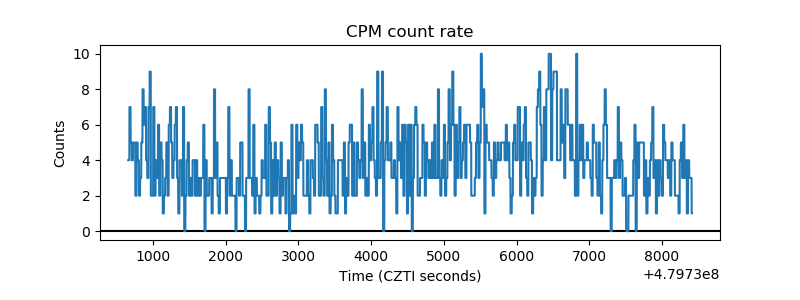 |
| CZT Counter | 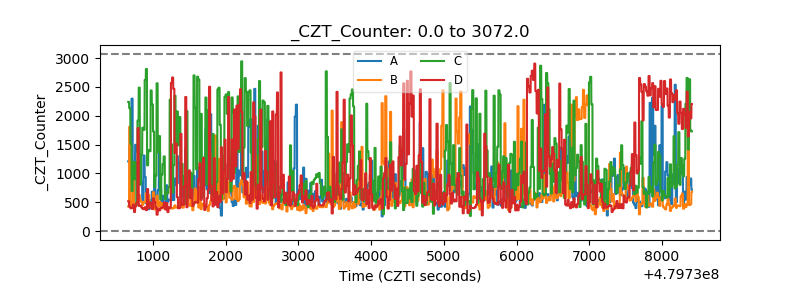 |
| +2.5 Volts monitor | 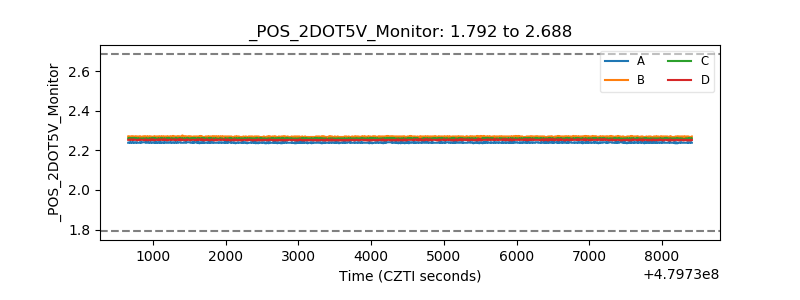 |
| +5 Volts monitor | 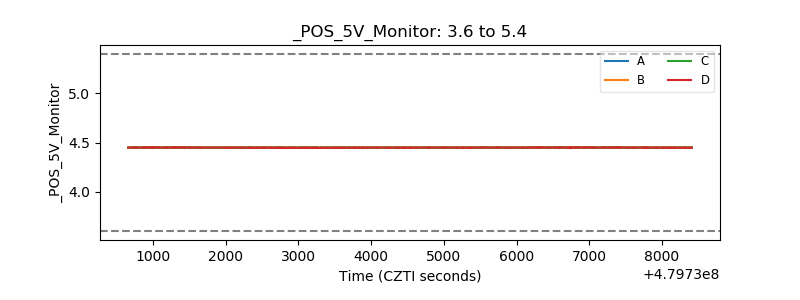 |
| _ROLL_ROT | 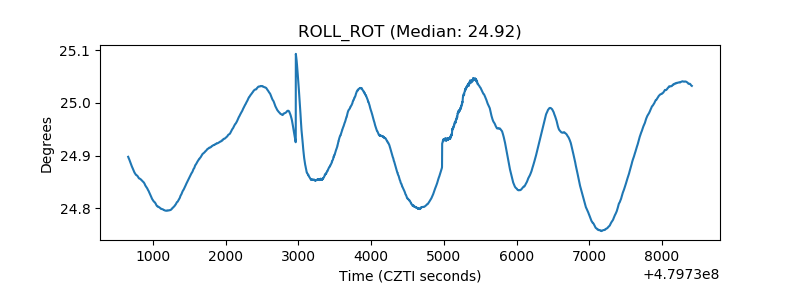 |
| _Roll_DEC | 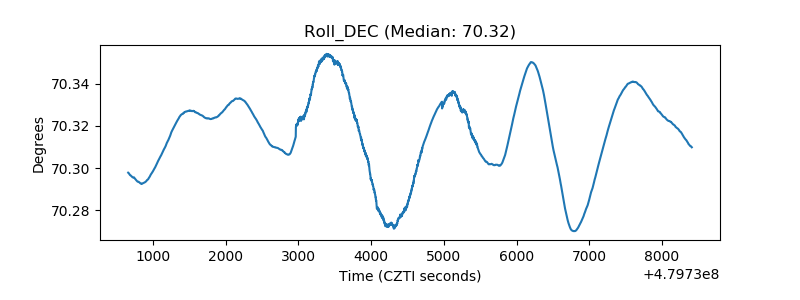 |
| _Roll_RA | 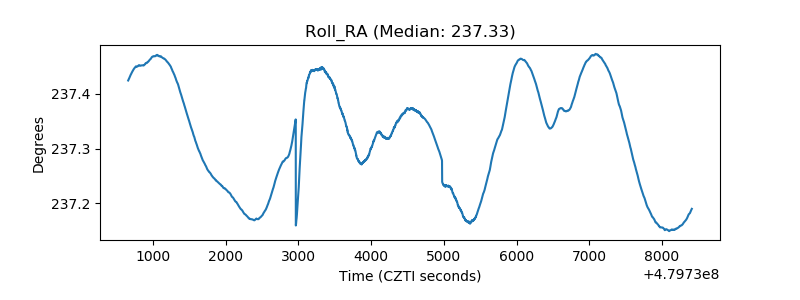 |
| Veto Counter | 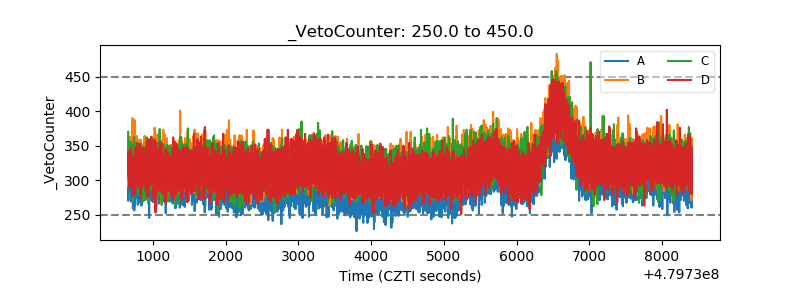 |