| Param | Original file | Final file |
|---|---|---|
| Filename | modeM0/AS1C07_001T01_9000006454_51184cztM0_level2.fits | modeM0/AS1C07_001T01_9000006454_51184cztM0_level2_quad_clean.evt |
| Size (bytes) | 2,309,757,120 | 215,208,000 |
| Size | 2.2 GB | 205.2 MB |
| Events in quadrant A | 14,526,038 | 1,572,080 |
| Events in quadrant B | 15,456,427 | 1,640,218 |
| Events in quadrant C | 34,675,076 | 770,744 |
| Events in quadrant D | 19,434,180 | 1,270,966 |
| Mode M0 | |||
|---|---|---|---|
| Quadrant | BADHDUFLAG | Total packets | Discarded packets |
| A | 0 | 55622 | 2 |
| B | 0 | 58464 | 3 |
| C | 0 | 115546 | 2 |
| D | 0 | 70544 | 2 |
| Mode SS | |||
|---|---|---|---|
| Quadrant | BADHDUFLAG | Total packets | Discarded packets |
| A | 0 | 370 | 0 |
| B | 0 | 370 | 0 |
| C | 0 | 370 | 0 |
| D | 0 | 370 | 0 |
| Mode M9 | |||
|---|---|---|---|
| Quadrant | BADHDUFLAG | Total packets | Discarded packets |
| A | 0 | 10 | 0 |
| B | 0 | 10 | 0 |
| C | 0 | 10 | 0 |
| D | 0 | 10 | 0 |
| Quadrant | Total seconds | Saturated seconds | Saturation percentage |
|---|---|---|---|
| A | 18286 | 1285 | 7.027234% |
| B | 18286 | 2056 | 11.243574% |
| C | 18286 | 10227 | 55.928032% |
| D | 18286 | 3083 | 16.859893% |
Noise dominated data is calculated using 1-second bins in cleaned event files. If a bin has >2000 counts, and if more than 50% of those come from <1% of pixels, then it is considered to be noise-dominated and hence unusable.
| Quadrant | # 1 sec bins | Bins with >0 counts | Bins with >2000 counts | High rate bins dominated by noise | Noise dominated (total time) | Noise dominated (detector-on time) | Marked lightcurve |
|---|---|---|---|---|---|---|---|
| A | 19381 | 18288 | 778 | 778 | 4.01% | 4.25% | 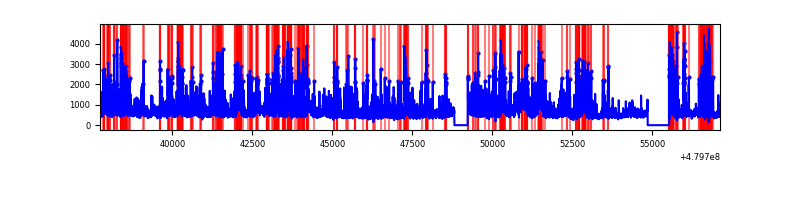 |
| B | 19381 | 18288 | 1139 | 1139 | 5.88% | 6.23% | 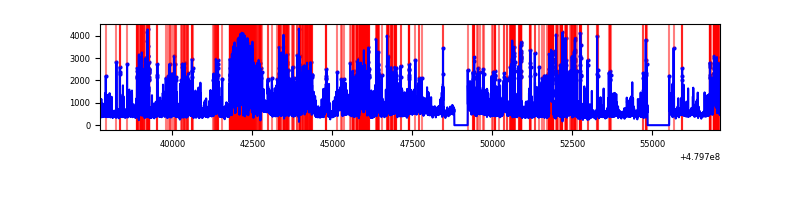 |
| C | 19381 | 18285 | 9496 | 9496 | 49.00% | 51.93% | 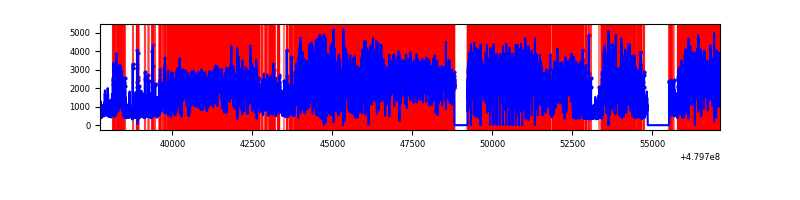 |
| D | 19381 | 18288 | 2630 | 2630 | 13.57% | 14.38% |  |
Top three noisy pixels from each quadrant. If the there are fewer than three noisy pixels in the level2.evt file, extra rows are filled as -1
| Pixel properties | Quadrant properties | ||||||
|---|---|---|---|---|---|---|---|
| Quadrant | DetID | PixID | Counts | Sigma | Mean | Median | Sigma |
| A | 13 | 248 | 1281107 | 2724.2 | 1887 | 1838 | 469.6 |
| A | 12 | 3 | 1254883 | 2668.36 | 1887 | 1838 | 469.6 |
| A | 14 | 254 | 1045787 | 2223.09 | 1887 | 1838 | 469.6 |
| B | 5 | 172 | 1755997 | 4523.09 | 1832 | 1767 | 387.8 |
| B | 12 | 32 | 1690008 | 4352.95 | 1832 | 1767 | 387.8 |
| B | 10 | 60 | 1012462 | 2605.97 | 1832 | 1767 | 387.8 |
| C | 12 | 247 | 17115082 | 45387.92 | 1371 | 1361 | 377.1 |
| C | 4 | 12 | 3414758 | 9052.79 | 1371 | 1361 | 377.1 |
| C | 10 | 69 | 3113042 | 8252.6 | 1371 | 1361 | 377.1 |
| D | 2 | 62 | 2415318 | 4914.95 | 1760 | 1705 | 491.1 |
| D | 3 | 12 | 2311930 | 4704.42 | 1760 | 1705 | 491.1 |
| D | 7 | 126 | 1553610 | 3160.21 | 1760 | 1705 | 491.1 |
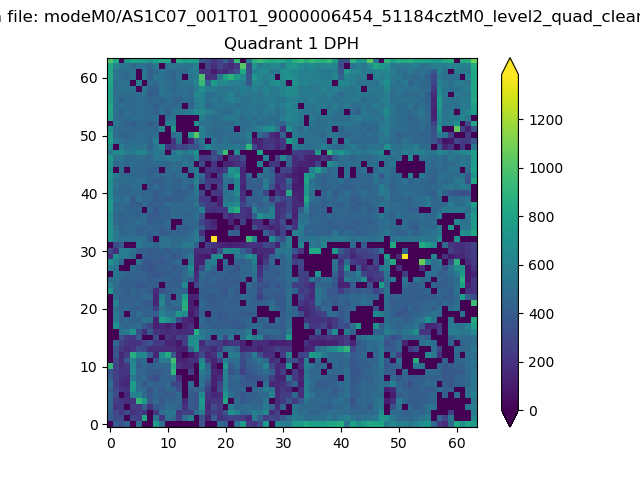
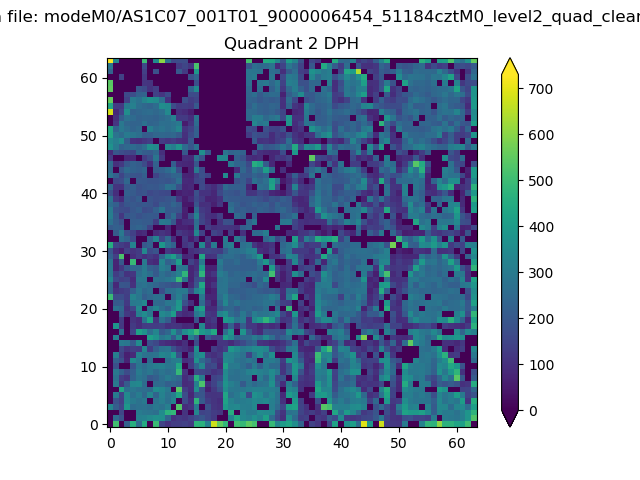
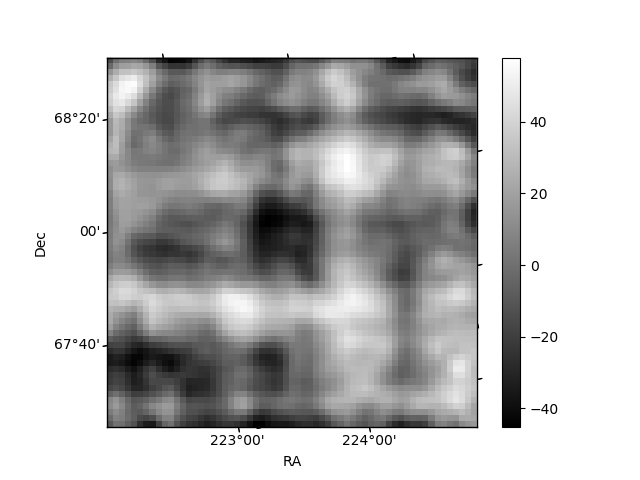
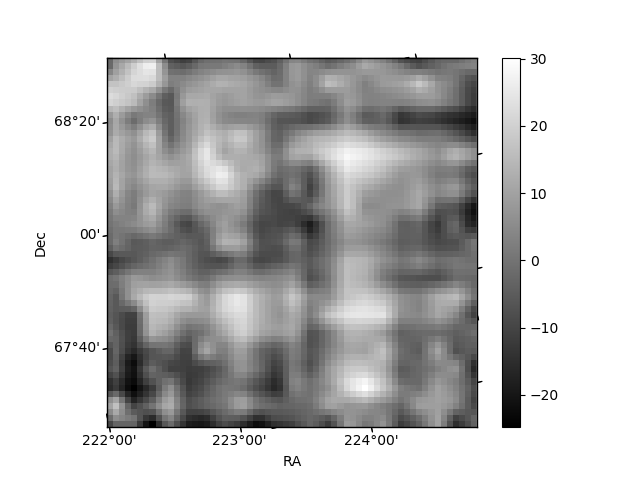
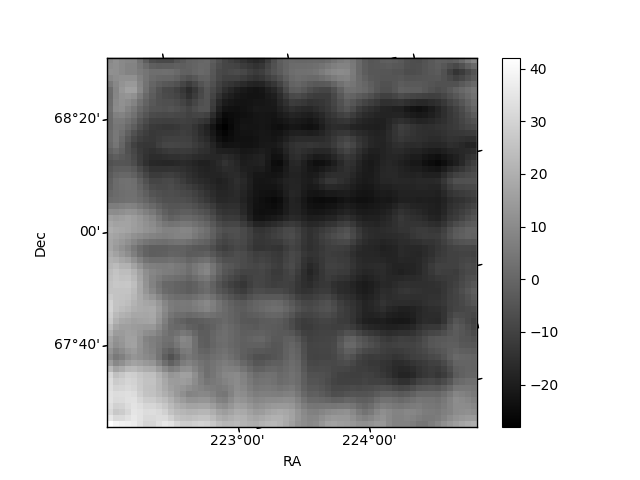
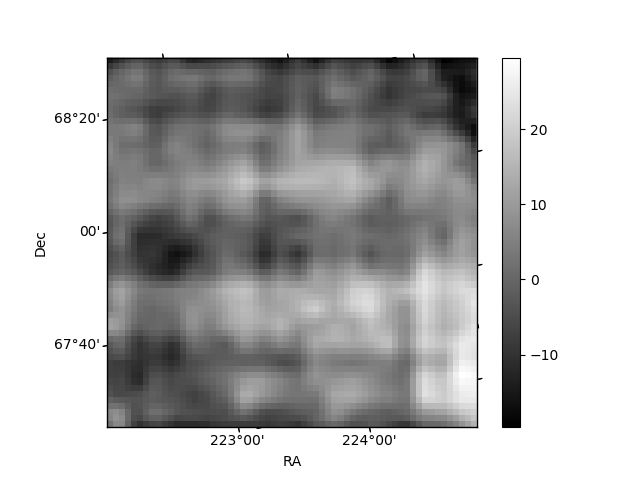
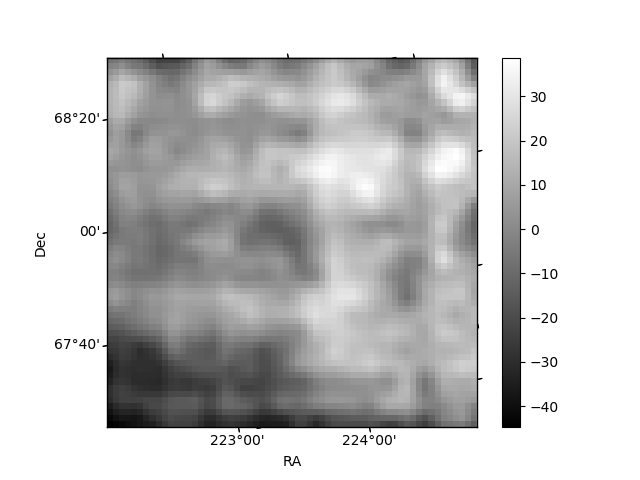
Histogram calculated using DETX and DETY for each event in the final _common_clean file
| Quadrant A | 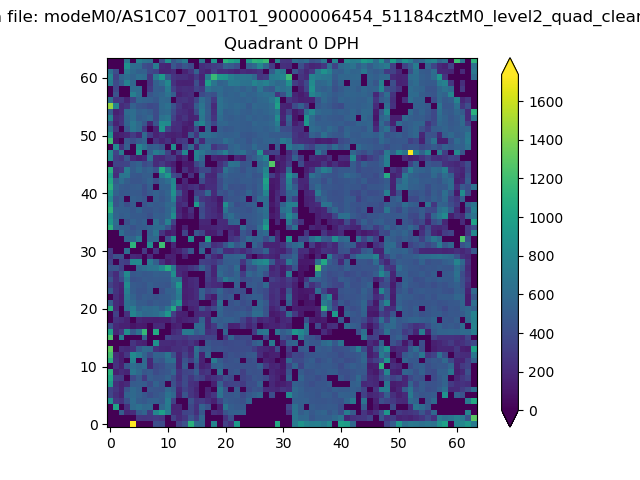 |
 |
Quadrant B |
|---|---|---|---|
| Quadrant D | 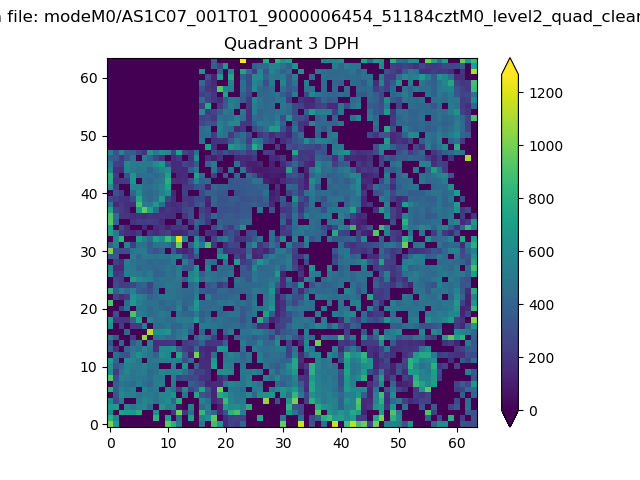 |
 |
Quadrant C |
| Plot type | Count rate plots | Images |
|---|---|---|
| Comparison with Poisson distribution Blue bars denote a histogram of data divided into 1 sec bins. Red curve is a Poisson curve with rate = median count rate of data. |
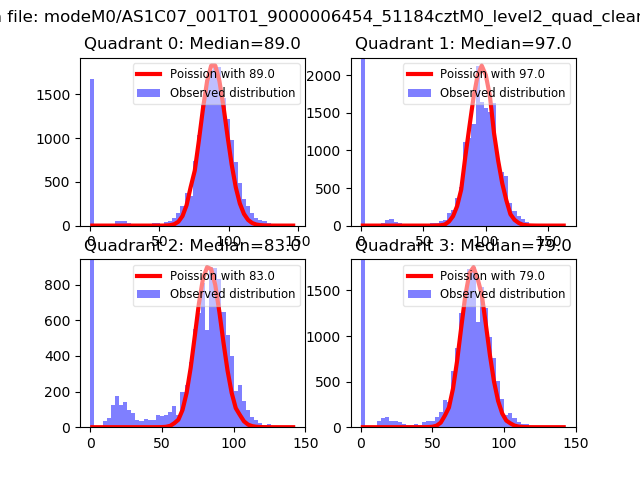 |
 |
| Quadrant-wise count rates Data is divided into 100 sec bins |
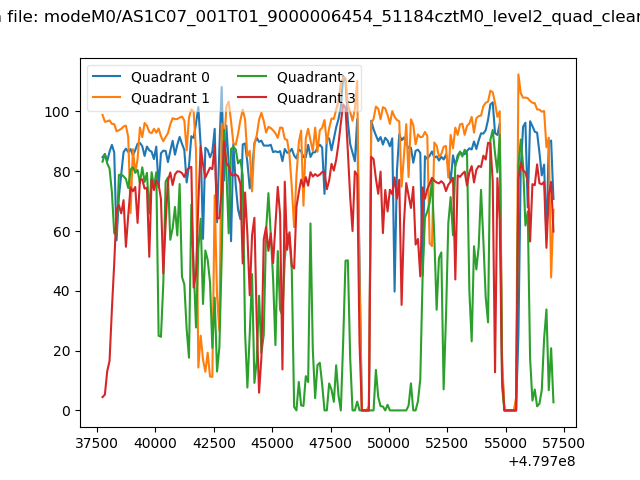 |
|
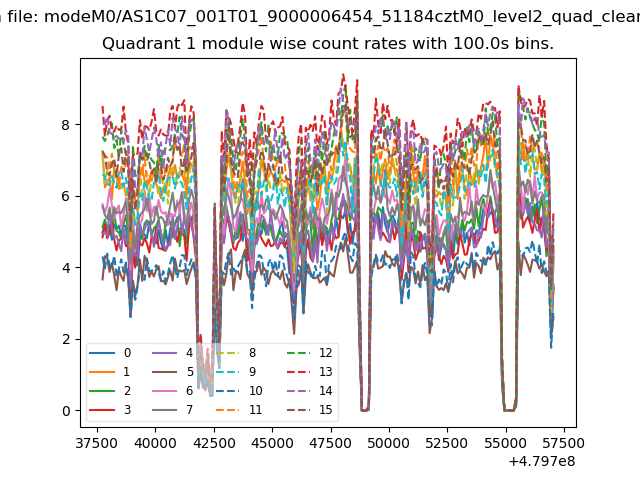
| Module-wise count rates for Quadrant A Data is divided into 100 sec bins |
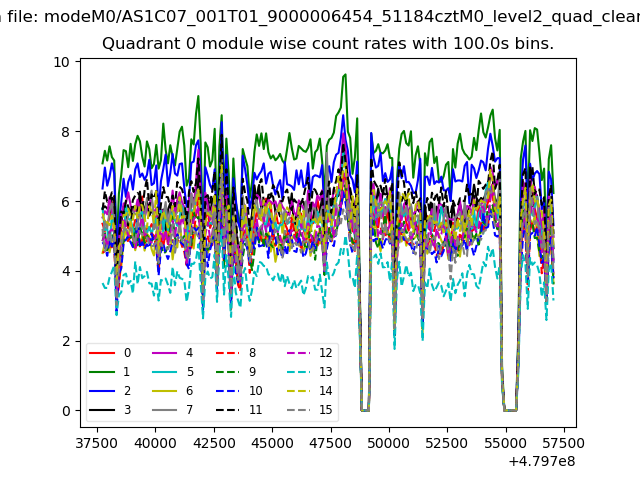 |
 |
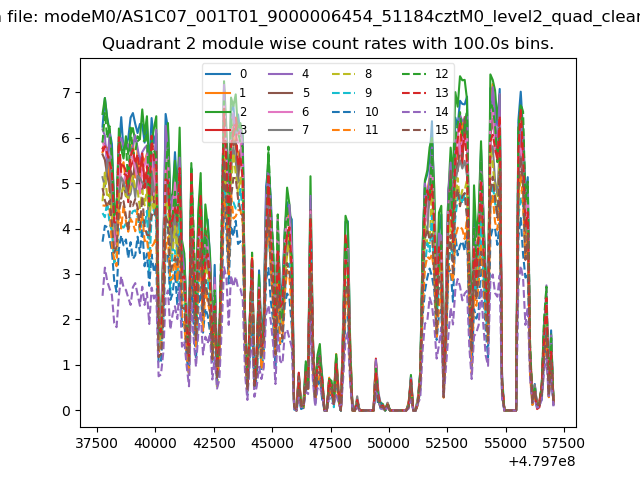
| Module-wise count rates for Quadrant B Data is divided into 100 sec bins |
 |
 |
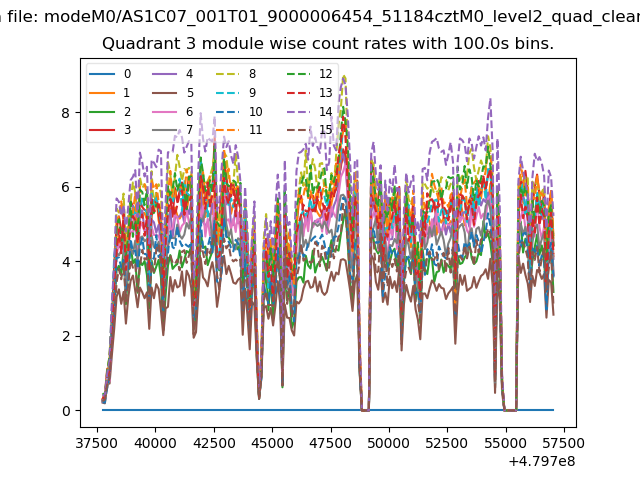
| Module-wise count rates for Quadrant C Data is divided into 100 sec bins |
 |
 |
| Module-wise count rates for Quadrant D Data is divided into 100 sec bins |
 |
 |
| Parameter | Plot |
|---|---|
| CZT HV Monitor | 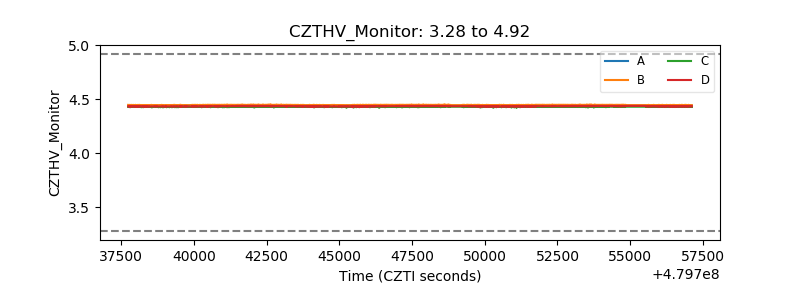 |
| D_VDD | 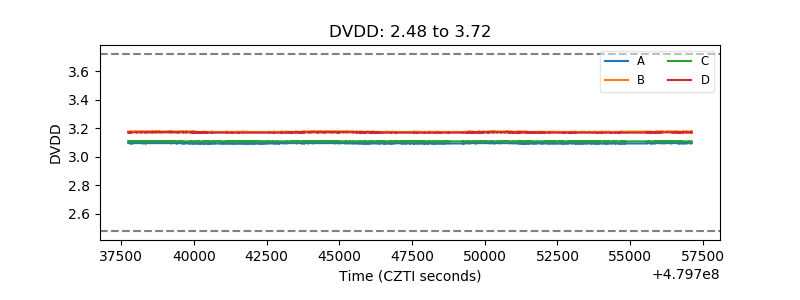 |
| Temperature 1 | 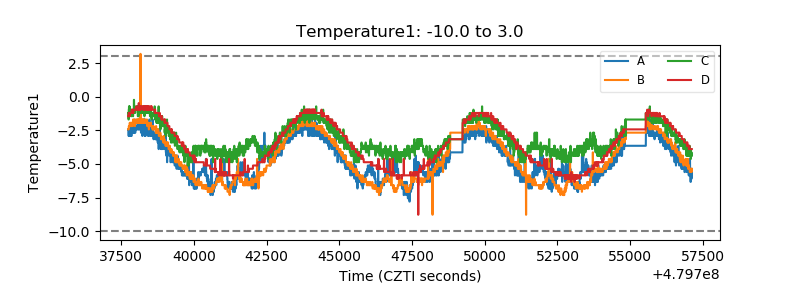 |
| Veto HV Monitor | 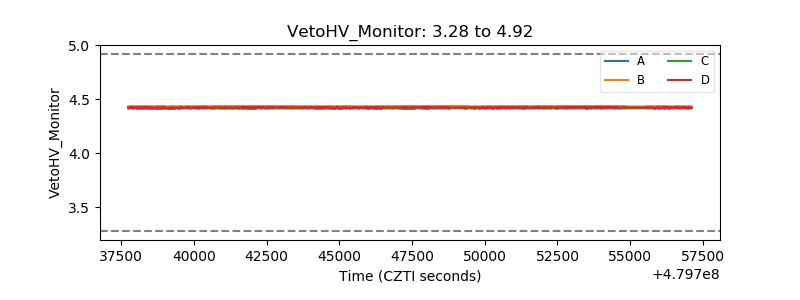 |
| Veto LLD |  |
| Alpha Counter | 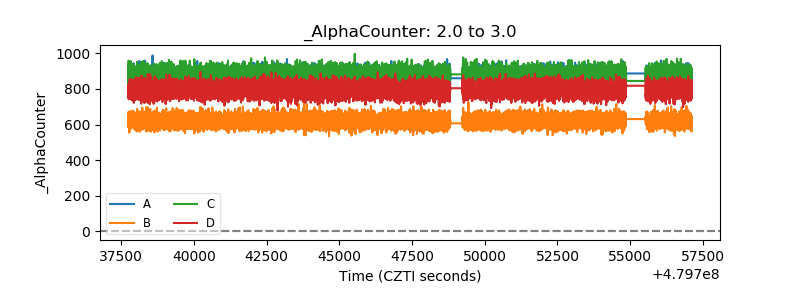 |
| _CPM_Rate | 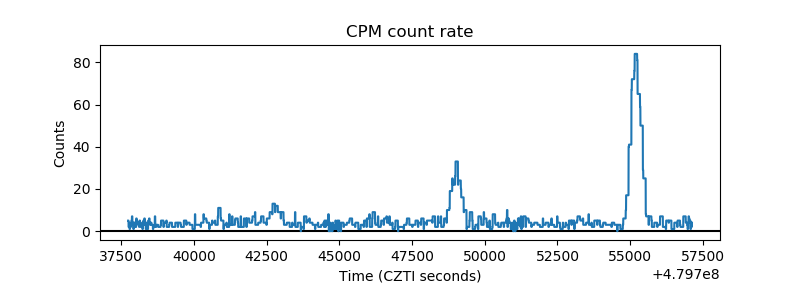 |
| CZT Counter | 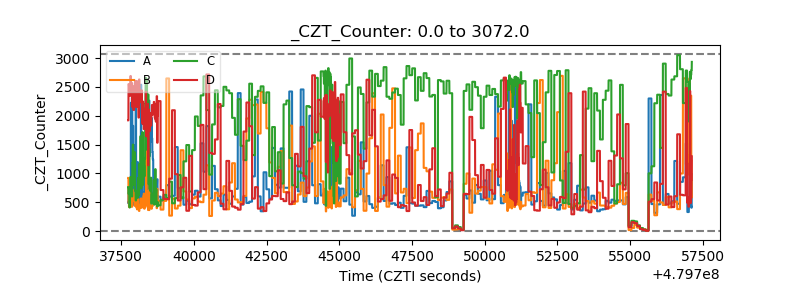 |
| +2.5 Volts monitor | 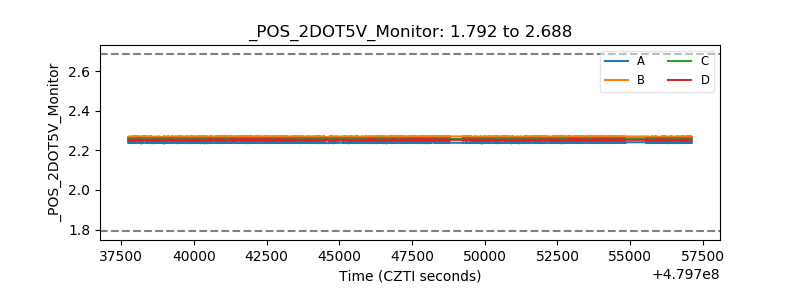 |
| +5 Volts monitor | 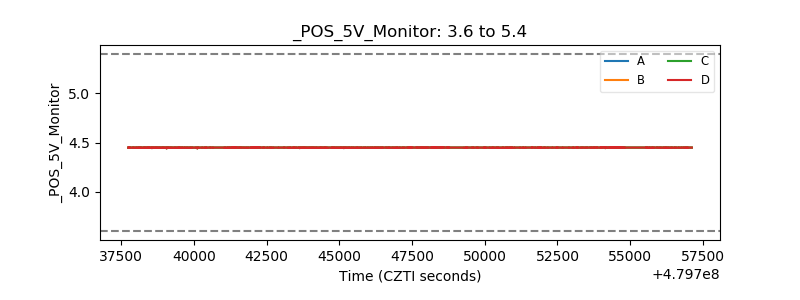 |
| _ROLL_ROT | 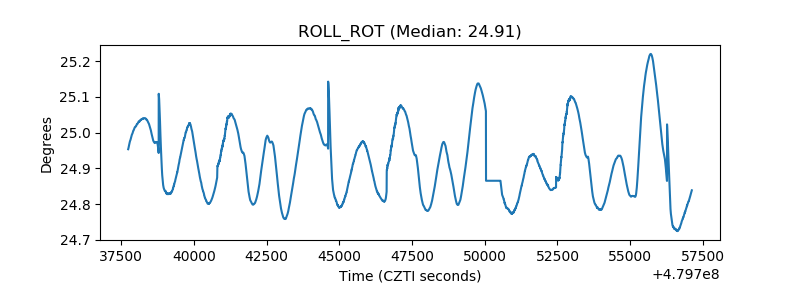 |
| _Roll_DEC | 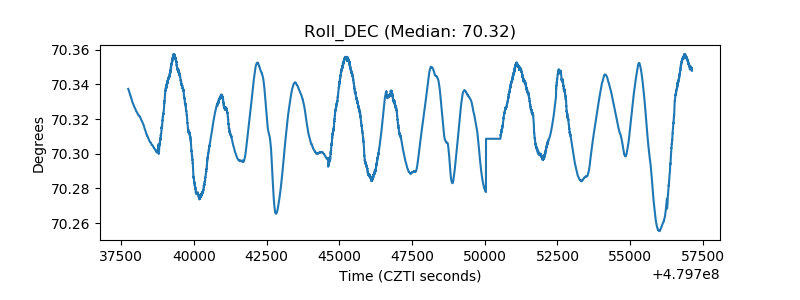 |
| _Roll_RA | 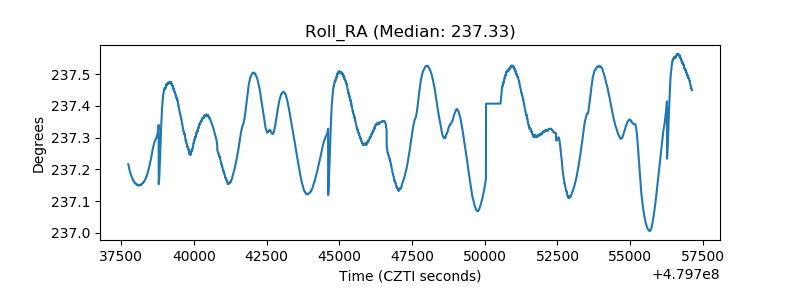 |
| Veto Counter | 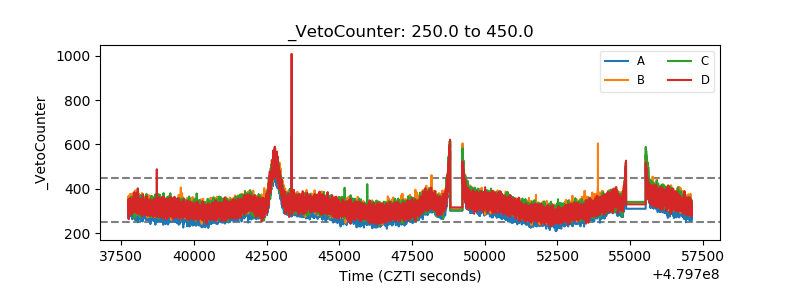 |