| Param | Original file | Final file |
|---|---|---|
| Filename | modeM0/AS1C07_001T01_9000006454_51185cztM0_level2.fits | modeM0/AS1C07_001T01_9000006454_51185cztM0_level2_quad_clean.evt |
| Size (bytes) | 1,515,833,280 | 144,400,320 |
| Size | 1.4 GB | 137.7 MB |
| Events in quadrant A | 8,954,831 | 1,079,923 |
| Events in quadrant B | 10,831,585 | 1,088,887 |
| Events in quadrant C | 25,626,217 | 404,492 |
| Events in quadrant D | 9,758,605 | 955,121 |
| Mode M0 | |||
|---|---|---|---|
| Quadrant | BADHDUFLAG | Total packets | Discarded packets |
| A | 0 | 34863 | 2 |
| B | 0 | 40477 | 5 |
| C | 0 | 84375 | 2 |
| D | 0 | 37682 | 2 |
| Mode SS | |||
|---|---|---|---|
| Quadrant | BADHDUFLAG | Total packets | Discarded packets |
| A | 0 | 250 | 0 |
| B | 0 | 250 | 0 |
| C | 0 | 250 | 0 |
| D | 0 | 250 | 0 |
| Mode M9 | |||
|---|---|---|---|
| Quadrant | BADHDUFLAG | Total packets | Discarded packets |
| A | 0 | 14 | 0 |
| B | 0 | 14 | 0 |
| C | 0 | 14 | 0 |
| D | 0 | 14 | 0 |
| Quadrant | Total seconds | Saturated seconds | Saturation percentage |
|---|---|---|---|
| A | 12182 | 572 | 4.695452% |
| B | 12181 | 1503 | 12.338888% |
| C | 12182 | 8201 | 67.320637% |
| D | 12182 | 1019 | 8.364801% |
Noise dominated data is calculated using 1-second bins in cleaned event files. If a bin has >2000 counts, and if more than 50% of those come from <1% of pixels, then it is considered to be noise-dominated and hence unusable.
| Quadrant | # 1 sec bins | Bins with >0 counts | Bins with >2000 counts | High rate bins dominated by noise | Noise dominated (total time) | Noise dominated (detector-on time) | Marked lightcurve |
|---|---|---|---|---|---|---|---|
| A | 13692 | 12184 | 403 | 403 | 2.94% | 3.31% |  |
| B | 13691 | 12183 | 1022 | 1022 | 7.46% | 8.39% | 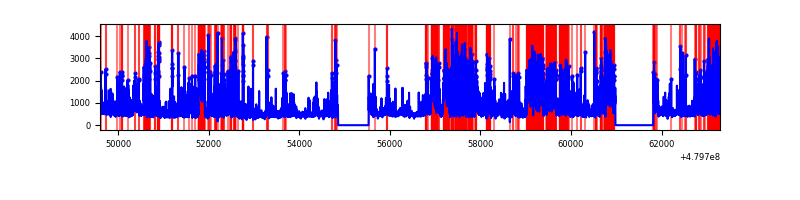 |
| C | 13692 | 12182 | 7682 | 7682 | 56.11% | 63.06% | 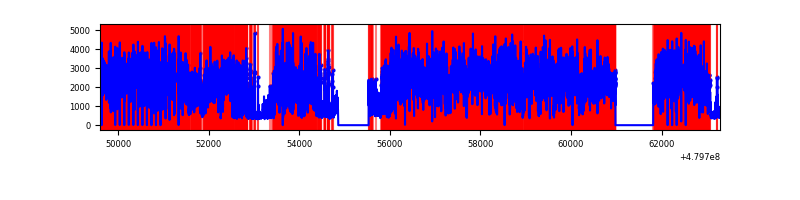 |
| D | 13692 | 12184 | 795 | 795 | 5.81% | 6.52% |  |
Top three noisy pixels from each quadrant. If the there are fewer than three noisy pixels in the level2.evt file, extra rows are filled as -1
| Pixel properties | Quadrant properties | ||||||
|---|---|---|---|---|---|---|---|
| Quadrant | DetID | PixID | Counts | Sigma | Mean | Median | Sigma |
| A | 12 | 3 | 1178905 | 3810.54 | 1244 | 1212 | 309.1 |
| A | 13 | 248 | 925803 | 2991.6 | 1244 | 1212 | 309.1 |
| A | 14 | 254 | 349621 | 1127.31 | 1244 | 1212 | 309.1 |
| B | 5 | 172 | 2127208 | 8292.55 | 1211 | 1168 | 256.4 |
| B | 10 | 60 | 954357 | 3717.88 | 1211 | 1168 | 256.4 |
| B | 8 | 128 | 707301 | 2754.25 | 1211 | 1168 | 256.4 |
| C | 12 | 247 | 13521112 | 62790.67 | 783 | 779 | 215.3 |
| C | 4 | 12 | 5163090 | 23974.63 | 783 | 779 | 215.3 |
| C | 10 | 69 | 2441148 | 11333.48 | 783 | 779 | 215.3 |
| D | 3 | 12 | 1366415 | 4078.87 | 1193 | 1152 | 334.7 |
| D | 2 | 216 | 867700 | 2588.91 | 1193 | 1152 | 334.7 |
| D | 8 | 176 | 526463 | 1569.42 | 1193 | 1152 | 334.7 |
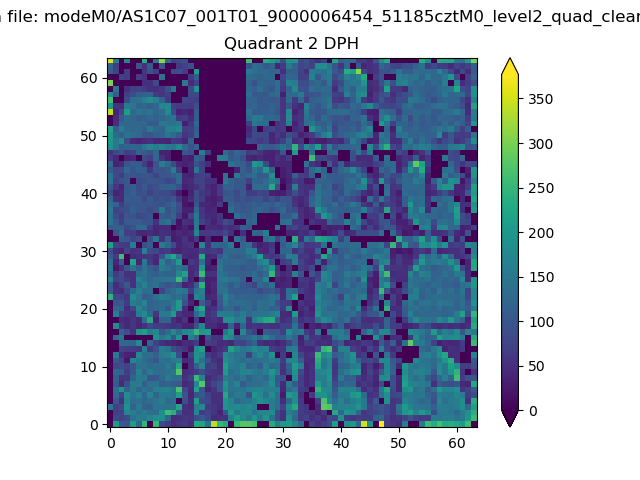
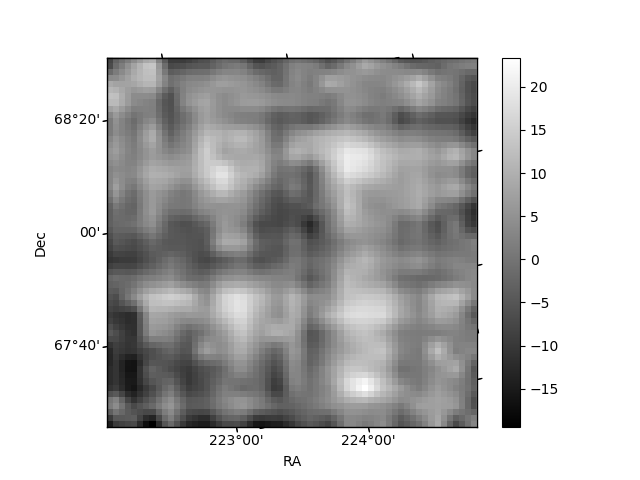
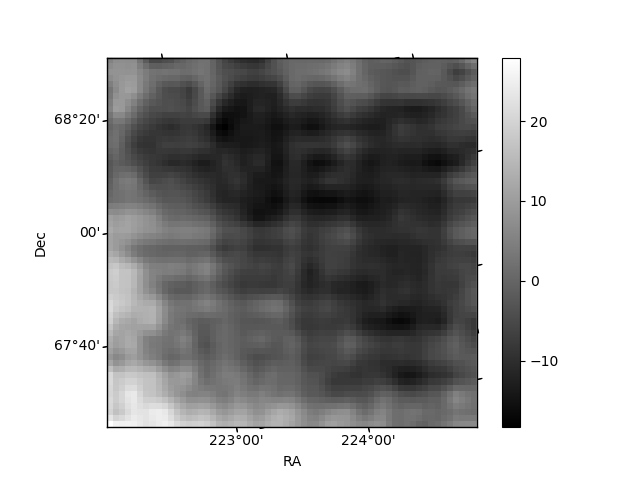
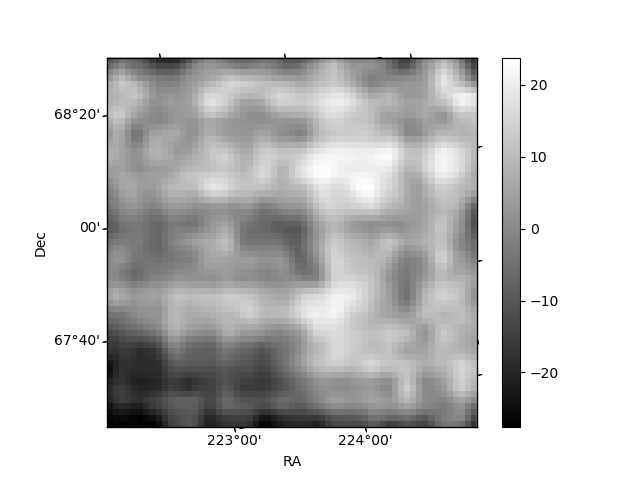
Histogram calculated using DETX and DETY for each event in the final _common_clean file
| Quadrant A | 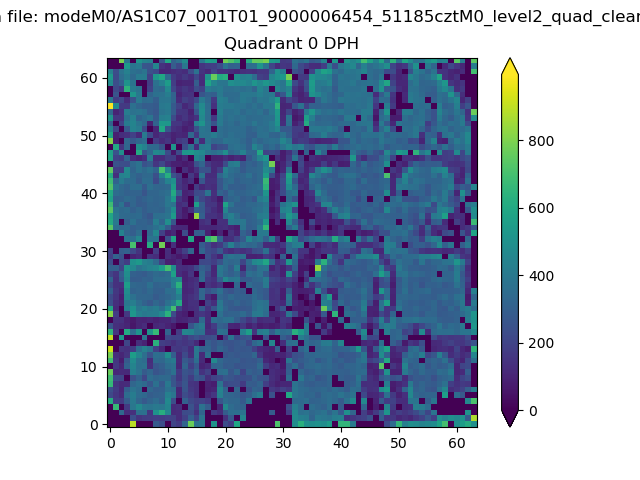 |
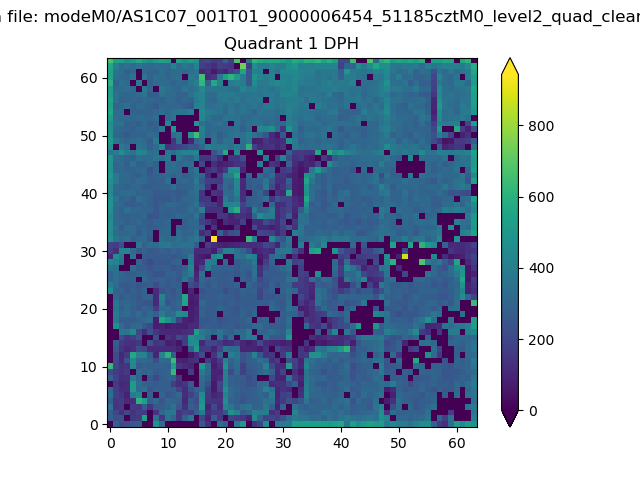 |
Quadrant B |
|---|---|---|---|
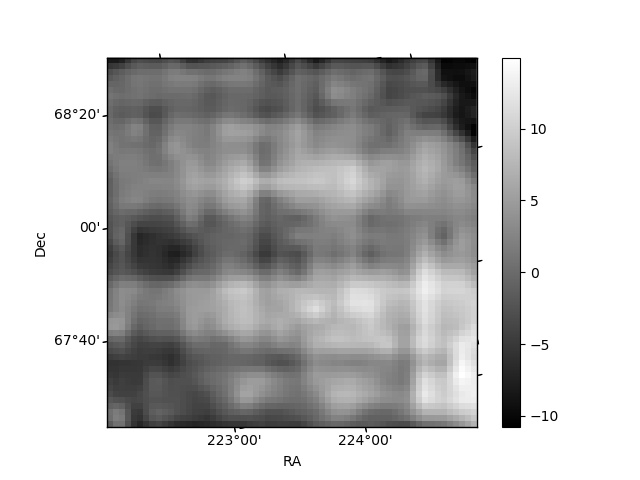
| Quadrant D | 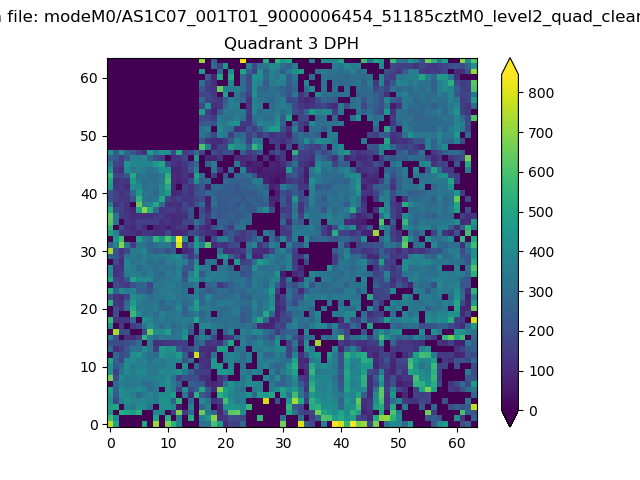 |
 |
Quadrant C |
| Plot type | Count rate plots | Images |
|---|---|---|
| Comparison with Poisson distribution Blue bars denote a histogram of data divided into 1 sec bins. Red curve is a Poisson curve with rate = median count rate of data. |
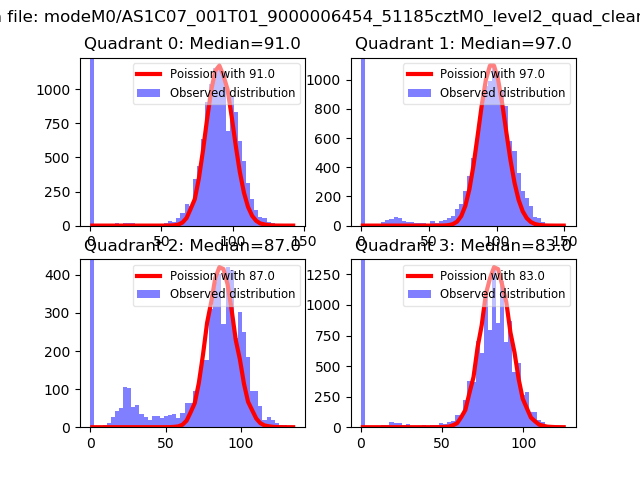 |
 |
| Quadrant-wise count rates Data is divided into 100 sec bins |
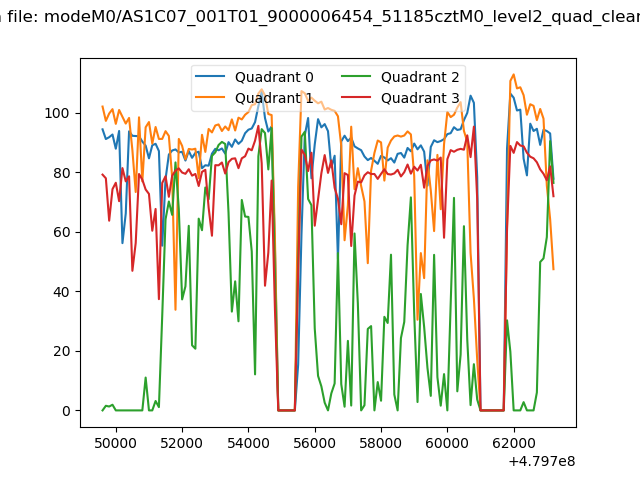 |
|
| Module-wise count rates for Quadrant A Data is divided into 100 sec bins |
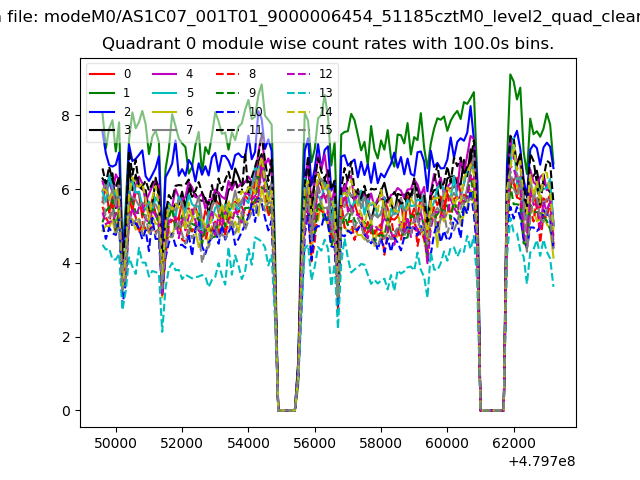 |
 |
| Module-wise count rates for Quadrant B Data is divided into 100 sec bins |
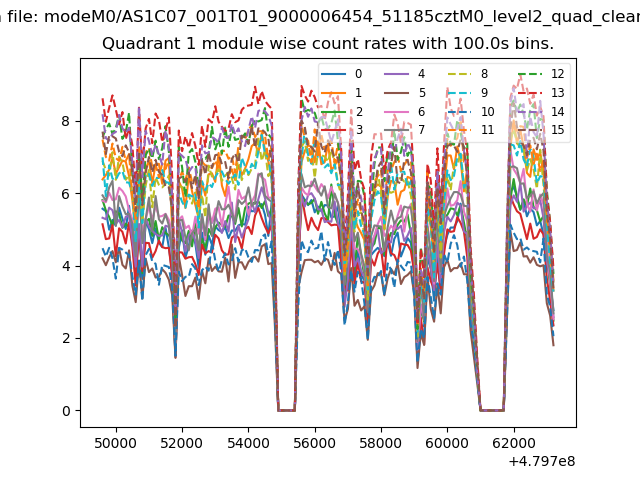 |
 |
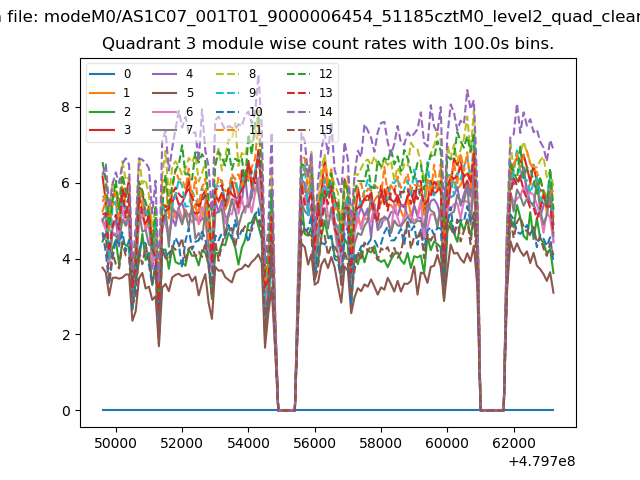
| Module-wise count rates for Quadrant C Data is divided into 100 sec bins |
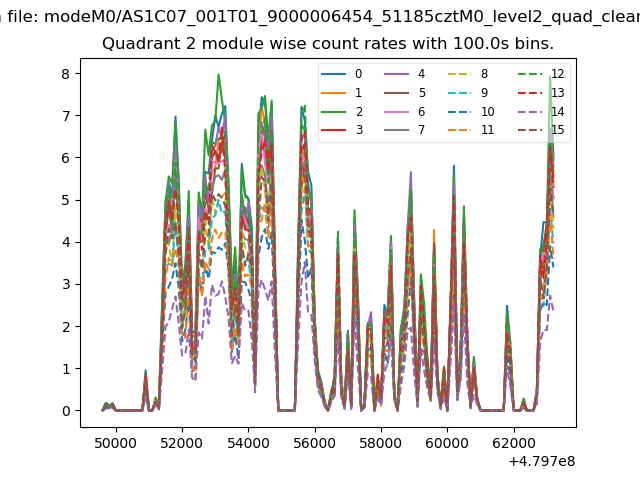 |
 |
| Module-wise count rates for Quadrant D Data is divided into 100 sec bins |
 |
 |
| Parameter | Plot |
|---|---|
| CZT HV Monitor |  |
| D_VDD | 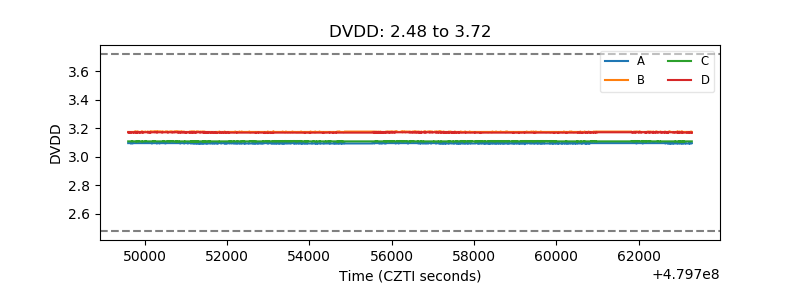 |
| Temperature 1 | 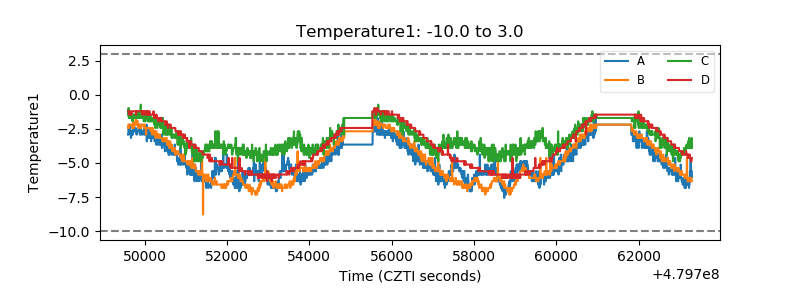 |
| Veto HV Monitor | 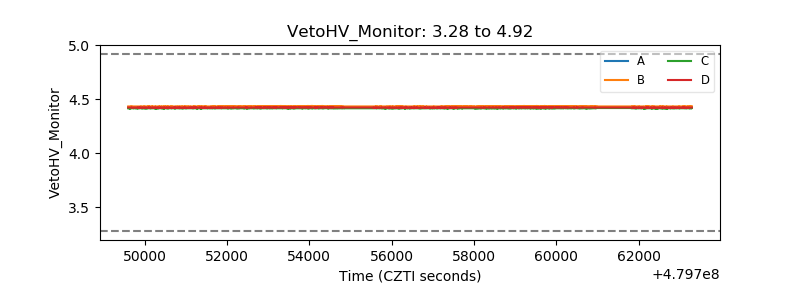 |
| Veto LLD |  |
| Alpha Counter | 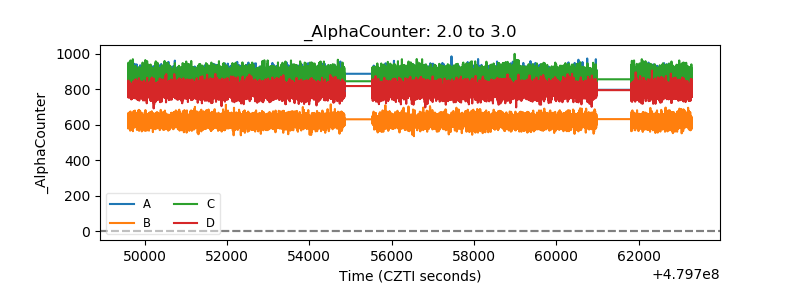 |
| _CPM_Rate | 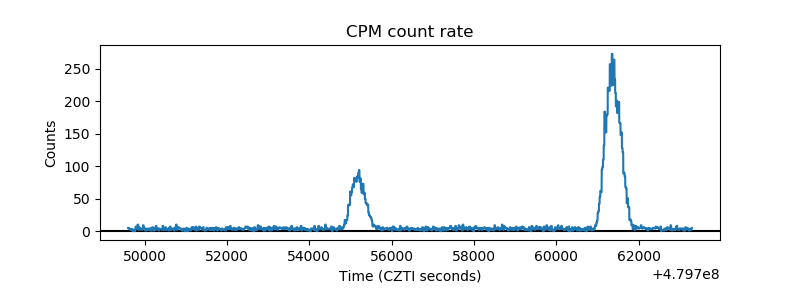 |
| CZT Counter | 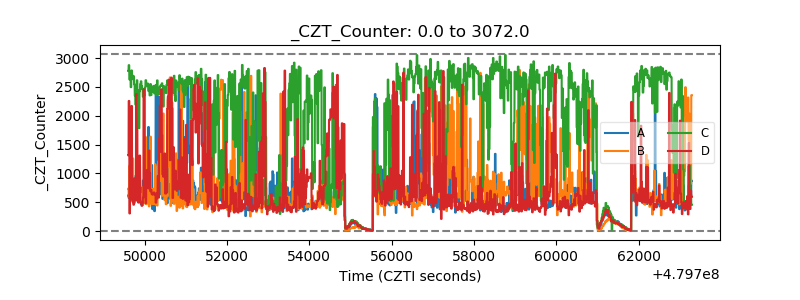 |
| +2.5 Volts monitor | 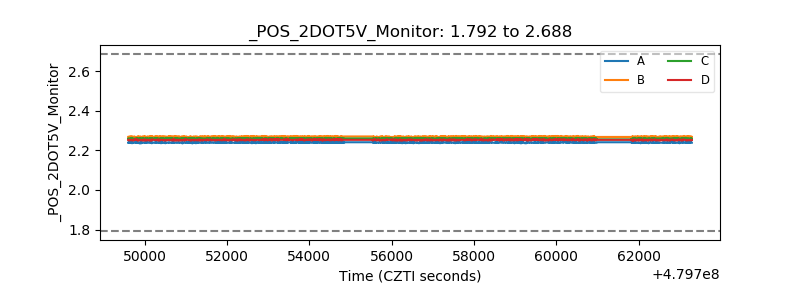 |
| +5 Volts monitor | 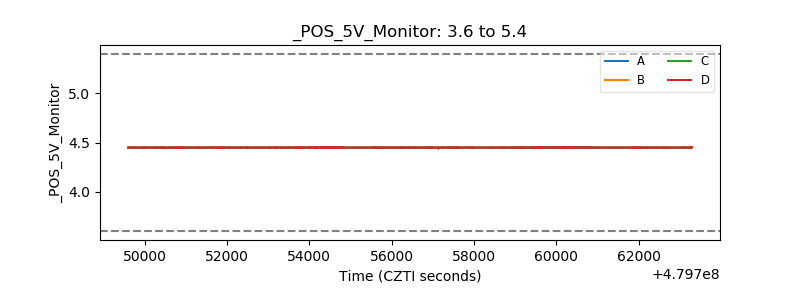 |
| _ROLL_ROT | 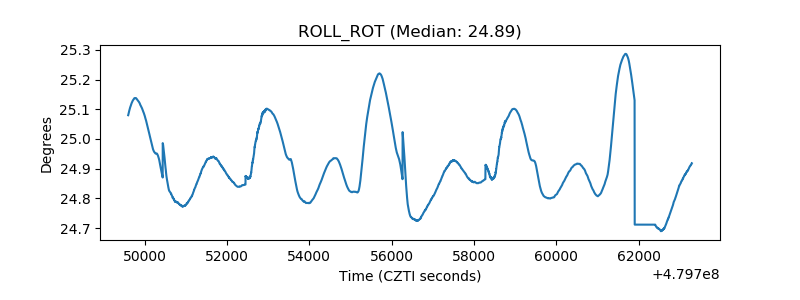 |
| _Roll_DEC | 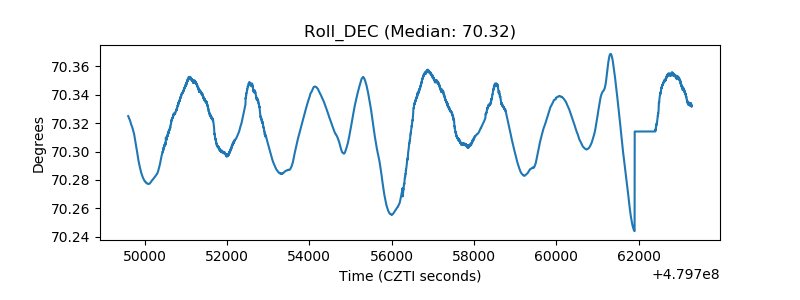 |
| _Roll_RA | 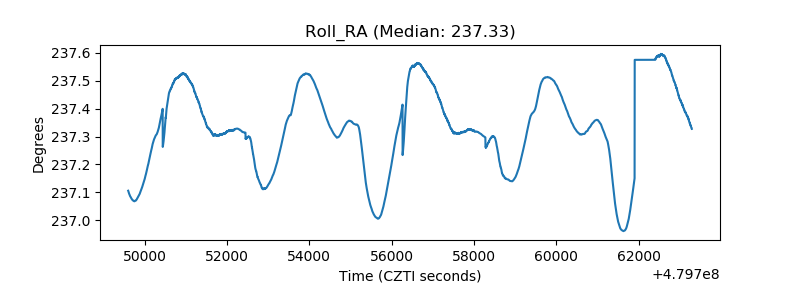 |
| Veto Counter | 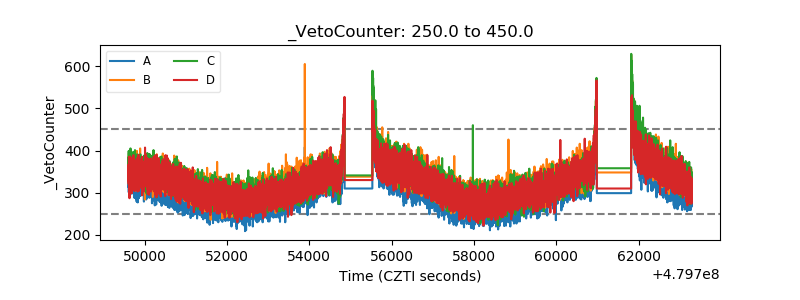 |