| Param | Original file | Final file |
|---|---|---|
| Filename | modeM0/AS1C07_001T01_9000006454_51187cztM0_level2.fits | modeM0/AS1C07_001T01_9000006454_51187cztM0_level2_quad_clean.evt |
| Size (bytes) | 651,533,760 | 85,080,960 |
| Size | 621.4 MB | 81.1 MB |
| Events in quadrant A | 4,354,827 | 591,297 |
| Events in quadrant B | 4,821,908 | 620,630 |
| Events in quadrant C | 9,288,626 | 428,643 |
| Events in quadrant D | 5,149,538 | 483,467 |
| Mode M0 | |||
|---|---|---|---|
| Quadrant | BADHDUFLAG | Total packets | Discarded packets |
| A | 0 | 17472 | 1 |
| B | 0 | 18841 | 1 |
| C | 0 | 32049 | 1 |
| D | 0 | 20100 | 8 |
| Mode SS | |||
|---|---|---|---|
| Quadrant | BADHDUFLAG | Total packets | Discarded packets |
| A | 0 | 130 | 0 |
| B | 0 | 130 | 0 |
| C | 0 | 130 | 0 |
| D | 0 | 130 | 0 |
| Mode M9 | |||
|---|---|---|---|
| Quadrant | BADHDUFLAG | Total packets | Discarded packets |
| A | 0 | 10 | 0 |
| B | 0 | 10 | 0 |
| C | 0 | 10 | 0 |
| D | 0 | 10 | 0 |
| Quadrant | Total seconds | Saturated seconds | Saturation percentage |
|---|---|---|---|
| A | 6482 | 215 | 3.316878% |
| B | 6483 | 528 | 8.144378% |
| C | 6483 | 2062 | 31.806263% |
| D | 6482 | 927 | 14.301142% |
Noise dominated data is calculated using 1-second bins in cleaned event files. If a bin has >2000 counts, and if more than 50% of those come from <1% of pixels, then it is considered to be noise-dominated and hence unusable.
| Quadrant | # 1 sec bins | Bins with >0 counts | Bins with >2000 counts | High rate bins dominated by noise | Noise dominated (total time) | Noise dominated (detector-on time) | Marked lightcurve |
|---|---|---|---|---|---|---|---|
| A | 7467 | 6483 | 115 | 115 | 1.54% | 1.77% | 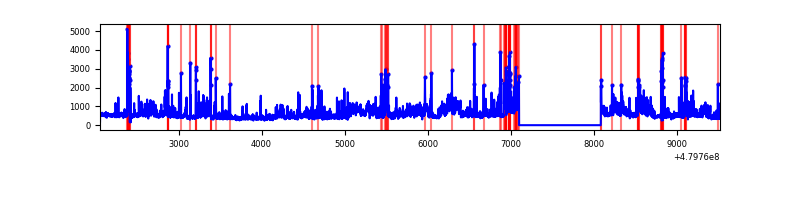 |
| B | 7468 | 6484 | 284 | 284 | 3.80% | 4.38% | 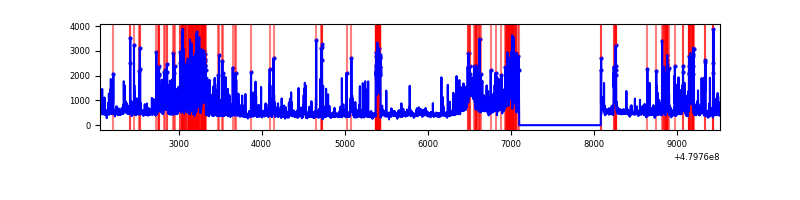 |
| C | 7468 | 6484 | 1882 | 1882 | 25.20% | 29.03% | 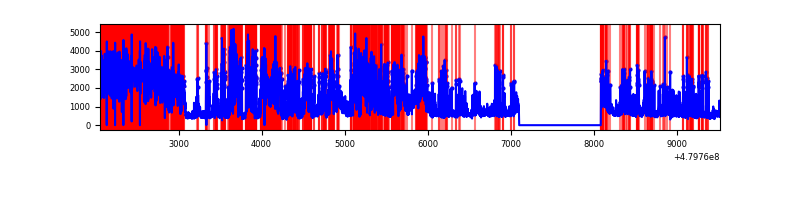 |
| D | 7466 | 6482 | 694 | 694 | 9.30% | 10.71% | 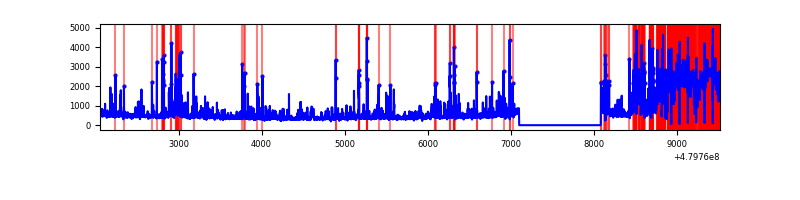 |
Top three noisy pixels from each quadrant. If the there are fewer than three noisy pixels in the level2.evt file, extra rows are filled as -1
| Pixel properties | Quadrant properties | ||||||
|---|---|---|---|---|---|---|---|
| Quadrant | DetID | PixID | Counts | Sigma | Mean | Median | Sigma |
| A | 12 | 3 | 470685 | 2823.87 | 663 | 646 | 166.5 |
| A | 14 | 254 | 408038 | 2447.5 | 663 | 646 | 166.5 |
| A | 13 | 248 | 219756 | 1316.35 | 663 | 646 | 166.5 |
| B | 5 | 185 | 467509 | 3343.69 | 654 | 631 | 139.6 |
| B | 8 | 128 | 374593 | 2678.24 | 654 | 631 | 139.6 |
| B | 7 | 252 | 350480 | 2505.55 | 654 | 631 | 139.6 |
| C | 4 | 12 | 4140313 | 26416.4 | 560 | 553 | 156.7 |
| C | 12 | 247 | 1932709 | 12329.36 | 560 | 553 | 156.7 |
| C | 13 | 3 | 228776 | 1456.32 | 560 | 553 | 156.7 |
| D | 3 | 12 | 1970519 | 12032.26 | 586 | 566 | 163.7 |
| D | 2 | 216 | 218333 | 1330.1 | 586 | 566 | 163.7 |
| D | 8 | 176 | 165331 | 1006.37 | 586 | 566 | 163.7 |
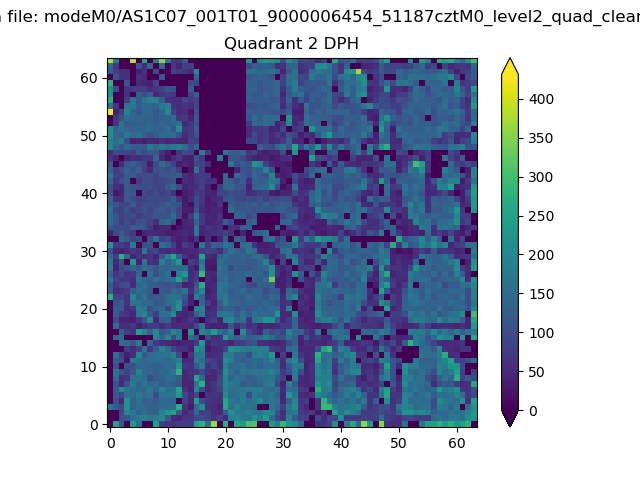
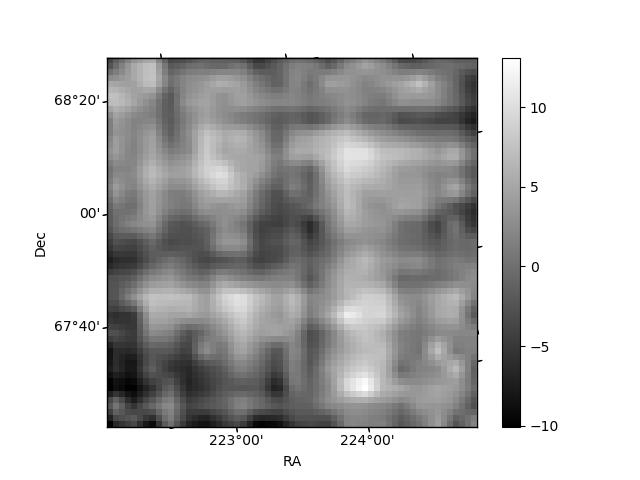
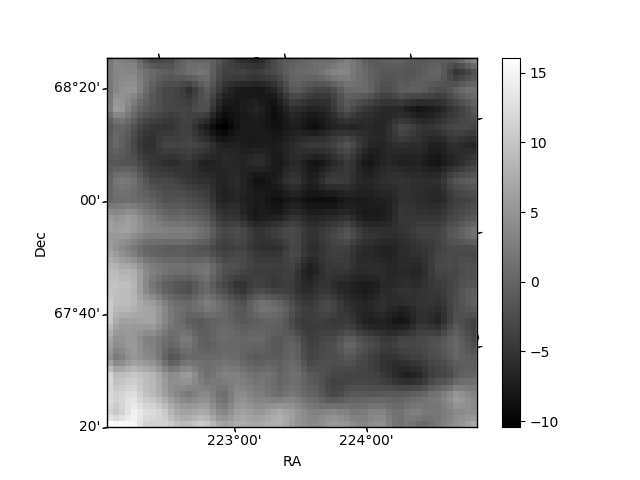
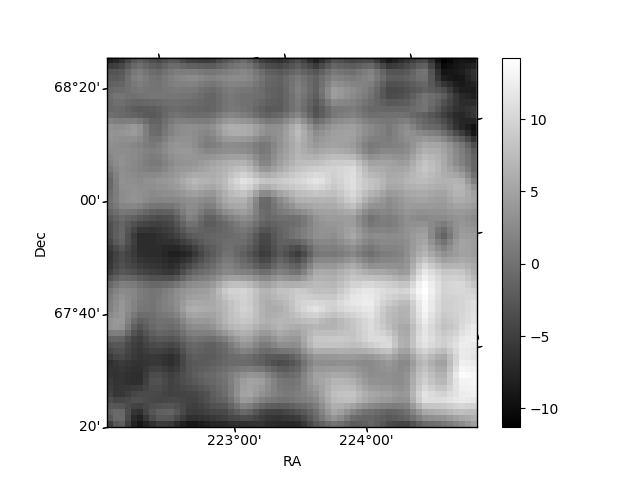
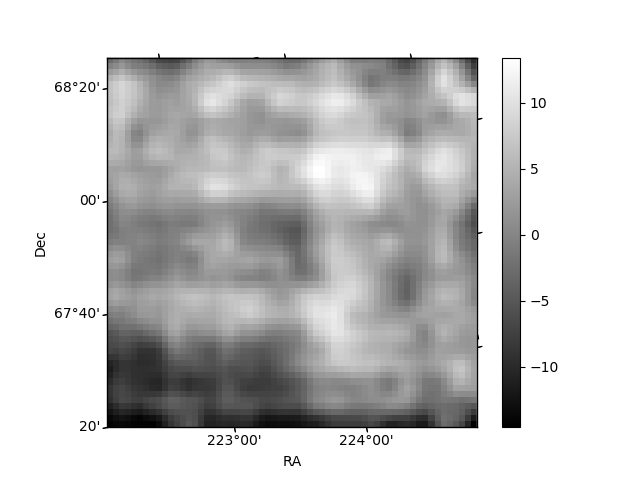
Histogram calculated using DETX and DETY for each event in the final _common_clean file
| Quadrant A | 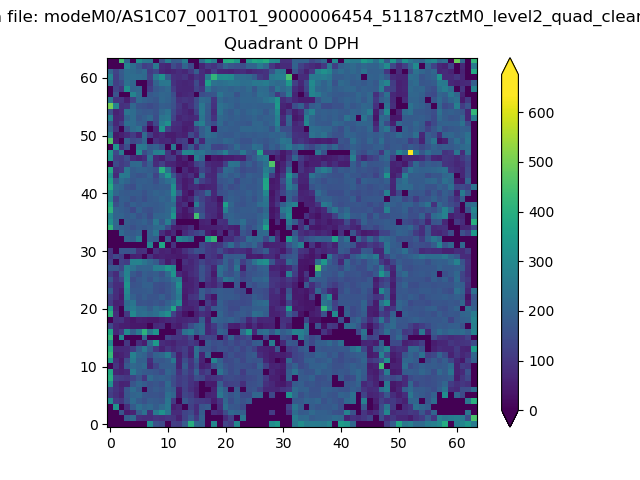 |
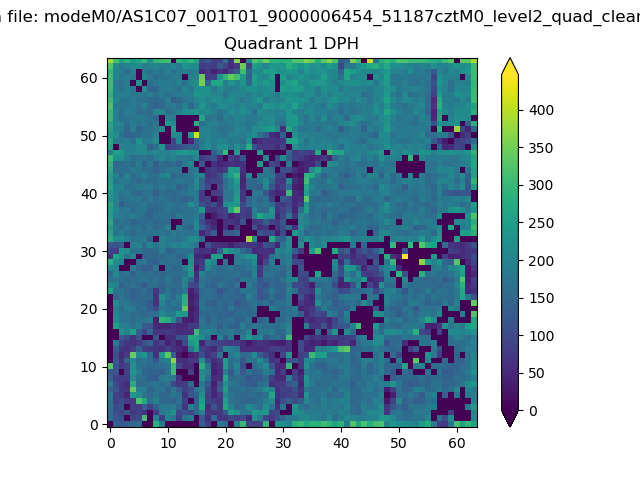 |
Quadrant B |
|---|---|---|---|
| Quadrant D | 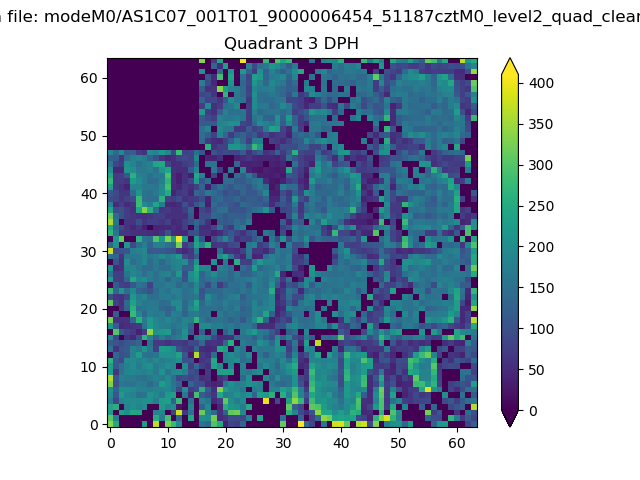 |
 |
Quadrant C |
| Plot type | Count rate plots | Images |
|---|---|---|
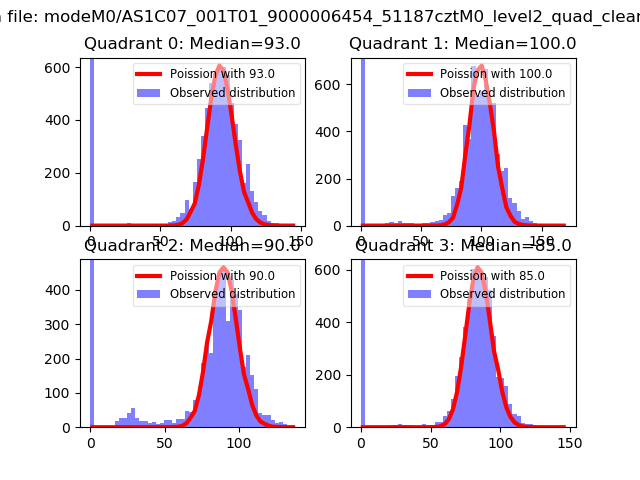
| Comparison with Poisson distribution Blue bars denote a histogram of data divided into 1 sec bins. Red curve is a Poisson curve with rate = median count rate of data. |
 |
 |
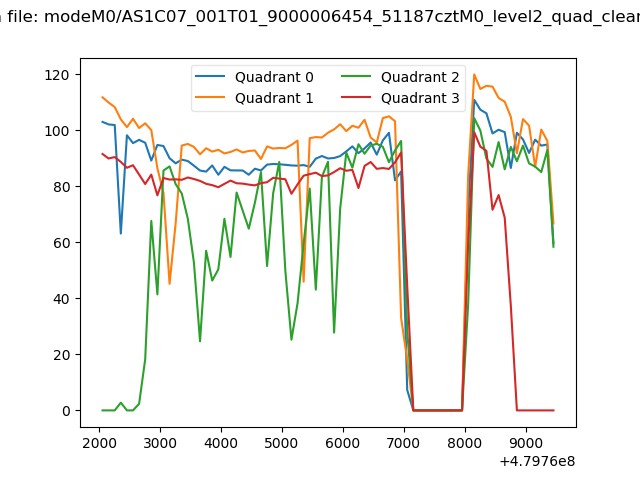
| Quadrant-wise count rates Data is divided into 100 sec bins |
 |
|
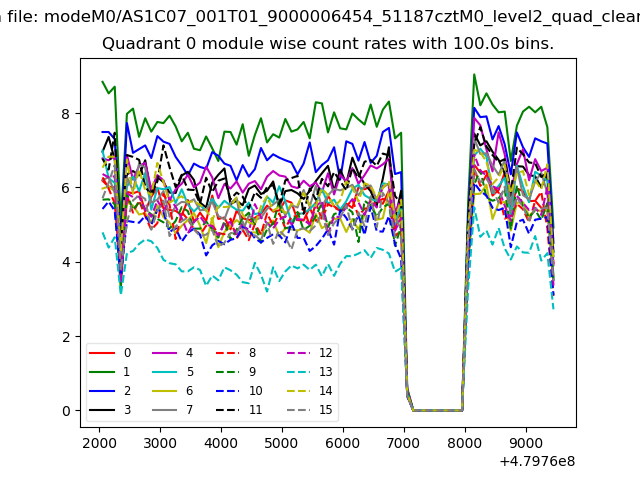
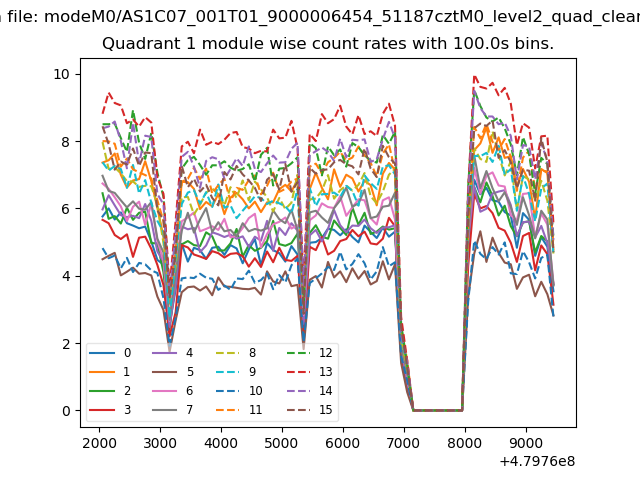
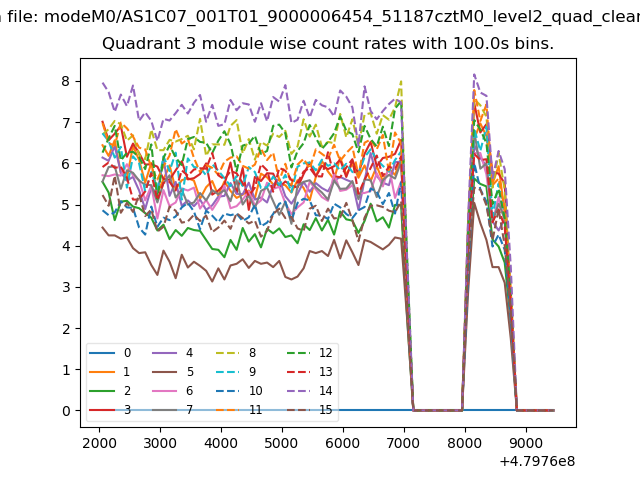
| Module-wise count rates for Quadrant A Data is divided into 100 sec bins |
 |
 |
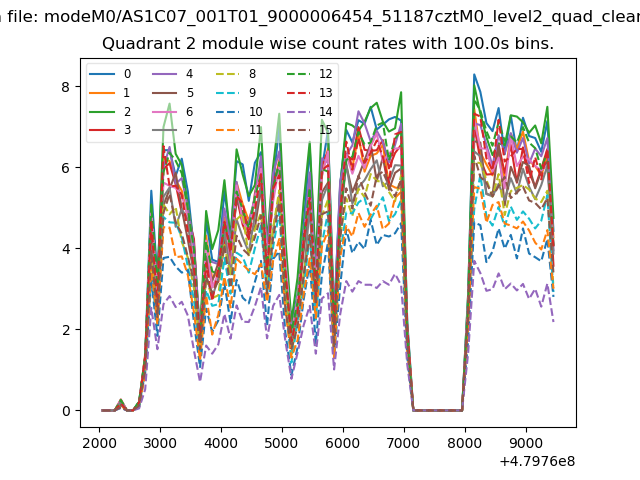
| Module-wise count rates for Quadrant B Data is divided into 100 sec bins |
 |
 |
| Module-wise count rates for Quadrant C Data is divided into 100 sec bins |
 |
 |
| Module-wise count rates for Quadrant D Data is divided into 100 sec bins |
 |
 |
| Parameter | Plot |
|---|---|
| CZT HV Monitor | 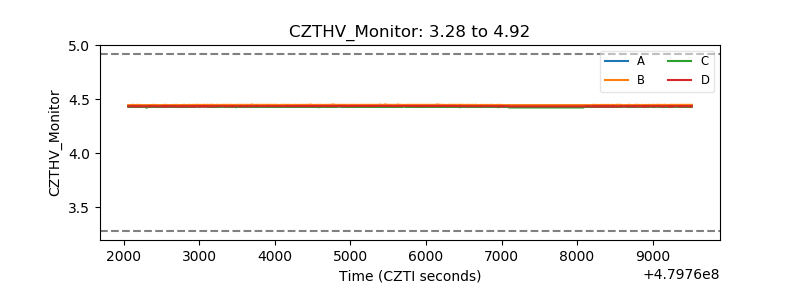 |
| D_VDD | 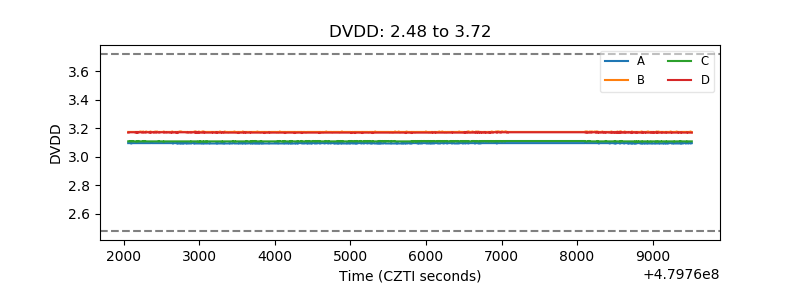 |
| Temperature 1 | 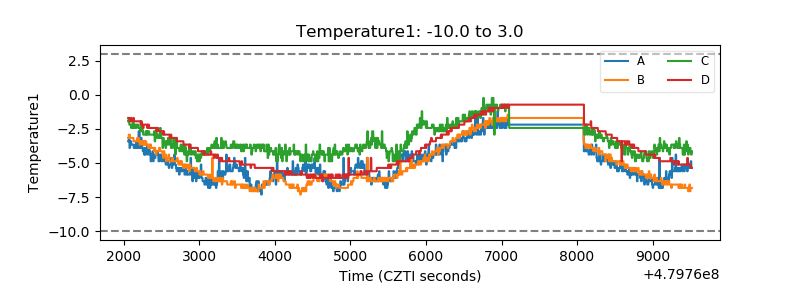 |
| Veto HV Monitor | 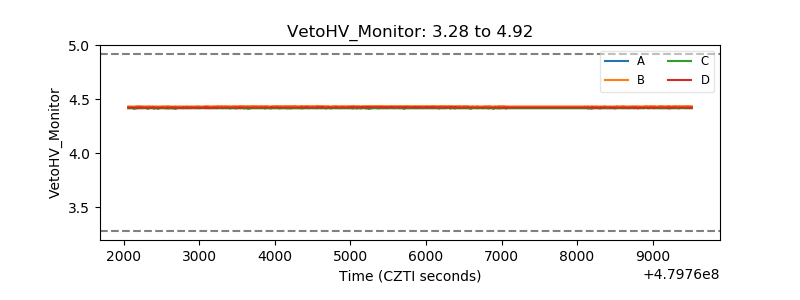 |
| Veto LLD | 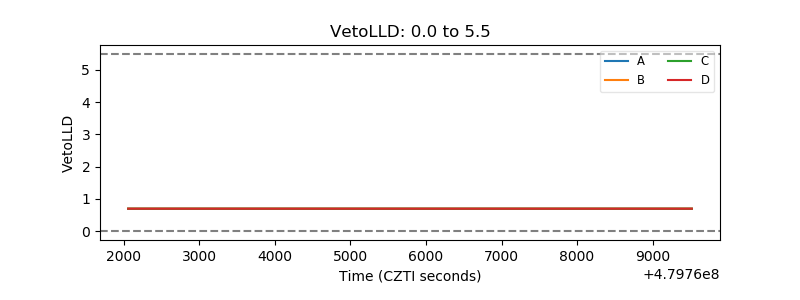 |
| Alpha Counter | 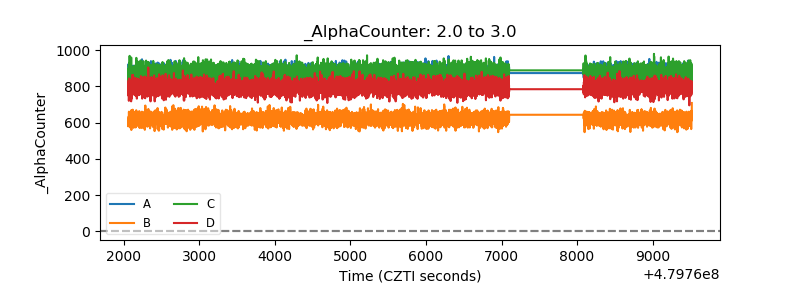 |
| _CPM_Rate | 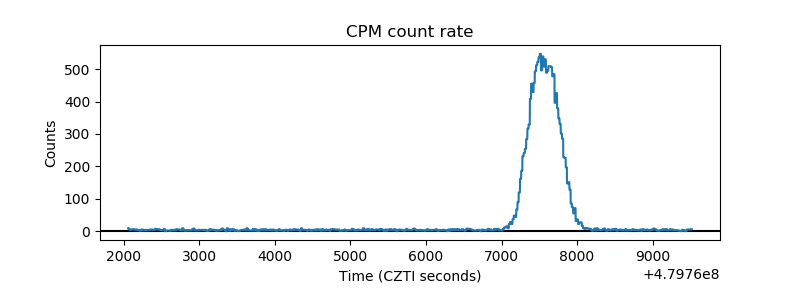 |
| CZT Counter | 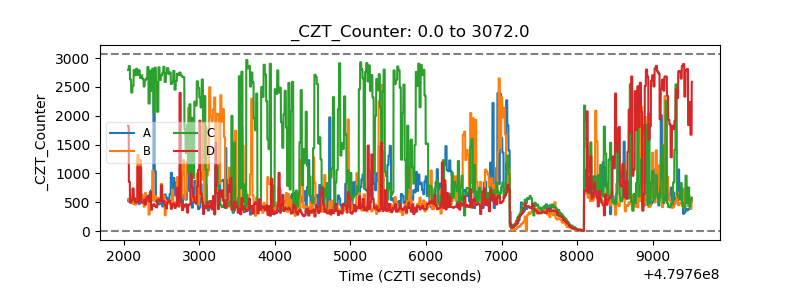 |
| +2.5 Volts monitor | 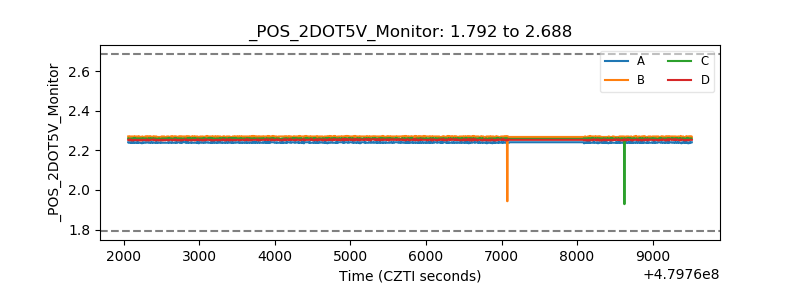 |
| +5 Volts monitor | 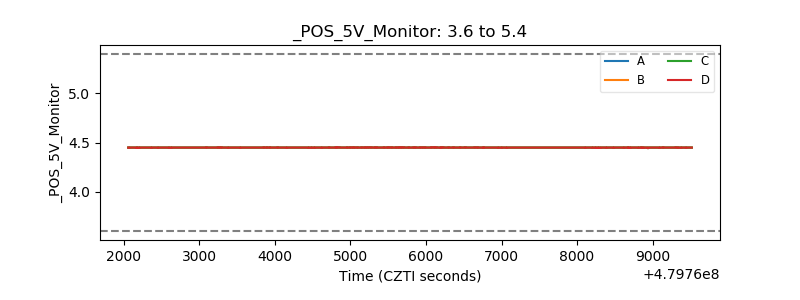 |
| _ROLL_ROT | 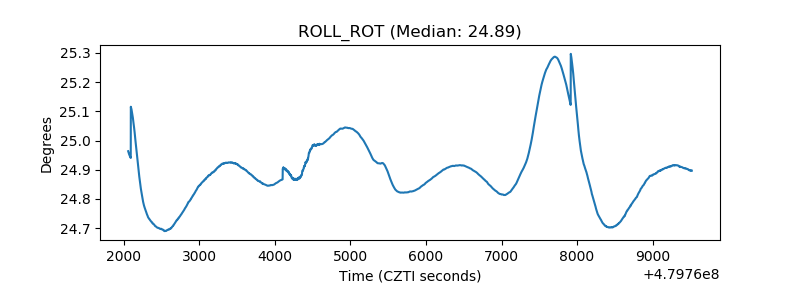 |
| _Roll_DEC | 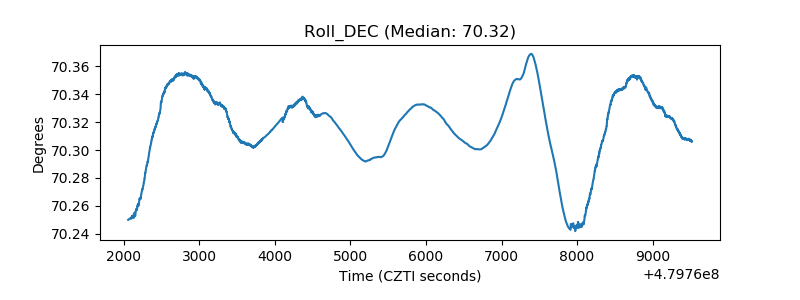 |
| _Roll_RA | 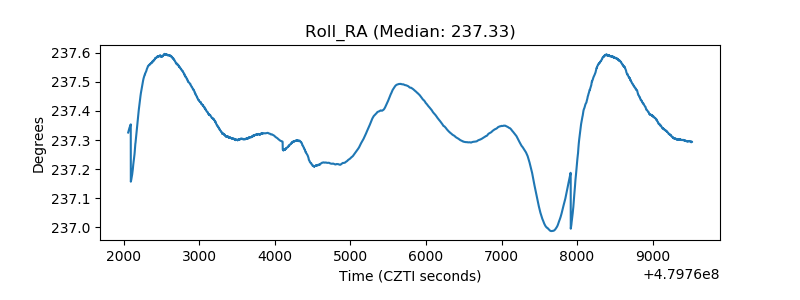 |
| Veto Counter | 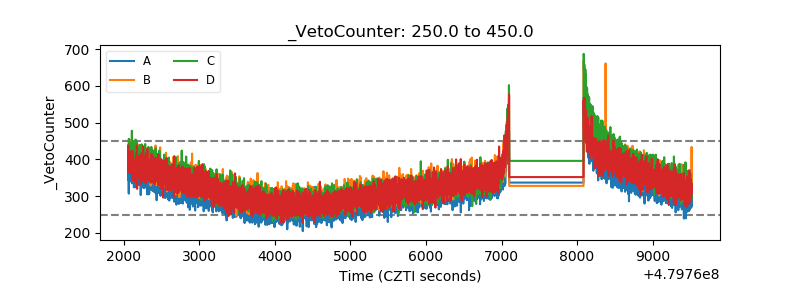 |