| Param | Original file | Final file |
|---|---|---|
| Filename | modeM0/AS1C07_001T01_9000006454_51188cztM0_level2.fits | modeM0/AS1C07_001T01_9000006454_51188cztM0_level2_quad_clean.evt |
| Size (bytes) | 643,872,960 | 88,727,040 |
| Size | 614.0 MB | 84.6 MB |
| Events in quadrant A | 5,246,420 | 609,262 |
| Events in quadrant B | 4,392,222 | 668,425 |
| Events in quadrant C | 7,488,605 | 504,588 |
| Events in quadrant D | 6,201,118 | 448,759 |
| Mode M0 | |||
|---|---|---|---|
| Quadrant | BADHDUFLAG | Total packets | Discarded packets |
| A | 0 | 20206 | 2 |
| B | 0 | 17660 | 2 |
| C | 0 | 26787 | 9 |
| D | 0 | 23191 | 2 |
| Mode SS | |||
|---|---|---|---|
| Quadrant | BADHDUFLAG | Total packets | Discarded packets |
| A | 0 | 134 | 0 |
| B | 0 | 134 | 0 |
| C | 0 | 134 | 0 |
| D | 0 | 134 | 0 |
| Mode M9 | |||
|---|---|---|---|
| Quadrant | BADHDUFLAG | Total packets | Discarded packets |
| A | 0 | 11 | 0 |
| B | 0 | 12 | 0 |
| C | 0 | 12 | 0 |
| D | 0 | 12 | 0 |
| Quadrant | Total seconds | Saturated seconds | Saturation percentage |
|---|---|---|---|
| A | 6524 | 236 | 3.617413% |
| B | 6524 | 249 | 3.816677% |
| C | 6523 | 1348 | 20.665338% |
| D | 6523 | 1539 | 23.593439% |
Noise dominated data is calculated using 1-second bins in cleaned event files. If a bin has >2000 counts, and if more than 50% of those come from <1% of pixels, then it is considered to be noise-dominated and hence unusable.
| Quadrant | # 1 sec bins | Bins with >0 counts | Bins with >2000 counts | High rate bins dominated by noise | Noise dominated (total time) | Noise dominated (detector-on time) | Marked lightcurve |
|---|---|---|---|---|---|---|---|
| A | 7589 | 6525 | 138 | 138 | 1.82% | 2.11% | 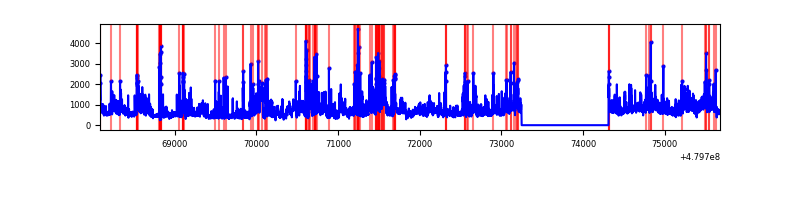 |
| B | 7589 | 6525 | 119 | 119 | 1.57% | 1.82% | 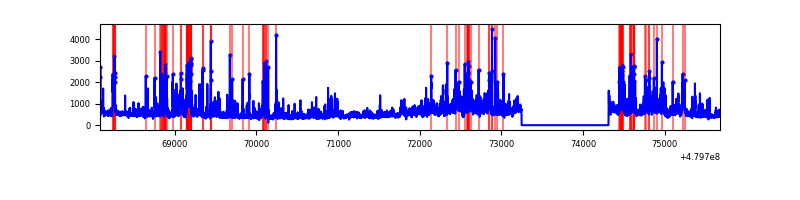 |
| C | 7587 | 6523 | 1077 | 1077 | 14.20% | 16.51% | 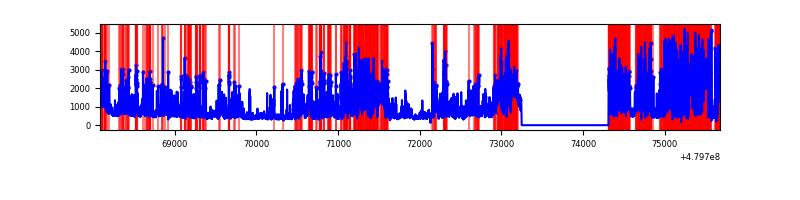 |
| D | 7588 | 6524 | 1040 | 1040 | 13.71% | 15.94% | 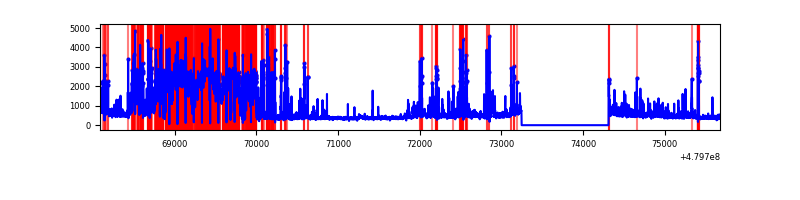 |
Top three noisy pixels from each quadrant. If the there are fewer than three noisy pixels in the level2.evt file, extra rows are filled as -1
| Pixel properties | Quadrant properties | ||||||
|---|---|---|---|---|---|---|---|
| Quadrant | DetID | PixID | Counts | Sigma | Mean | Median | Sigma |
| A | 12 | 3 | 646857 | 3842.39 | 677 | 661 | 168.2 |
| A | 14 | 254 | 582708 | 3460.95 | 677 | 661 | 168.2 |
| A | 9 | 160 | 444076 | 2636.62 | 677 | 661 | 168.2 |
| B | 10 | 254 | 423637 | 2937.38 | 679 | 655 | 144.0 |
| B | 8 | 128 | 312879 | 2168.23 | 679 | 655 | 144.0 |
| B | 7 | 252 | 290668 | 2013.98 | 679 | 655 | 144.0 |
| C | 4 | 12 | 3225350 | 18916.16 | 618 | 615 | 170.5 |
| C | 12 | 247 | 1039123 | 6091.85 | 618 | 615 | 170.5 |
| C | 13 | 3 | 289761 | 1696.12 | 618 | 615 | 170.5 |
| D | 3 | 12 | 3178027 | 20672.21 | 547 | 529 | 153.7 |
| D | 2 | 216 | 188016 | 1219.76 | 547 | 529 | 153.7 |
| D | 10 | 172 | 112225 | 726.67 | 547 | 529 | 153.7 |
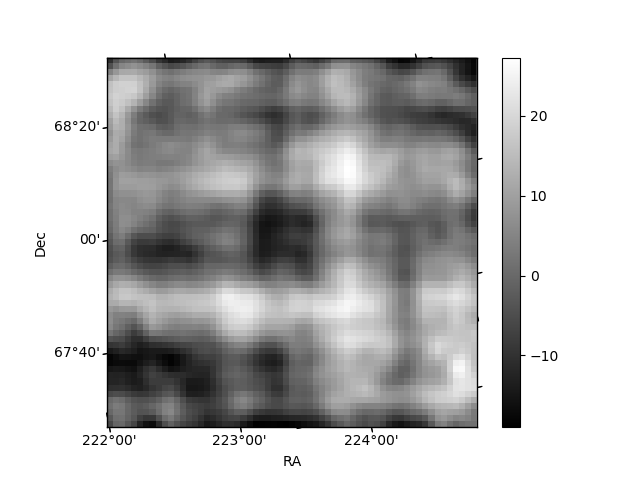
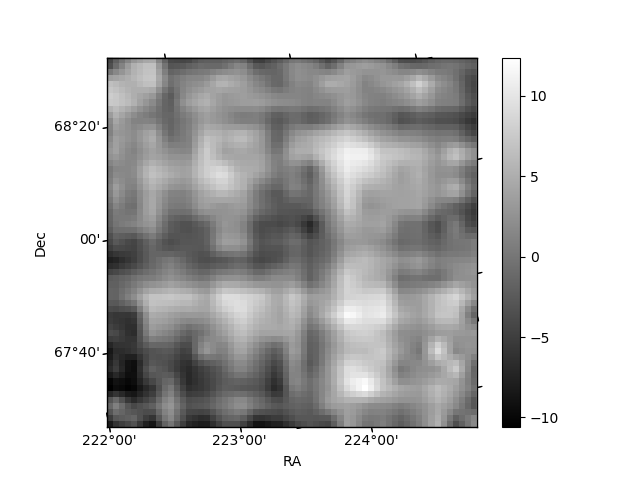
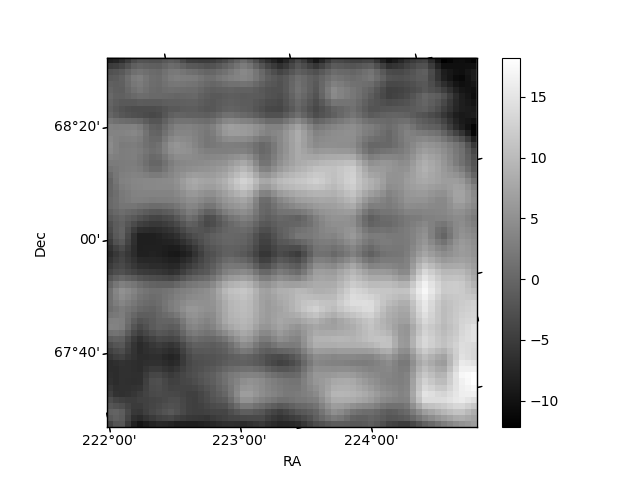
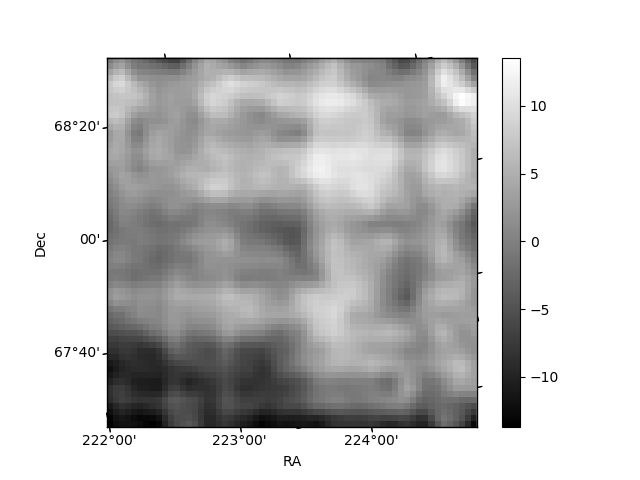
Histogram calculated using DETX and DETY for each event in the final _common_clean file
| Quadrant A | 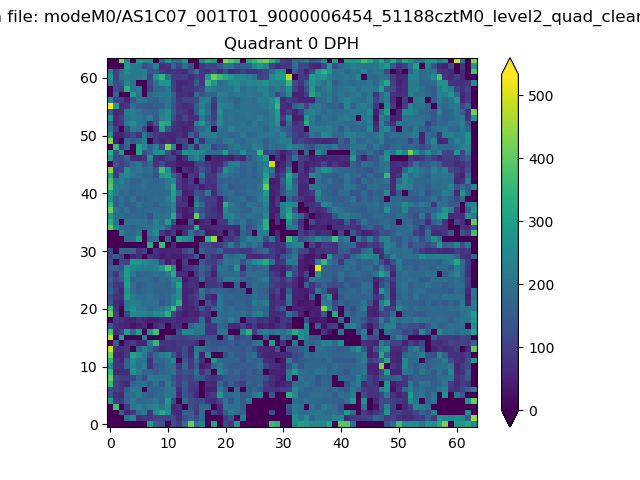 |
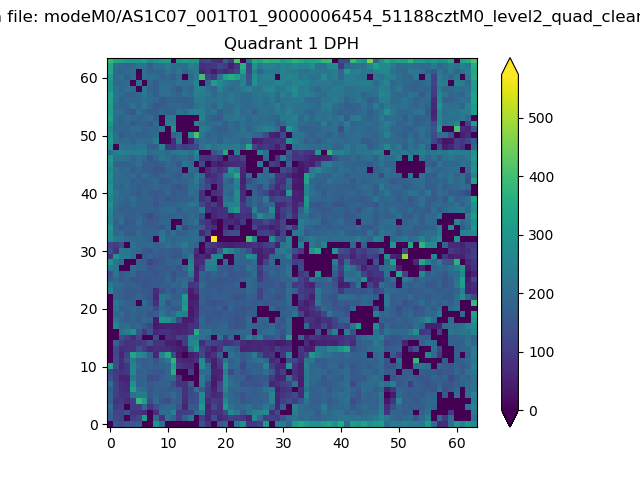 |
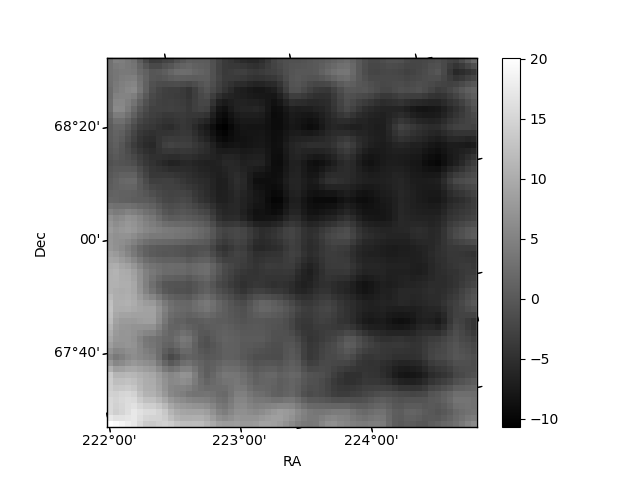
Quadrant B |
|---|---|---|---|
| Quadrant D | 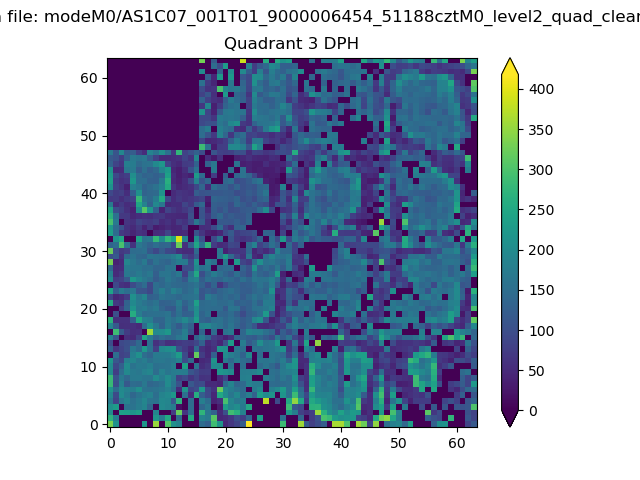 |
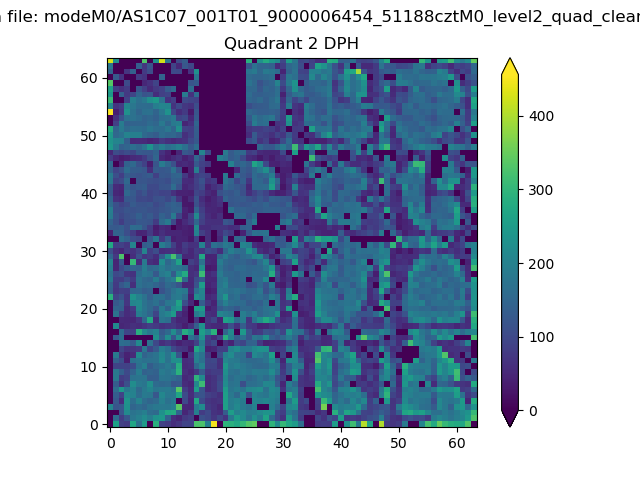 |
Quadrant C |
| Plot type | Count rate plots | Images |
|---|---|---|
| Comparison with Poisson distribution Blue bars denote a histogram of data divided into 1 sec bins. Red curve is a Poisson curve with rate = median count rate of data. |
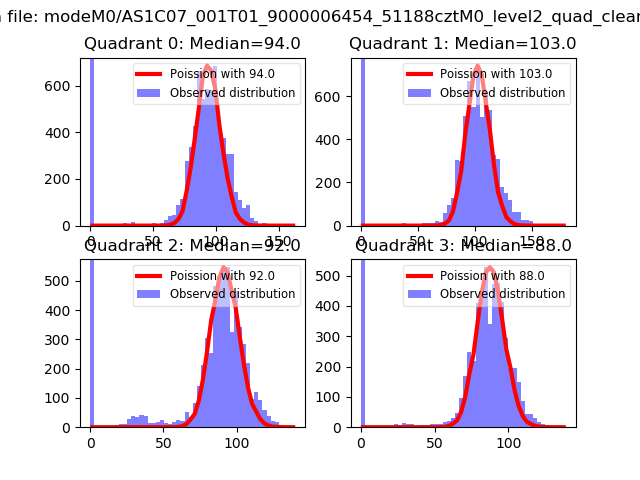 |
 |
| Quadrant-wise count rates Data is divided into 100 sec bins |
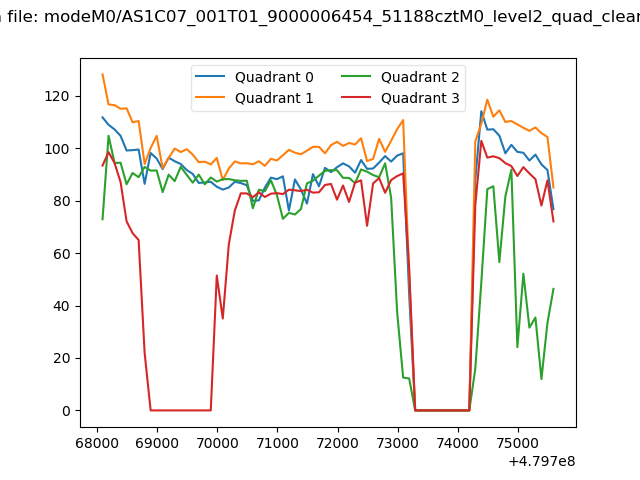 |
|
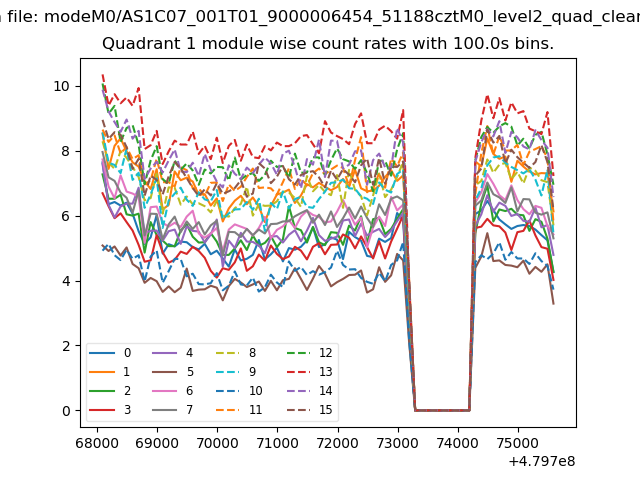
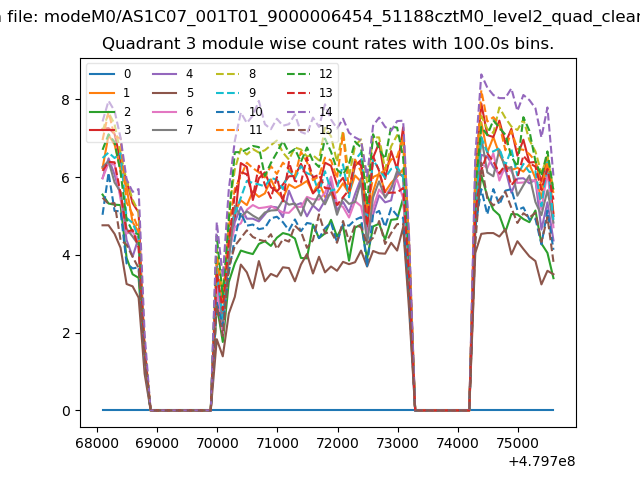
| Module-wise count rates for Quadrant A Data is divided into 100 sec bins |
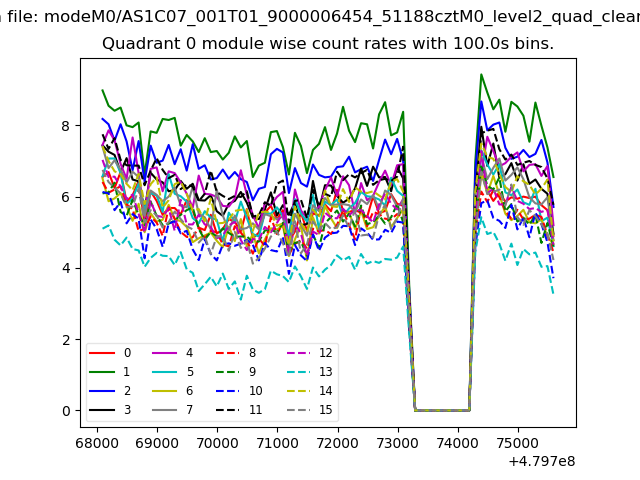 |
 |
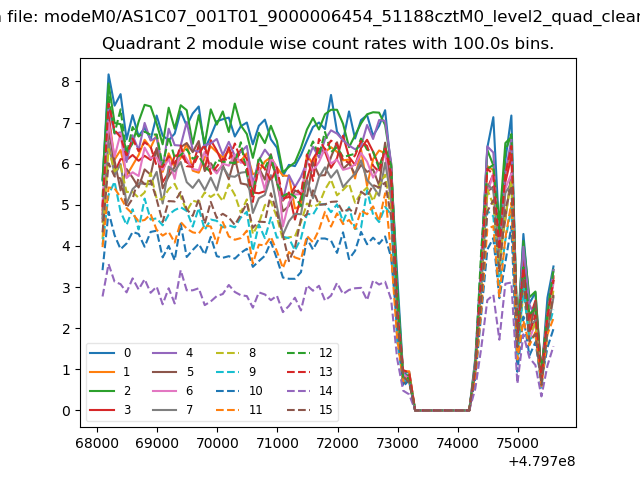
| Module-wise count rates for Quadrant B Data is divided into 100 sec bins |
 |
 |
| Module-wise count rates for Quadrant C Data is divided into 100 sec bins |
 |
 |
| Module-wise count rates for Quadrant D Data is divided into 100 sec bins |
 |
 |
| Parameter | Plot |
|---|---|
| CZT HV Monitor | 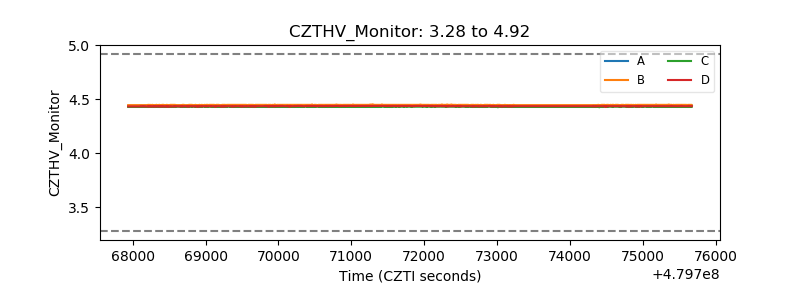 |
| D_VDD | 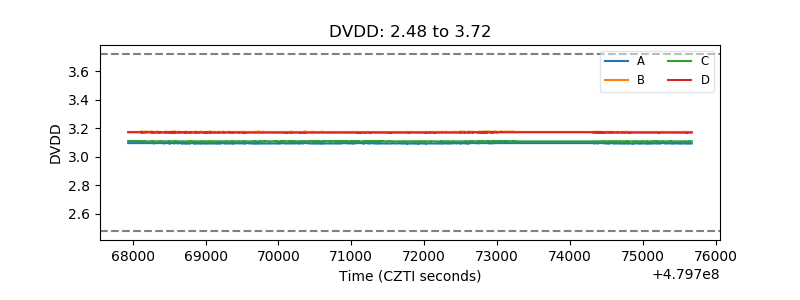 |
| Temperature 1 | 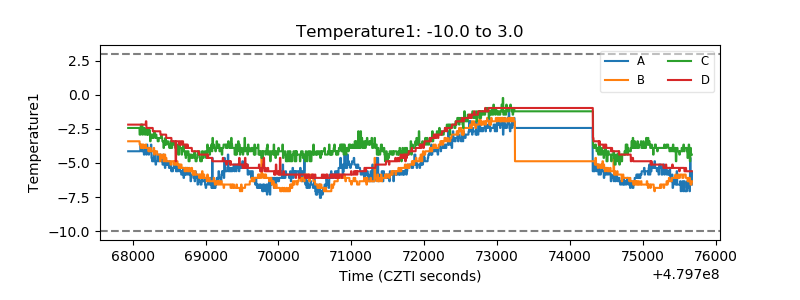 |
| Veto HV Monitor | 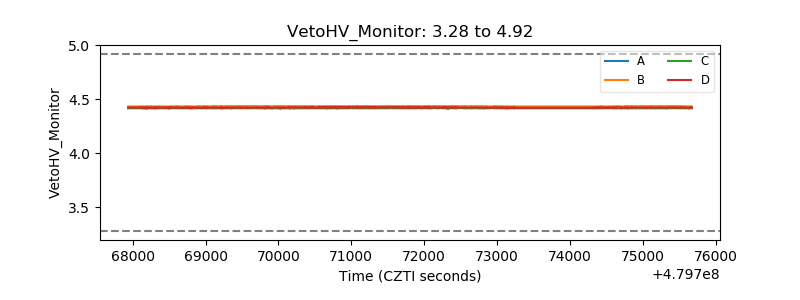 |
| Veto LLD | 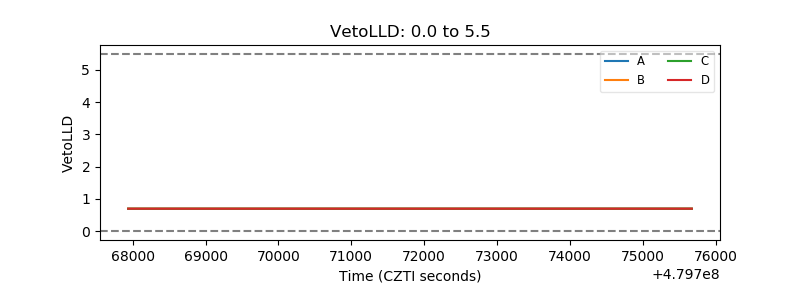 |
| Alpha Counter | 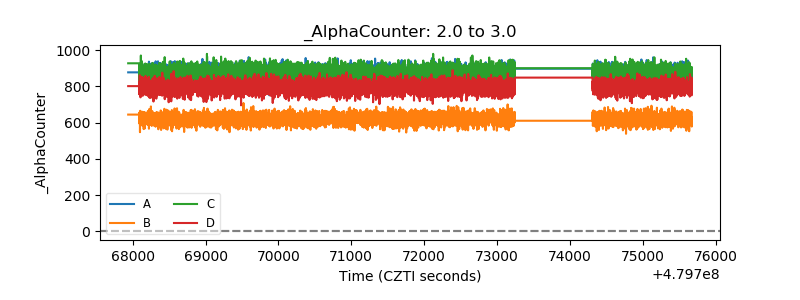 |
| _CPM_Rate | 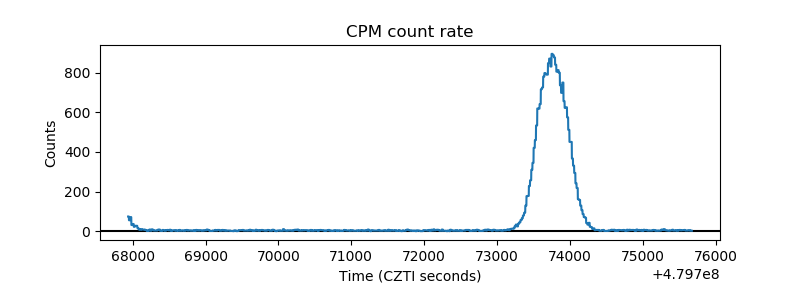 |
| CZT Counter | 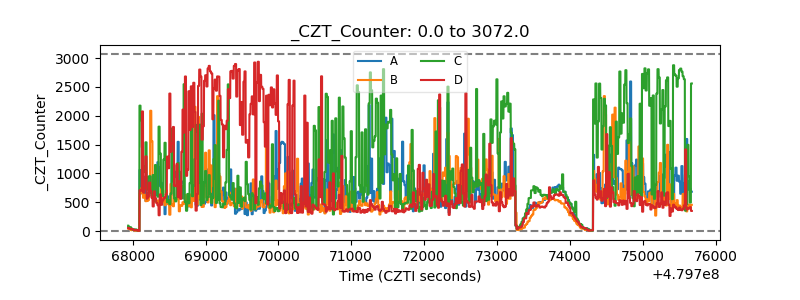 |
| +2.5 Volts monitor | 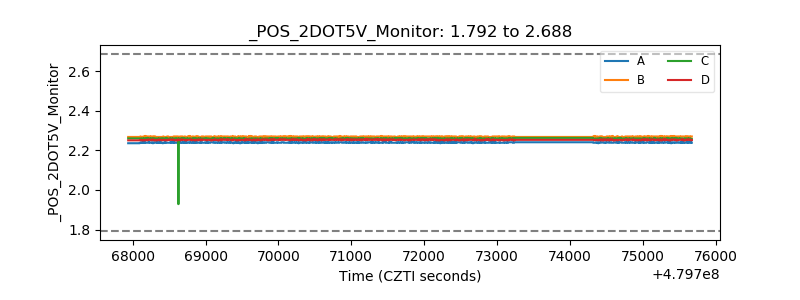 |
| +5 Volts monitor | 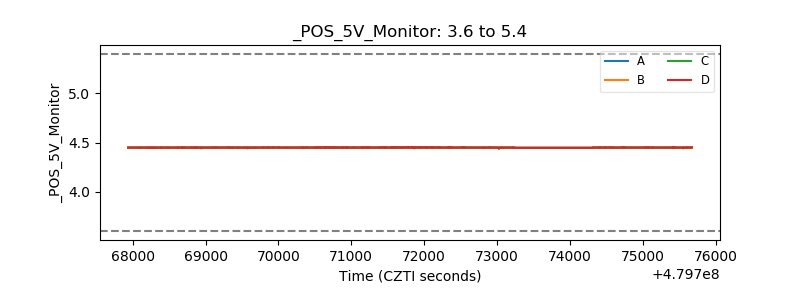 |
| _ROLL_ROT | 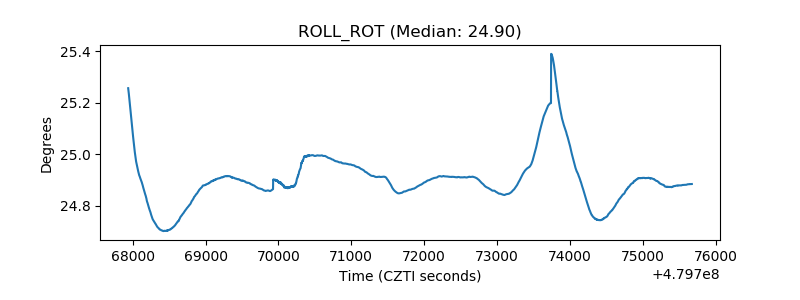 |
| _Roll_DEC | 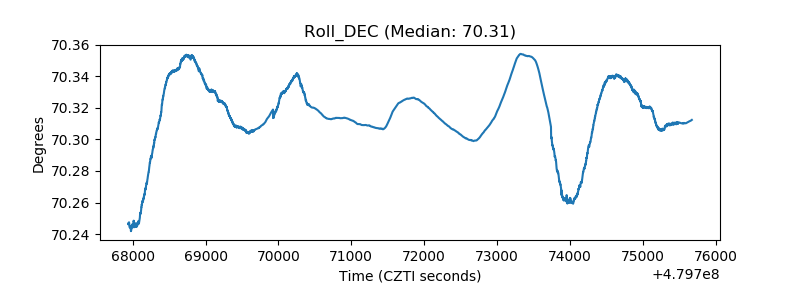 |
| _Roll_RA | 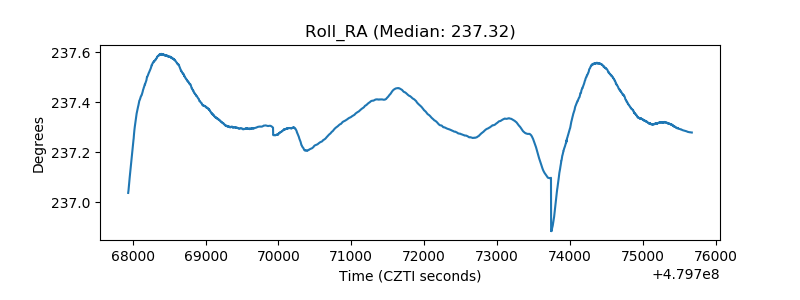 |
| Veto Counter | 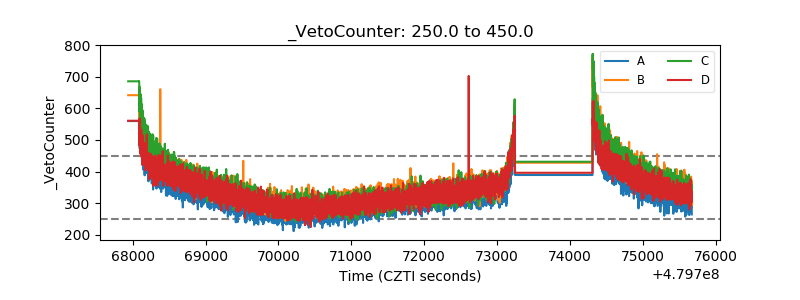 |