| Param | Original file | Final file |
|---|---|---|
| Filename | modeM0/AS1C07_001T01_9000006454_51189cztM0_level2.fits | modeM0/AS1C07_001T01_9000006454_51189cztM0_level2_quad_clean.evt |
| Size (bytes) | 700,822,080 | 85,187,520 |
| Size | 668.4 MB | 81.2 MB |
| Events in quadrant A | 5,309,792 | 598,202 |
| Events in quadrant B | 4,400,814 | 665,516 |
| Events in quadrant C | 11,674,918 | 308,146 |
| Events in quadrant D | 4,062,679 | 562,349 |
| Mode M0 | |||
|---|---|---|---|
| Quadrant | BADHDUFLAG | Total packets | Discarded packets |
| A | 0 | 20237 | 2 |
| B | 0 | 17498 | 2 |
| C | 0 | 38971 | 2 |
| D | 0 | 16660 | 2 |
| Mode SS | |||
|---|---|---|---|
| Quadrant | BADHDUFLAG | Total packets | Discarded packets |
| A | 0 | 130 | 0 |
| B | 0 | 130 | 0 |
| C | 0 | 130 | 0 |
| D | 0 | 130 | 0 |
| Mode M9 | |||
|---|---|---|---|
| Quadrant | BADHDUFLAG | Total packets | Discarded packets |
| A | 0 | 16 | 0 |
| B | 0 | 17 | 0 |
| C | 0 | 17 | 0 |
| D | 0 | 17 | 0 |
| Quadrant | Total seconds | Saturated seconds | Saturation percentage |
|---|---|---|---|
| A | 6376 | 265 | 4.156211% |
| B | 6376 | 223 | 3.497491% |
| C | 6376 | 3406 | 53.419072% |
| D | 6376 | 117 | 1.835006% |
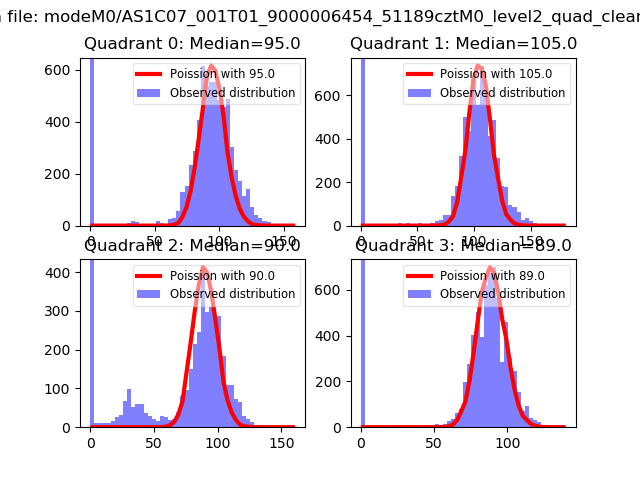
Noise dominated data is calculated using 1-second bins in cleaned event files. If a bin has >2000 counts, and if more than 50% of those come from <1% of pixels, then it is considered to be noise-dominated and hence unusable.
| Quadrant | # 1 sec bins | Bins with >0 counts | Bins with >2000 counts | High rate bins dominated by noise | Noise dominated (total time) | Noise dominated (detector-on time) | Marked lightcurve |
|---|---|---|---|---|---|---|---|
| A | 7541 | 6377 | 172 | 172 | 2.28% | 2.70% | 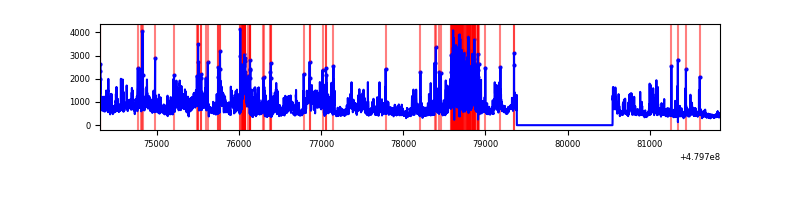 |
| B | 7541 | 6377 | 113 | 113 | 1.50% | 1.77% | 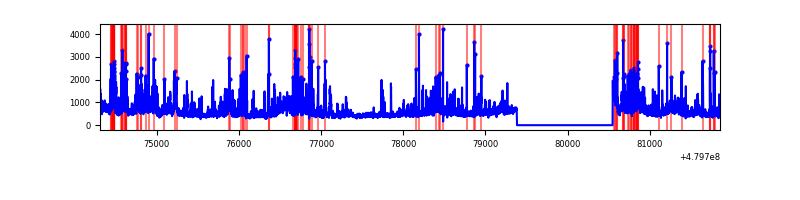 |
| C | 7540 | 6376 | 2893 | 2893 | 38.37% | 45.37% | 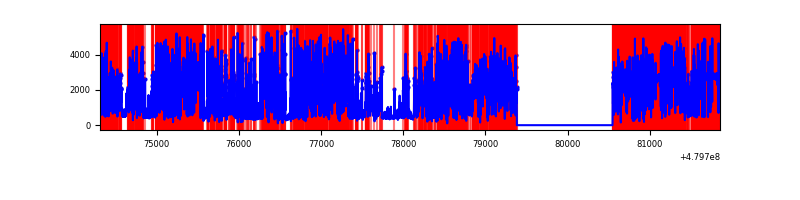 |
| D | 7541 | 6377 | 156 | 156 | 2.07% | 2.45% | 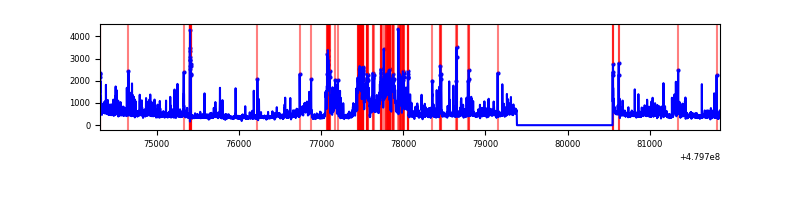 |
Top three noisy pixels from each quadrant. If the there are fewer than three noisy pixels in the level2.evt file, extra rows are filled as -1
| Pixel properties | Quadrant properties | ||||||
|---|---|---|---|---|---|---|---|
| Quadrant | DetID | PixID | Counts | Sigma | Mean | Median | Sigma |
| A | 12 | 3 | 798099 | 4838.48 | 657 | 641 | 164.8 |
| A | 9 | 160 | 630550 | 3821.9 | 657 | 641 | 164.8 |
| A | 13 | 248 | 450305 | 2728.28 | 657 | 641 | 164.8 |
| B | 8 | 128 | 525141 | 3757.27 | 664 | 642 | 139.6 |
| B | 10 | 254 | 275201 | 1966.82 | 664 | 642 | 139.6 |
| B | 7 | 252 | 180955 | 1291.68 | 664 | 642 | 139.6 |
| C | 4 | 12 | 8516479 | 67683.8 | 450 | 447 | 125.8 |
| C | 12 | 247 | 557405 | 4426.6 | 450 | 447 | 125.8 |
| C | 13 | 3 | 234356 | 1859.06 | 450 | 447 | 125.8 |
| D | 3 | 12 | 774378 | 4256.13 | 642 | 619 | 181.8 |
| D | 2 | 216 | 102110 | 558.26 | 642 | 619 | 181.8 |
| D | 6 | 42 | 86096 | 470.17 | 642 | 619 | 181.8 |
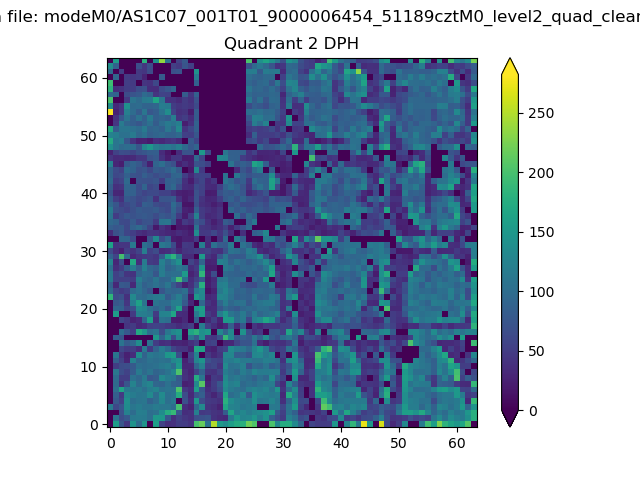
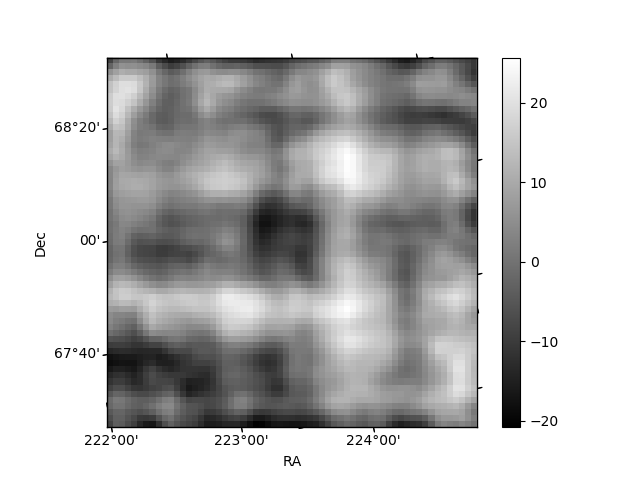
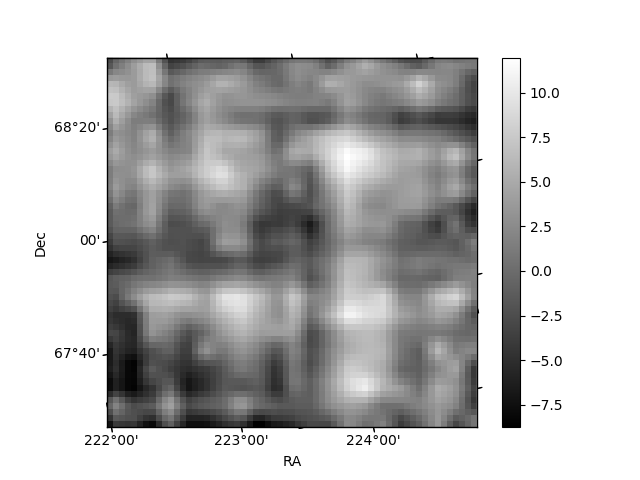
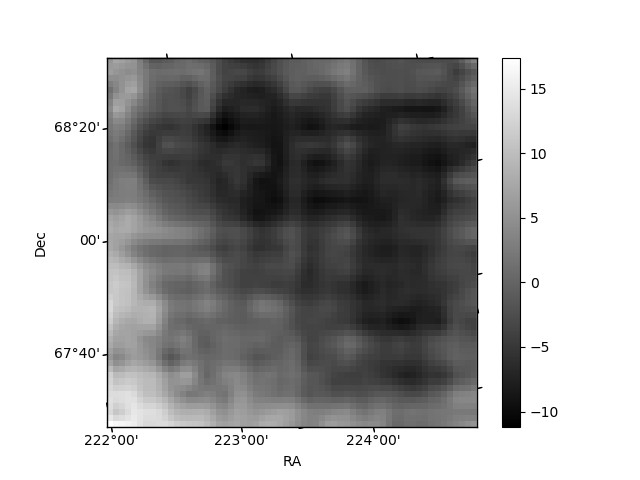
Histogram calculated using DETX and DETY for each event in the final _common_clean file
| Quadrant A | 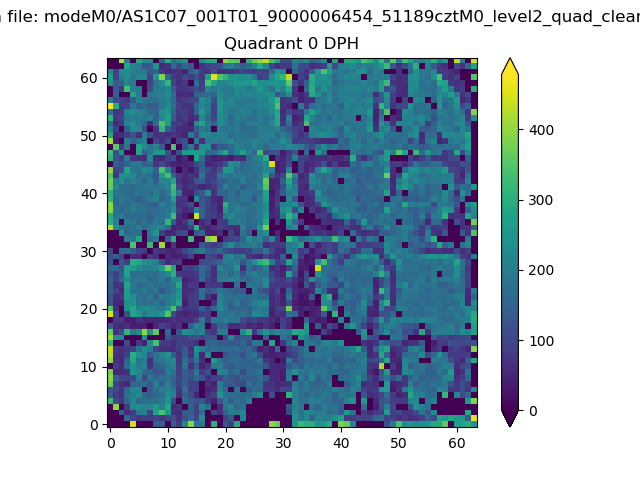 |
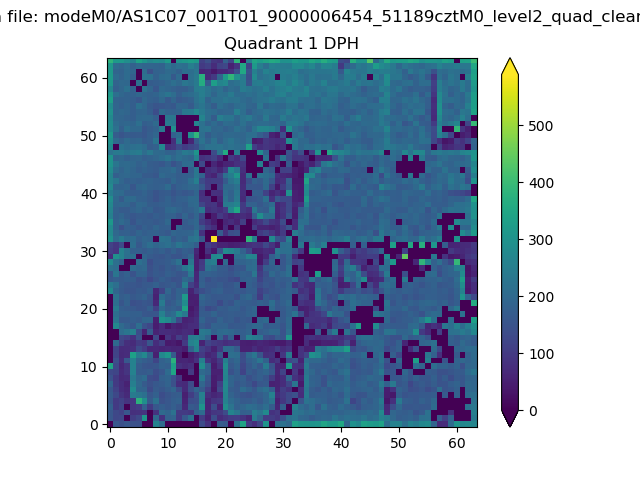 |
Quadrant B |
|---|---|---|---|
| Quadrant D | 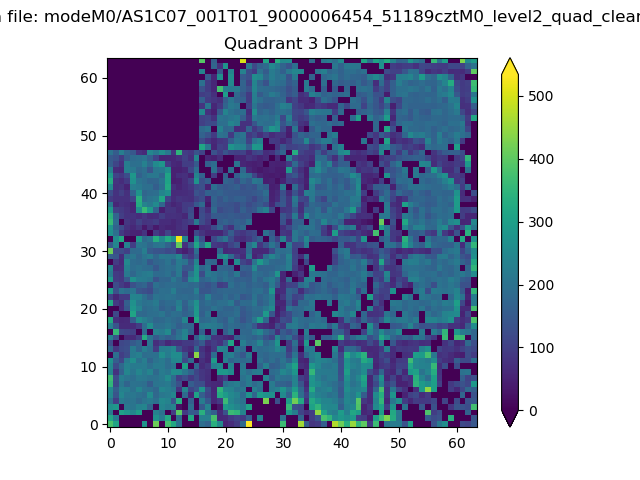 |
 |
Quadrant C |
| Plot type | Count rate plots | Images |
|---|---|---|
| Comparison with Poisson distribution Blue bars denote a histogram of data divided into 1 sec bins. Red curve is a Poisson curve with rate = median count rate of data. |
 |
 |
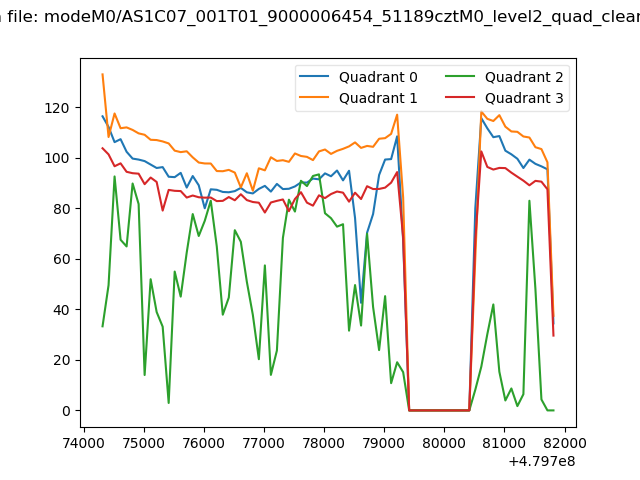
| Quadrant-wise count rates Data is divided into 100 sec bins |
 |
|
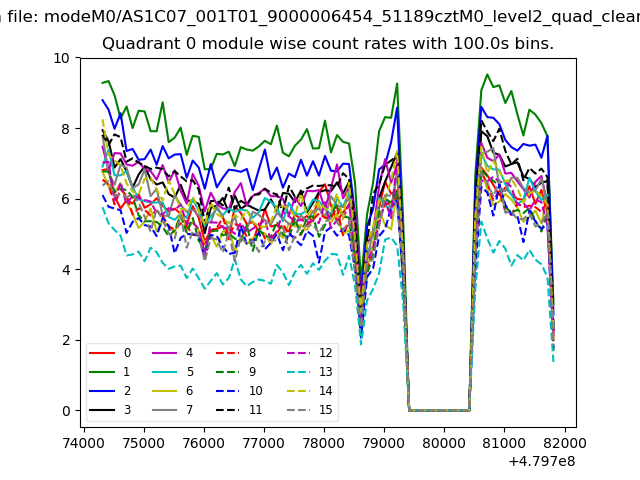
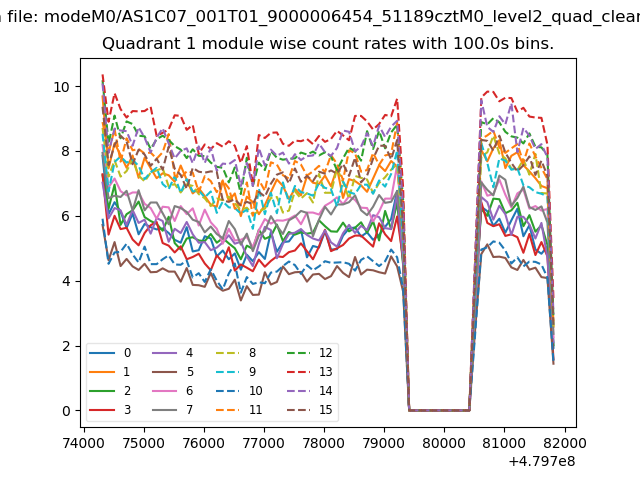
| Module-wise count rates for Quadrant A Data is divided into 100 sec bins |
 |
 |
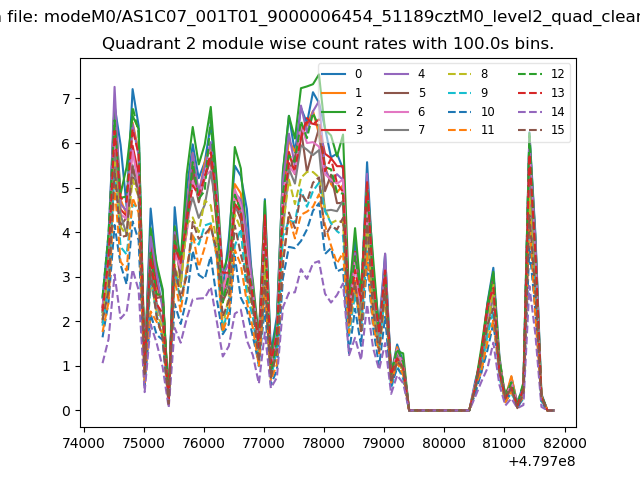
| Module-wise count rates for Quadrant B Data is divided into 100 sec bins |
 |
 |
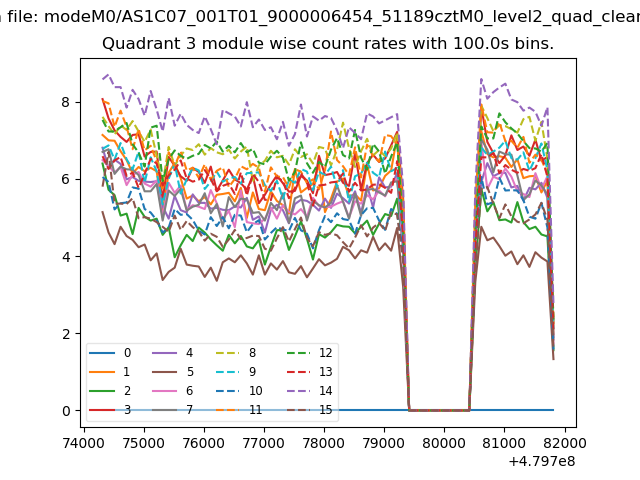
| Module-wise count rates for Quadrant C Data is divided into 100 sec bins |
 |
 |
| Module-wise count rates for Quadrant D Data is divided into 100 sec bins |
 |
 |
| Parameter | Plot |
|---|---|
| CZT HV Monitor | 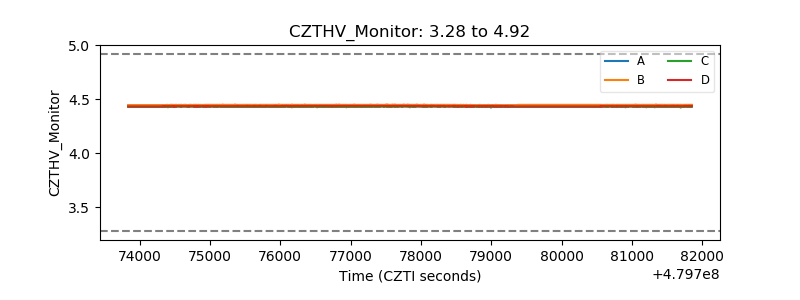 |
| D_VDD |  |
| Temperature 1 | 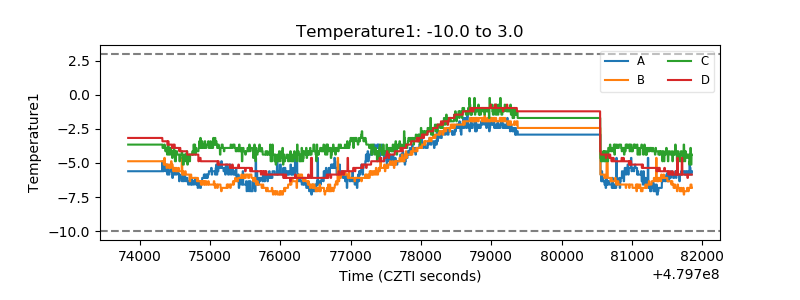 |
| Veto HV Monitor | 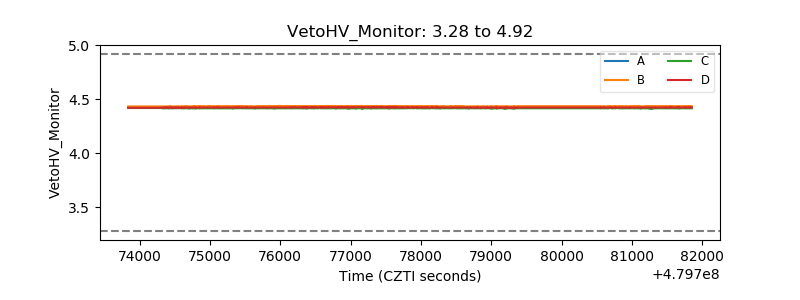 |
| Veto LLD | 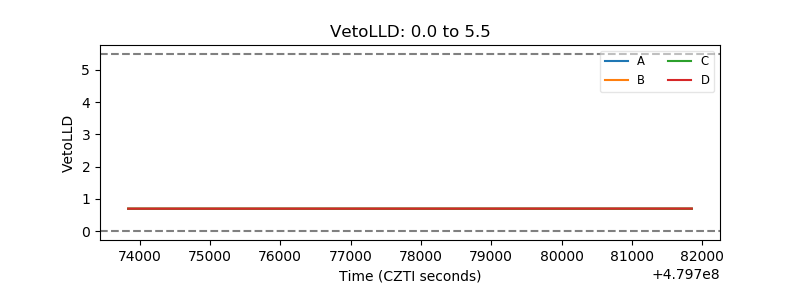 |
| Alpha Counter | 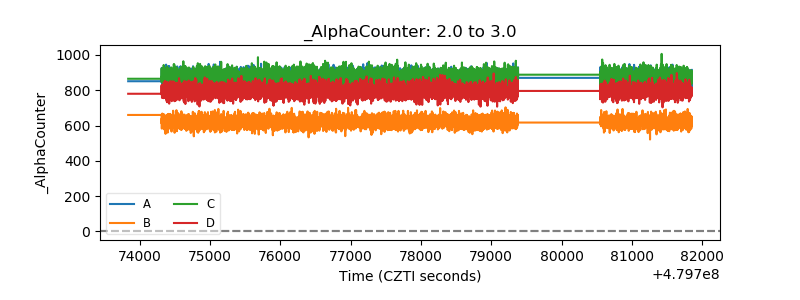 |
| _CPM_Rate | 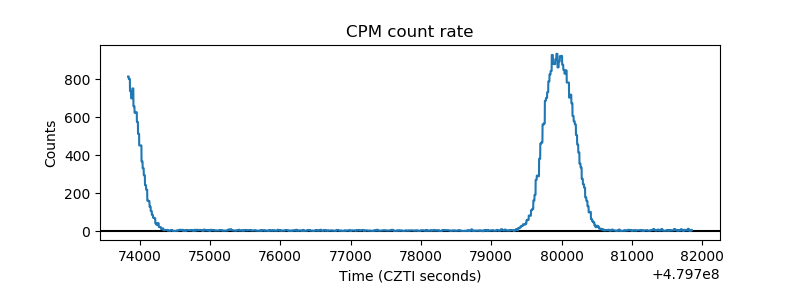 |
| CZT Counter | 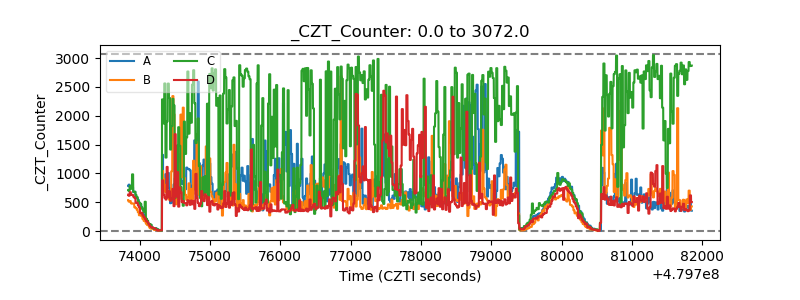 |
| +2.5 Volts monitor |  |
| +5 Volts monitor |  |
| _ROLL_ROT | 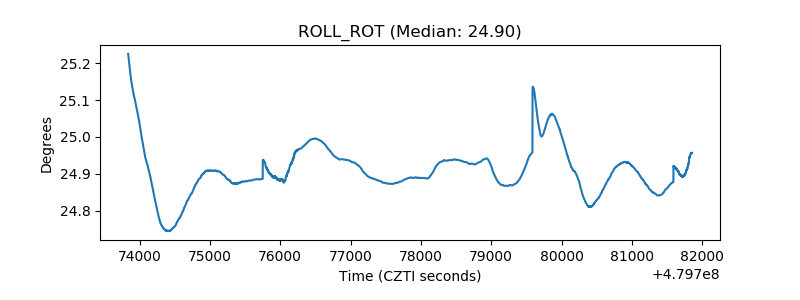 |
| _Roll_DEC | 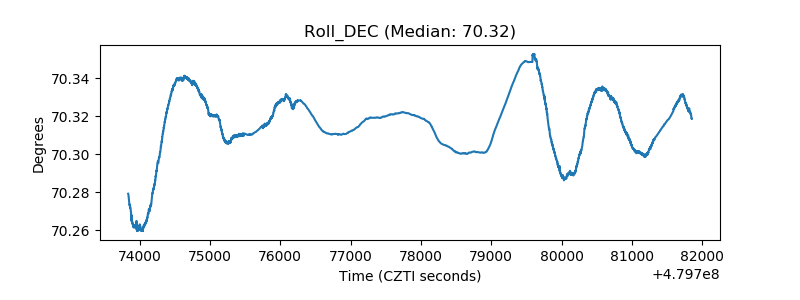 |
| _Roll_RA | 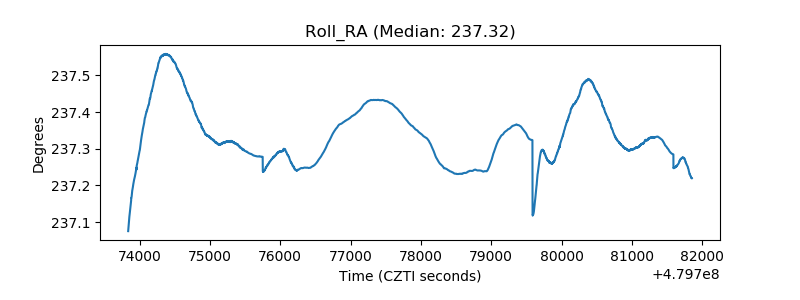 |
| Veto Counter | 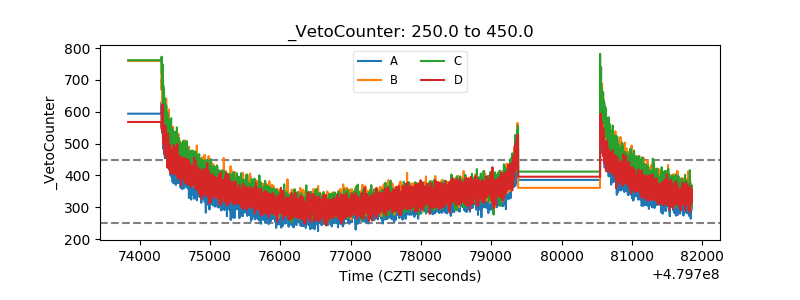 |