| Param | Original file | Final file |
|---|---|---|
| Filename | modeM0/AS1C07_001T01_9000006454_51190cztM0_level2.fits | modeM0/AS1C07_001T01_9000006454_51190cztM0_level2_quad_clean.evt |
| Size (bytes) | 752,906,880 | 87,036,480 |
| Size | 718.0 MB | 83.0 MB |
| Events in quadrant A | 4,279,469 | 643,570 |
| Events in quadrant B | 4,265,830 | 709,626 |
| Events in quadrant C | 14,918,855 | 220,650 |
| Events in quadrant D | 3,881,252 | 590,400 |
| Mode M0 | |||
|---|---|---|---|
| Quadrant | BADHDUFLAG | Total packets | Discarded packets |
| A | 0 | 17342 | 2 |
| B | 0 | 17380 | 2 |
| C | 0 | 48698 | 2 |
| D | 0 | 16585 | 2 |
| Mode SS | |||
|---|---|---|---|
| Quadrant | BADHDUFLAG | Total packets | Discarded packets |
| A | 0 | 138 | 0 |
| B | 0 | 138 | 0 |
| C | 0 | 138 | 0 |
| D | 0 | 138 | 0 |
| Mode M9 | |||
|---|---|---|---|
| Quadrant | BADHDUFLAG | Total packets | Discarded packets |
| A | 0 | 23 | 0 |
| B | 0 | 23 | 0 |
| C | 0 | 23 | 0 |
| D | 0 | 23 | 0 |
| Quadrant | Total seconds | Saturated seconds | Saturation percentage |
|---|---|---|---|
| A | 6762 | 141 | 2.085182% |
| B | 6763 | 161 | 2.380600% |
| C | 6763 | 4757 | 70.338607% |
| D | 6763 | 151 | 2.232737% |
Noise dominated data is calculated using 1-second bins in cleaned event files. If a bin has >2000 counts, and if more than 50% of those come from <1% of pixels, then it is considered to be noise-dominated and hence unusable.
| Quadrant | # 1 sec bins | Bins with >0 counts | Bins with >2000 counts | High rate bins dominated by noise | Noise dominated (total time) | Noise dominated (detector-on time) | Marked lightcurve |
|---|---|---|---|---|---|---|---|
| A | 9073 | 6764 | 86 | 86 | 0.95% | 1.27% | 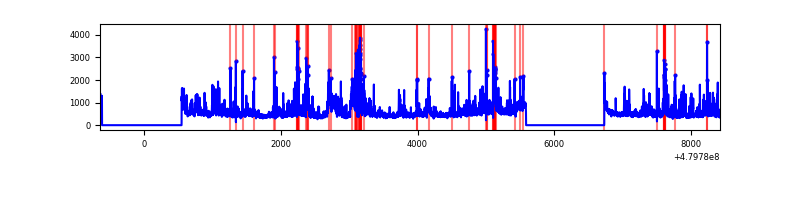 |
| B | 9074 | 6765 | 70 | 70 | 0.77% | 1.03% | 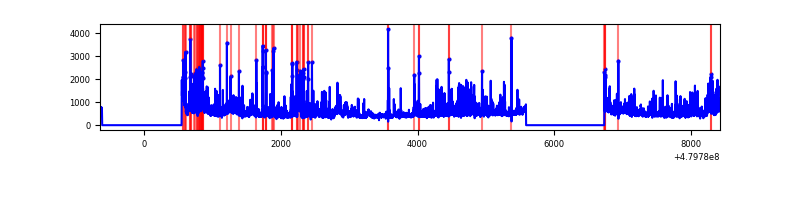 |
| C | 9074 | 6765 | 4283 | 4283 | 47.20% | 63.31% | 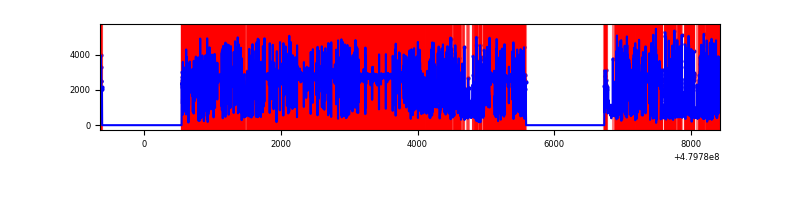 |
| D | 9074 | 6765 | 112 | 112 | 1.23% | 1.66% | 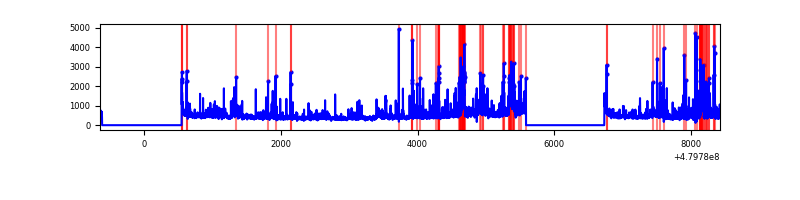 |
Top three noisy pixels from each quadrant. If the there are fewer than three noisy pixels in the level2.evt file, extra rows are filled as -1
| Pixel properties | Quadrant properties | ||||||
|---|---|---|---|---|---|---|---|
| Quadrant | DetID | PixID | Counts | Sigma | Mean | Median | Sigma |
| A | 12 | 3 | 277457 | 1591.31 | 701 | 684 | 173.9 |
| A | 9 | 160 | 243878 | 1398.25 | 701 | 684 | 173.9 |
| A | 14 | 254 | 237831 | 1363.48 | 701 | 684 | 173.9 |
| B | 8 | 128 | 356099 | 2375.96 | 706 | 684 | 149.6 |
| B | 10 | 60 | 217785 | 1451.33 | 706 | 684 | 149.6 |
| B | 10 | 254 | 175558 | 1169.04 | 706 | 684 | 149.6 |
| C | 4 | 12 | 11511324 | 111516.41 | 373 | 371 | 103.2 |
| C | 12 | 247 | 1286721 | 12461.97 | 373 | 371 | 103.2 |
| C | 13 | 3 | 88062 | 849.54 | 373 | 371 | 103.2 |
| D | 10 | 172 | 159064 | 836.61 | 673 | 650 | 189.4 |
| D | 2 | 216 | 156775 | 824.52 | 673 | 650 | 189.4 |
| D | 11 | 176 | 149755 | 787.45 | 673 | 650 | 189.4 |
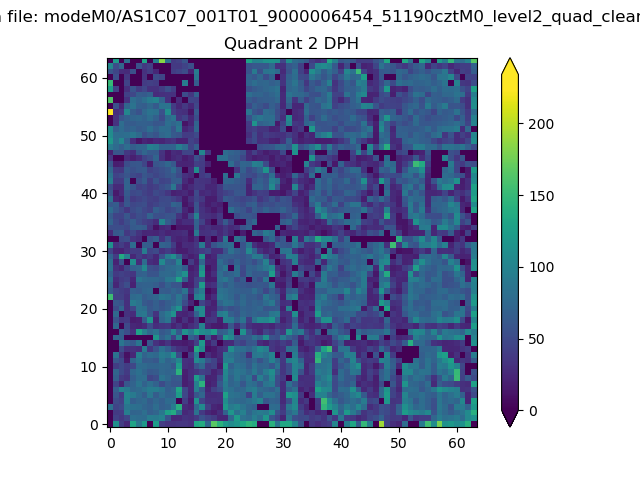
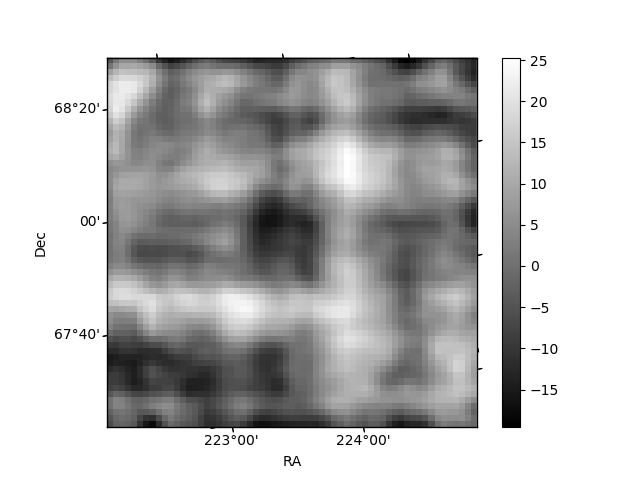
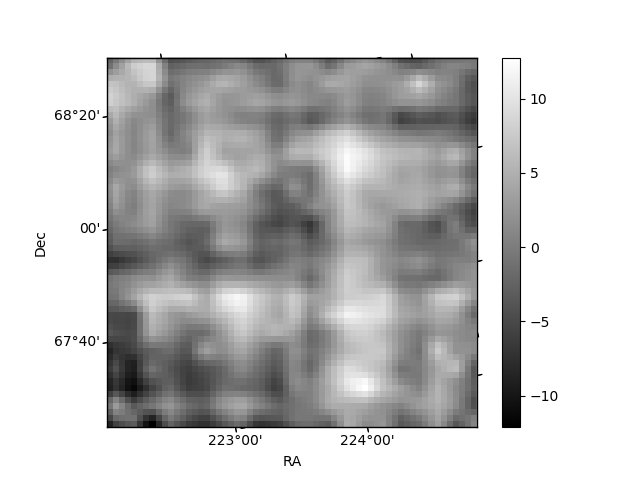
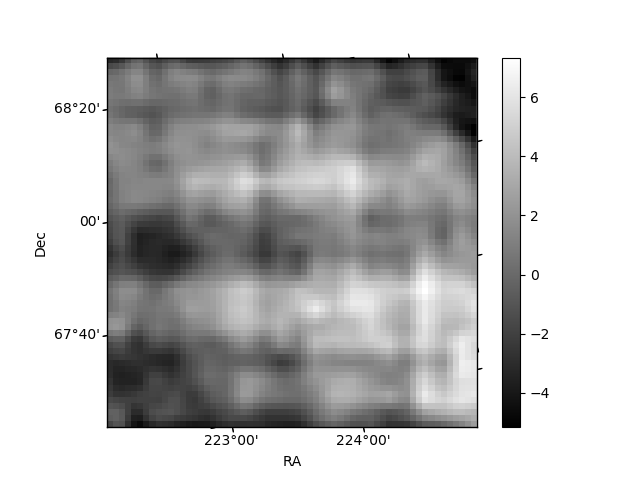
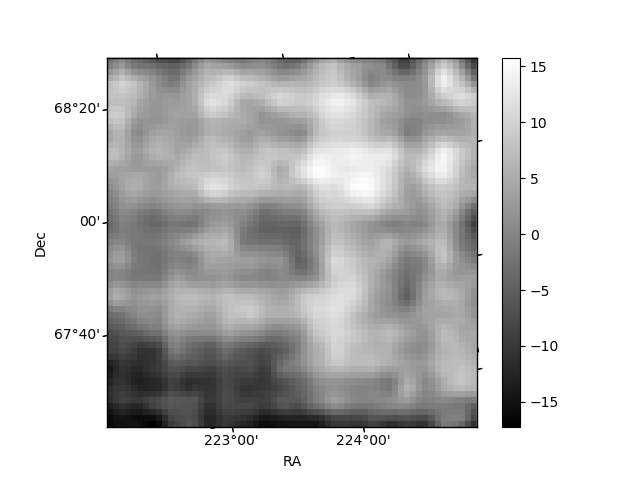
Histogram calculated using DETX and DETY for each event in the final _common_clean file
| Quadrant A | 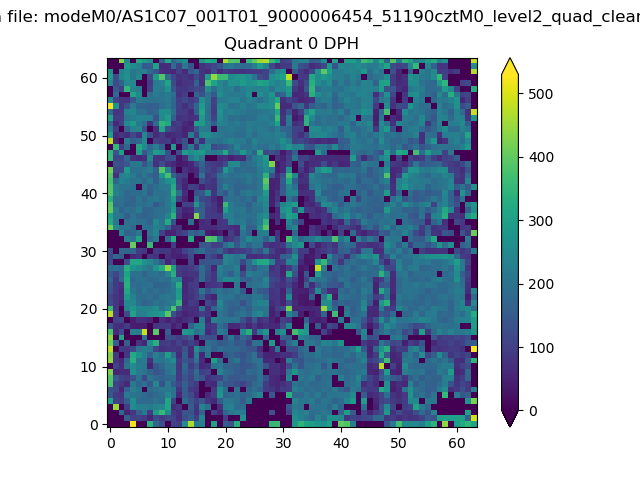 |
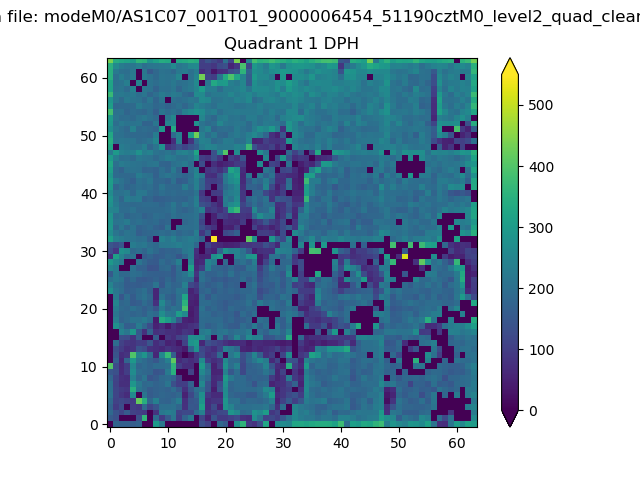 |
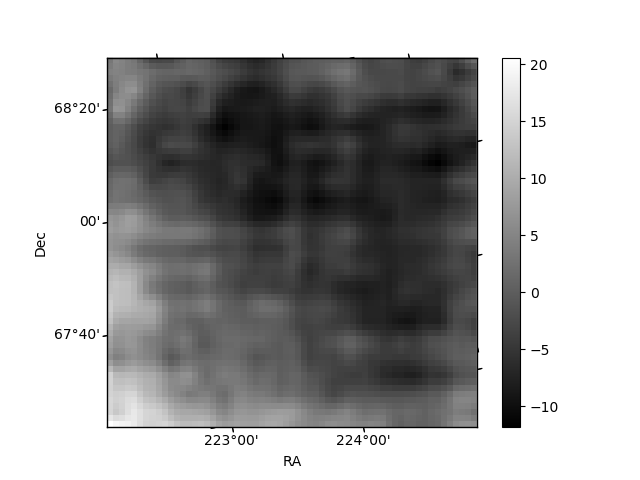
Quadrant B |
|---|---|---|---|
| Quadrant D | 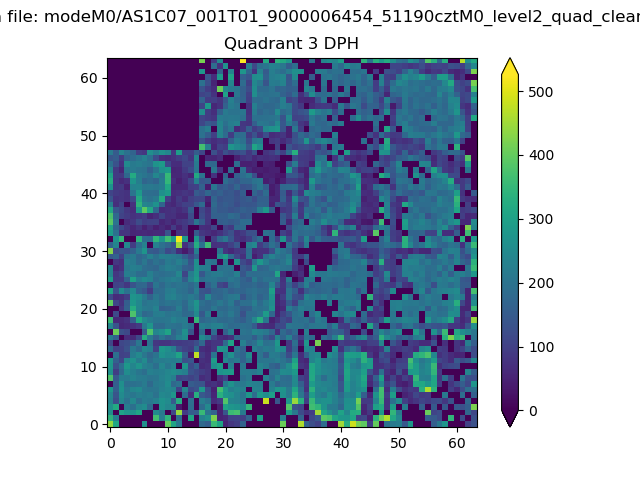 |
 |
Quadrant C |
| Plot type | Count rate plots | Images |
|---|---|---|
| Comparison with Poisson distribution Blue bars denote a histogram of data divided into 1 sec bins. Red curve is a Poisson curve with rate = median count rate of data. |
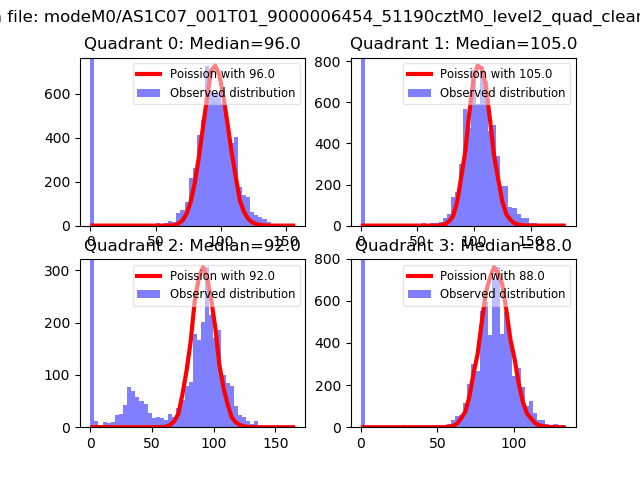 |
 |
| Quadrant-wise count rates Data is divided into 100 sec bins |
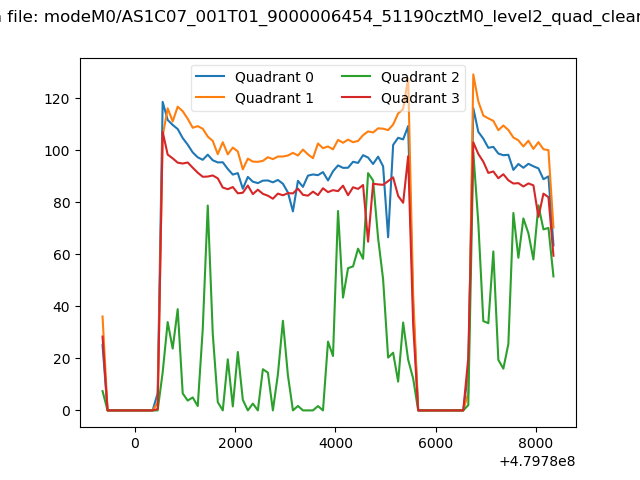 |
|
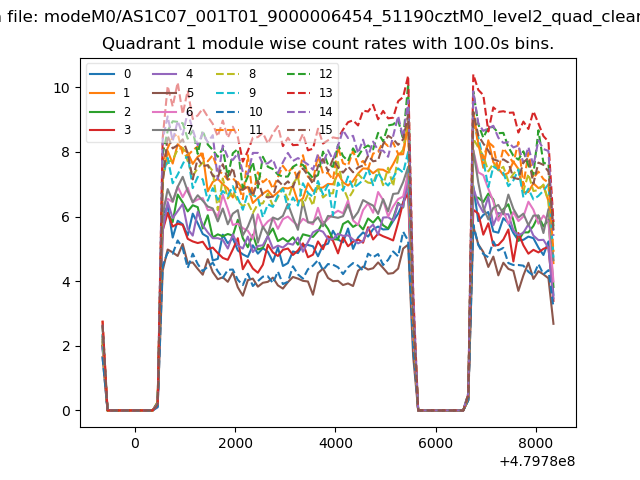
| Module-wise count rates for Quadrant A Data is divided into 100 sec bins |
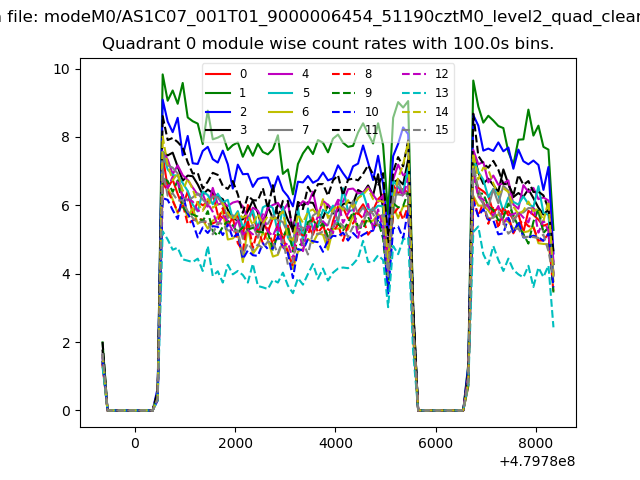 |
 |
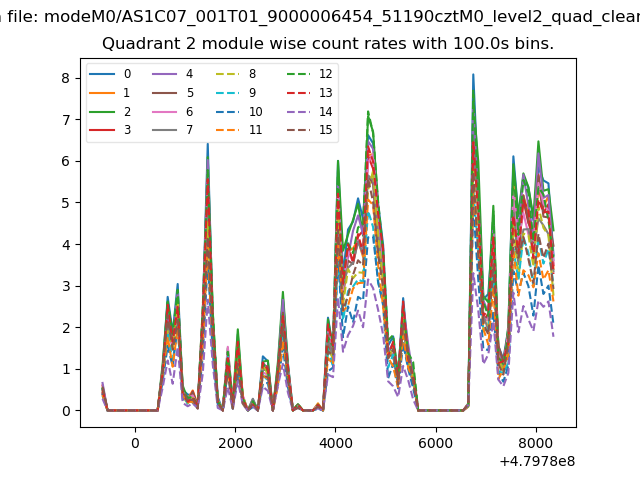
| Module-wise count rates for Quadrant B Data is divided into 100 sec bins |
 |
 |
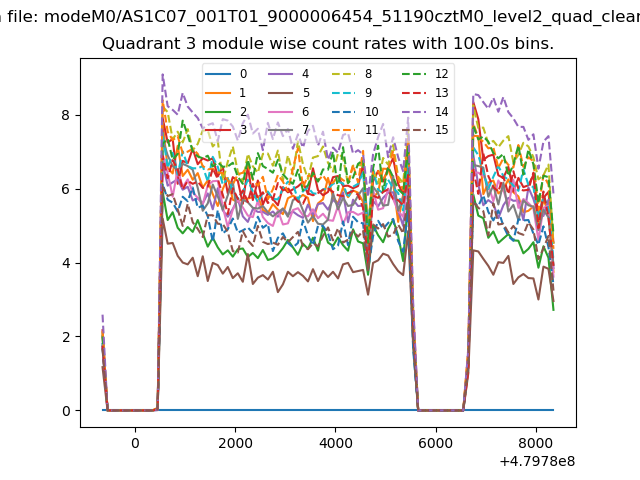
| Module-wise count rates for Quadrant C Data is divided into 100 sec bins |
 |
 |
| Module-wise count rates for Quadrant D Data is divided into 100 sec bins |
 |
 |
| Parameter | Plot |
|---|---|
| CZT HV Monitor | 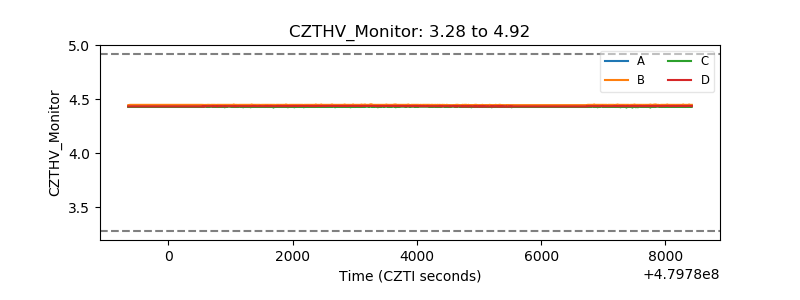 |
| D_VDD | 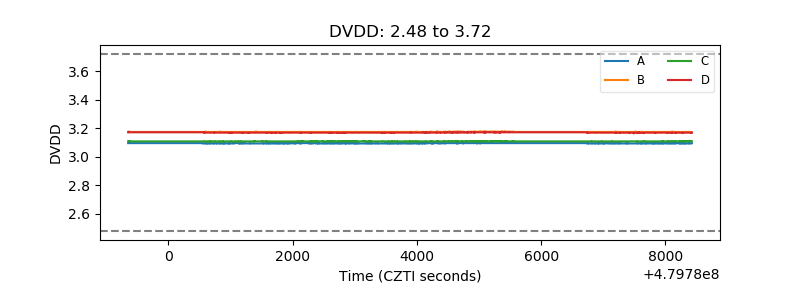 |
| Temperature 1 | 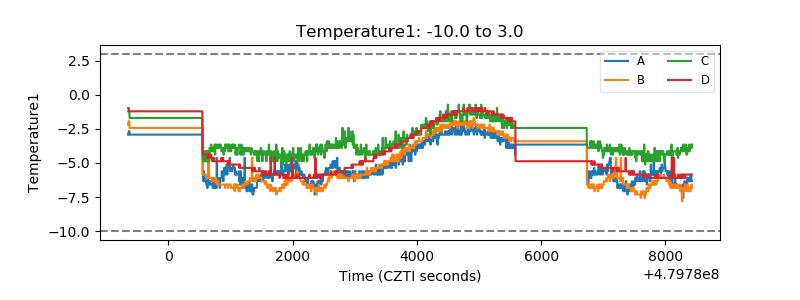 |
| Veto HV Monitor | 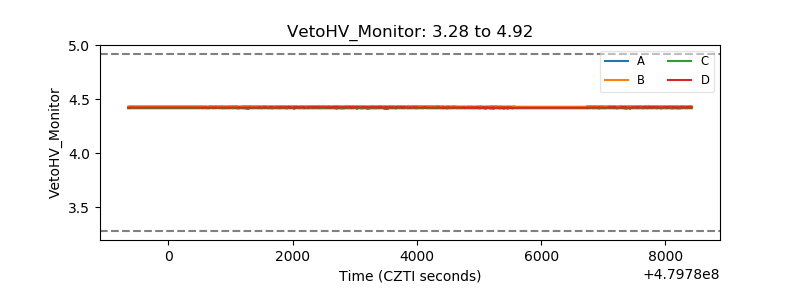 |
| Veto LLD | 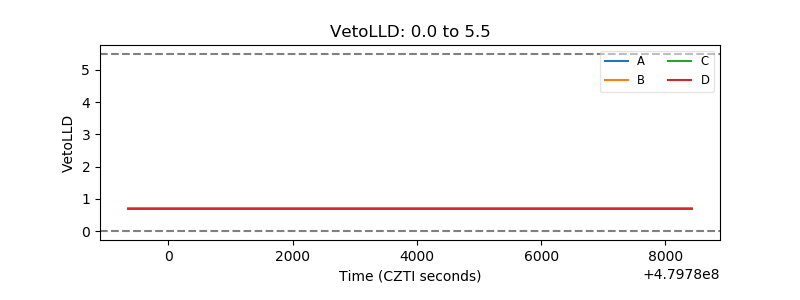 |
| Alpha Counter | 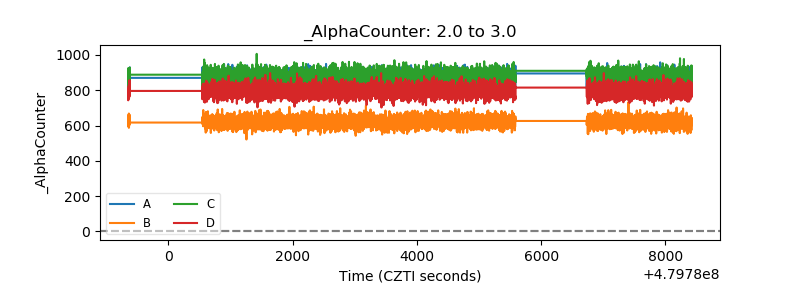 |
| _CPM_Rate | 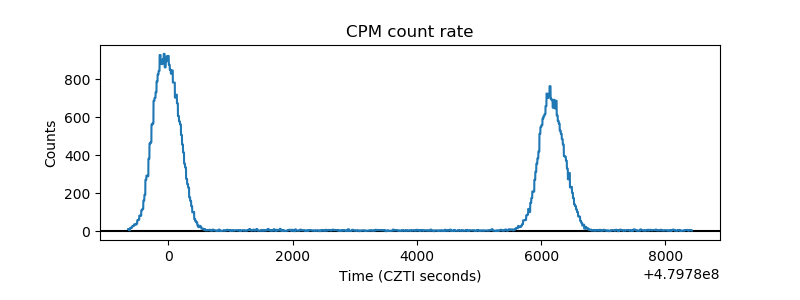 |
| CZT Counter | 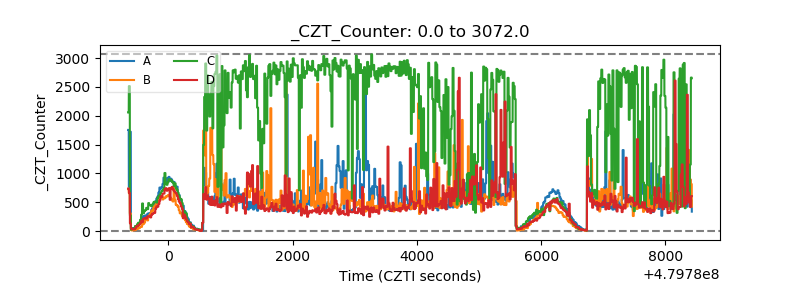 |
| +2.5 Volts monitor | 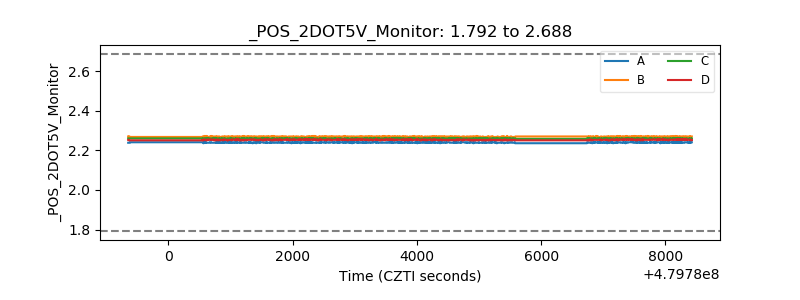 |
| +5 Volts monitor | 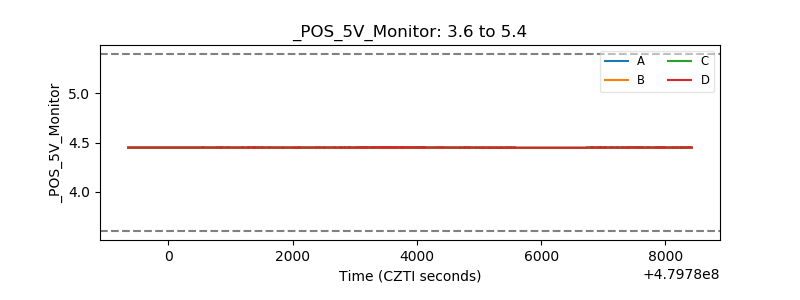 |
| _ROLL_ROT | 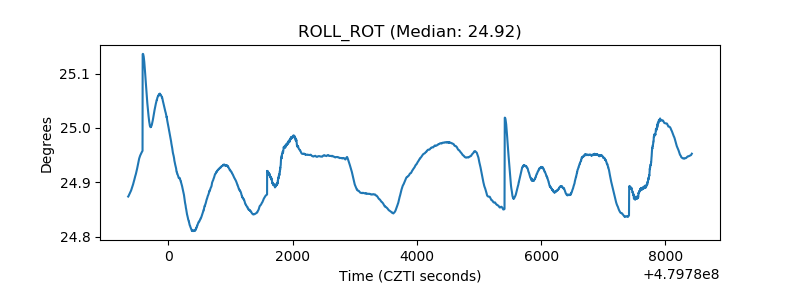 |
| _Roll_DEC | 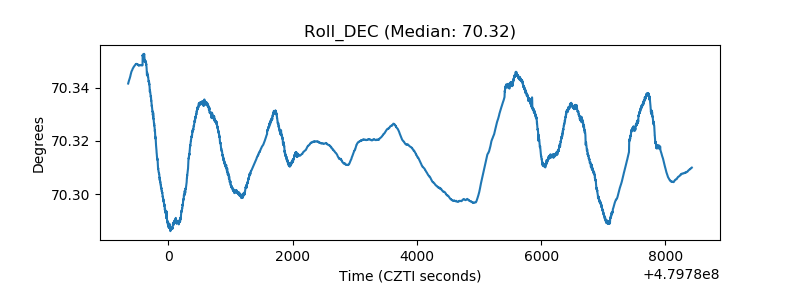 |
| _Roll_RA | 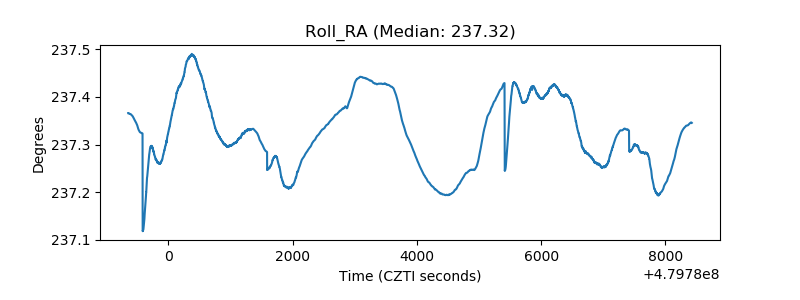 |
| Veto Counter | 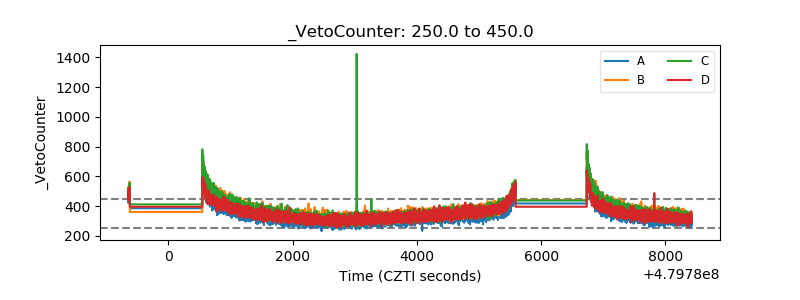 |