| Param | Original file | Final file |
|---|---|---|
| Filename | modeM0/AS1C07_001T01_9000006454_51191cztM0_level2.fits | modeM0/AS1C07_001T01_9000006454_51191cztM0_level2_quad_clean.evt |
| Size (bytes) | 725,578,560 | 89,484,480 |
| Size | 692.0 MB | 85.3 MB |
| Events in quadrant A | 4,300,377 | 627,377 |
| Events in quadrant B | 4,653,089 | 701,569 |
| Events in quadrant C | 12,603,685 | 345,700 |
| Events in quadrant D | 4,775,724 | 561,821 |
| Mode M0 | |||
|---|---|---|---|
| Quadrant | BADHDUFLAG | Total packets | Discarded packets |
| A | 0 | 17643 | 2 |
| B | 0 | 18529 | 2 |
| C | 0 | 42098 | 2 |
| D | 0 | 19065 | 2 |
| Mode SS | |||
|---|---|---|---|
| Quadrant | BADHDUFLAG | Total packets | Discarded packets |
| A | 0 | 138 | 0 |
| B | 0 | 138 | 0 |
| C | 0 | 138 | 0 |
| D | 0 | 138 | 0 |
| Mode M9 | |||
|---|---|---|---|
| Quadrant | BADHDUFLAG | Total packets | Discarded packets |
| A | 0 | 16 | 0 |
| B | 0 | 17 | 0 |
| C | 0 | 17 | 0 |
| D | 0 | 17 | 0 |
| Quadrant | Total seconds | Saturated seconds | Saturation percentage |
|---|---|---|---|
| A | 6784 | 259 | 3.817807% |
| B | 6784 | 149 | 2.196344% |
| C | 6784 | 3479 | 51.282429% |
| D | 6784 | 369 | 5.439269% |
Noise dominated data is calculated using 1-second bins in cleaned event files. If a bin has >2000 counts, and if more than 50% of those come from <1% of pixels, then it is considered to be noise-dominated and hence unusable.
| Quadrant | # 1 sec bins | Bins with >0 counts | Bins with >2000 counts | High rate bins dominated by noise | Noise dominated (total time) | Noise dominated (detector-on time) | Marked lightcurve |
|---|---|---|---|---|---|---|---|
| A | 7879 | 6785 | 162 | 162 | 2.06% | 2.39% | 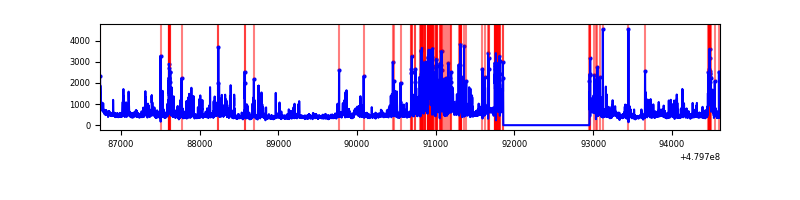 |
| B | 7879 | 6785 | 57 | 57 | 0.72% | 0.84% | 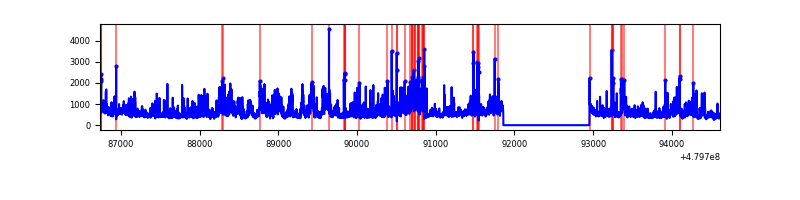 |
| C | 7879 | 6785 | 3120 | 3120 | 39.60% | 45.98% | 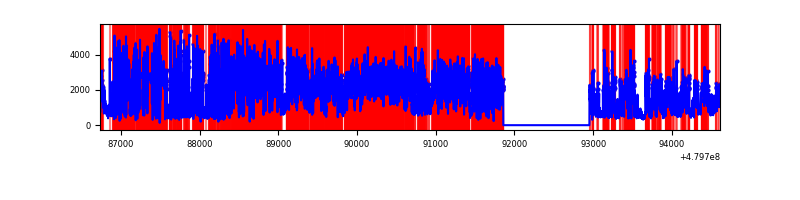 |
| D | 7879 | 6785 | 329 | 329 | 4.18% | 4.85% | 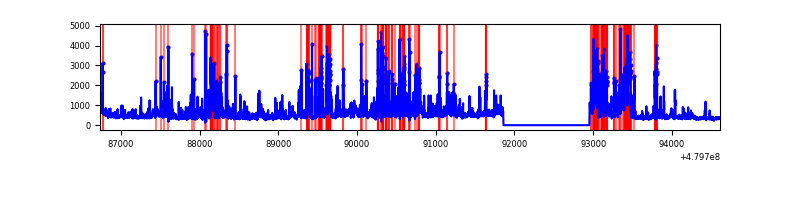 |
Top three noisy pixels from each quadrant. If the there are fewer than three noisy pixels in the level2.evt file, extra rows are filled as -1
| Pixel properties | Quadrant properties | ||||||
|---|---|---|---|---|---|---|---|
| Quadrant | DetID | PixID | Counts | Sigma | Mean | Median | Sigma |
| A | 13 | 248 | 439794 | 2563.34 | 692 | 674 | 171.3 |
| A | 3 | 62 | 410746 | 2393.77 | 692 | 674 | 171.3 |
| A | 4 | 207 | 202349 | 1177.27 | 692 | 674 | 171.3 |
| B | 10 | 254 | 1074921 | 7263.2 | 700 | 678 | 147.9 |
| B | 8 | 128 | 162398 | 1093.43 | 700 | 678 | 147.9 |
| B | 5 | 185 | 110583 | 743.09 | 700 | 678 | 147.9 |
| C | 4 | 12 | 5408930 | 36880.82 | 527 | 523 | 146.6 |
| C | 12 | 247 | 2882196 | 19650.6 | 527 | 523 | 146.6 |
| C | 15 | 229 | 1091205 | 7437.54 | 527 | 523 | 146.6 |
| D | 2 | 216 | 301957 | 1625.83 | 657 | 634 | 185.3 |
| D | 2 | 62 | 285547 | 1537.29 | 657 | 634 | 185.3 |
| D | 15 | 174 | 272816 | 1468.6 | 657 | 634 | 185.3 |
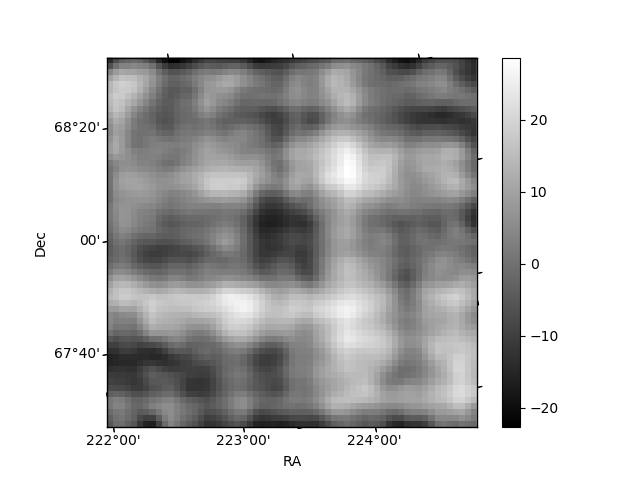
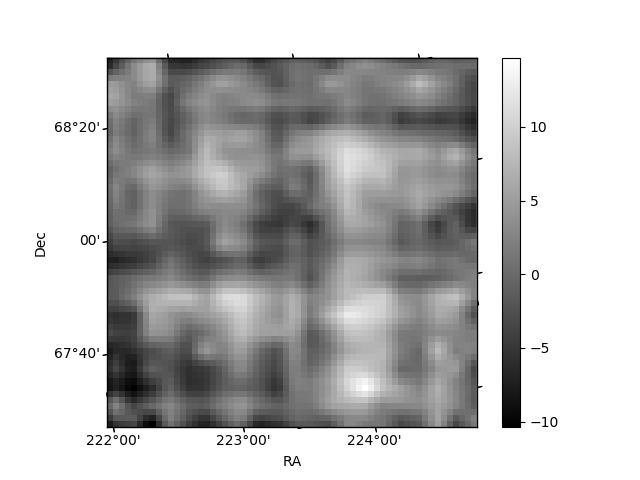
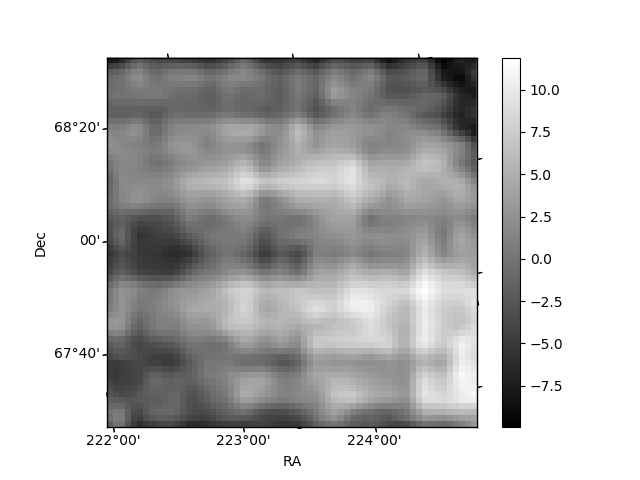
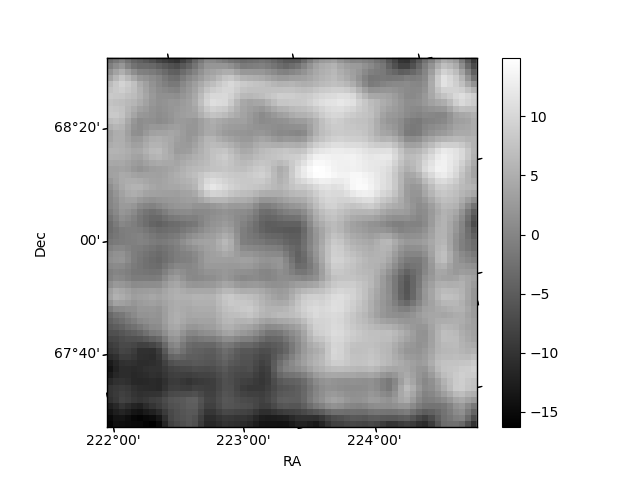
Histogram calculated using DETX and DETY for each event in the final _common_clean file
| Quadrant A | 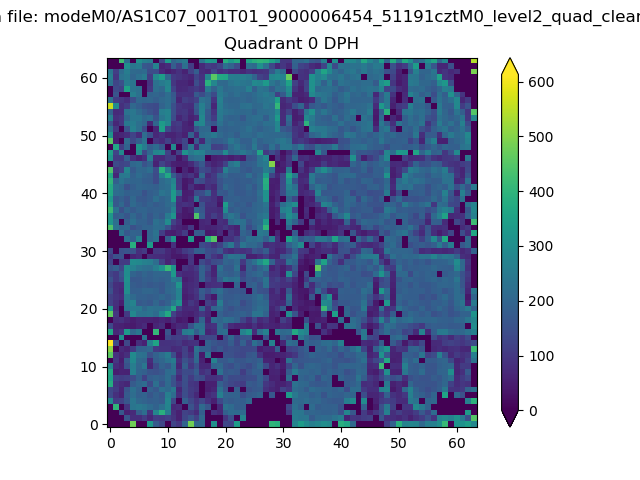 |
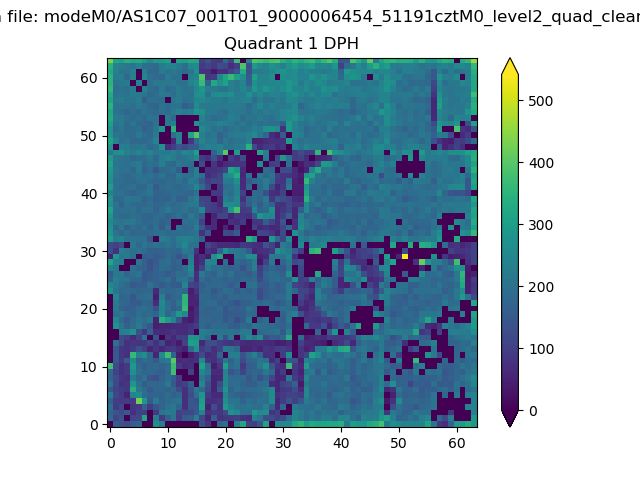 |
Quadrant B |
|---|---|---|---|
| Quadrant D | 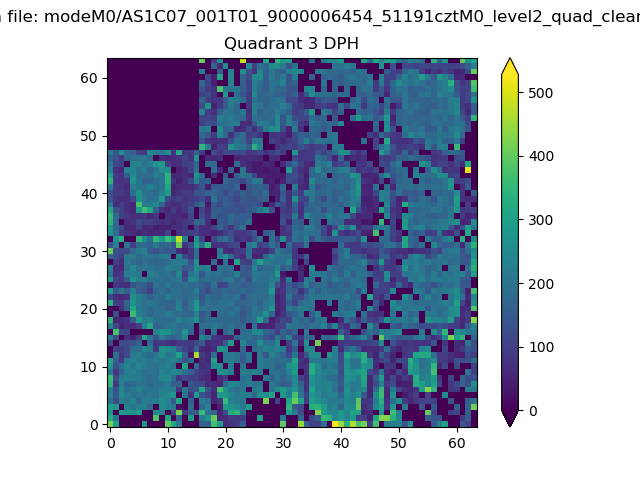 |
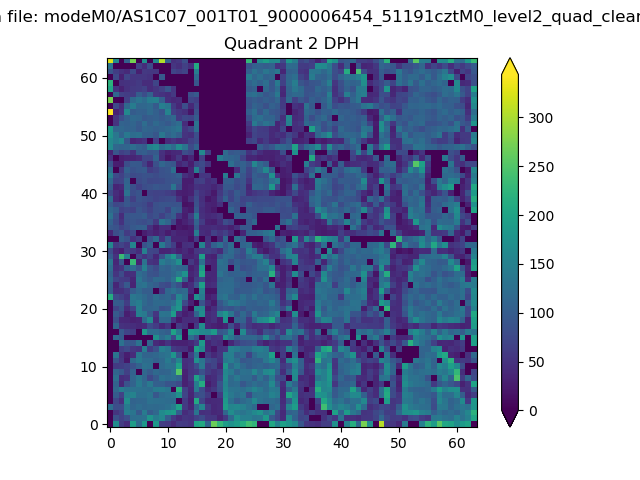 |
Quadrant C |
| Plot type | Count rate plots | Images |
|---|---|---|
| Comparison with Poisson distribution Blue bars denote a histogram of data divided into 1 sec bins. Red curve is a Poisson curve with rate = median count rate of data. |
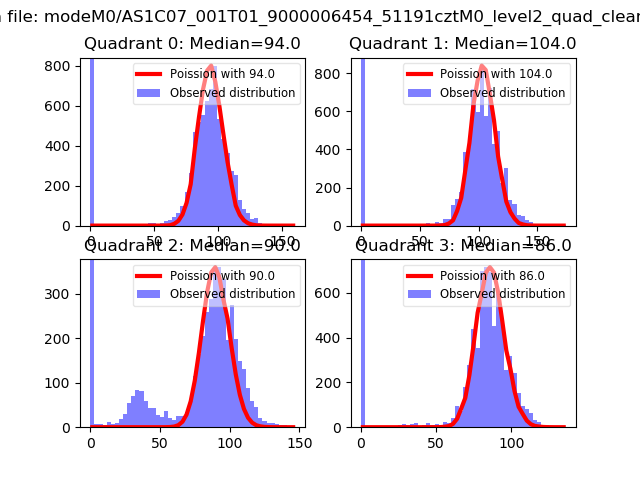 |
 |
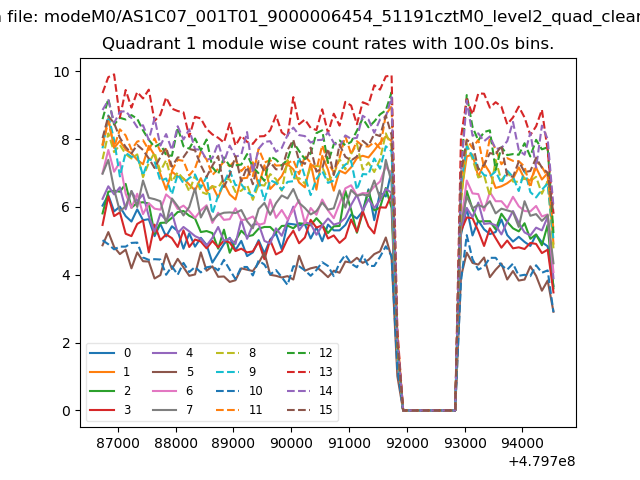
| Quadrant-wise count rates Data is divided into 100 sec bins |
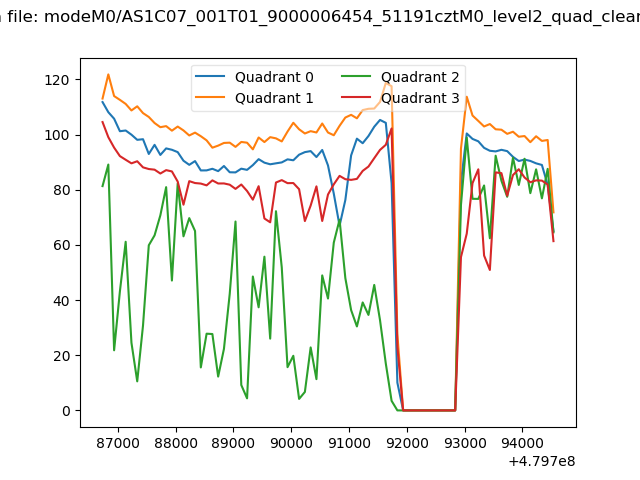 |
|
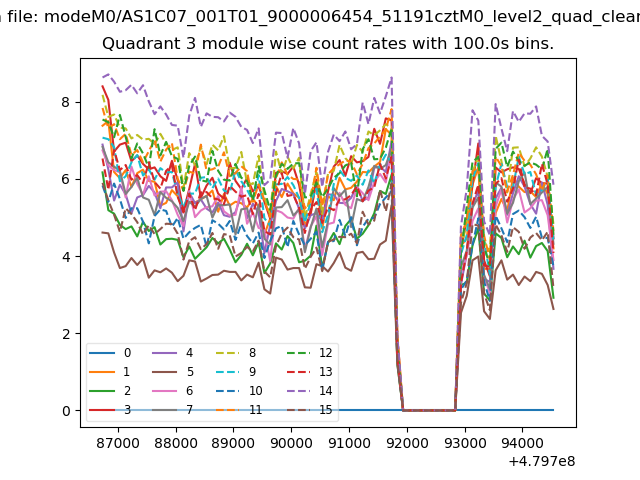
| Module-wise count rates for Quadrant A Data is divided into 100 sec bins |
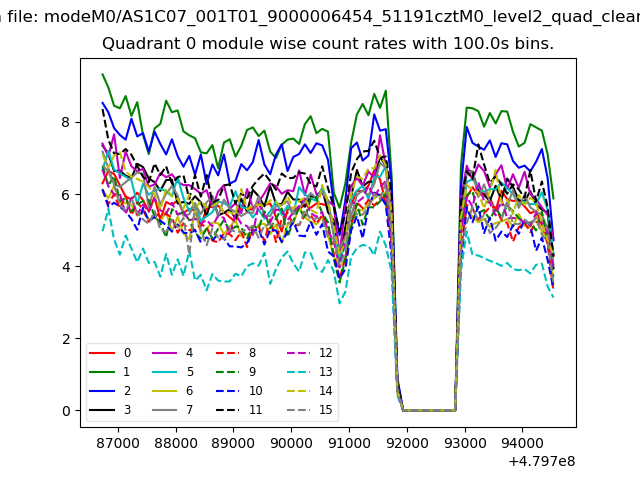 |
 |
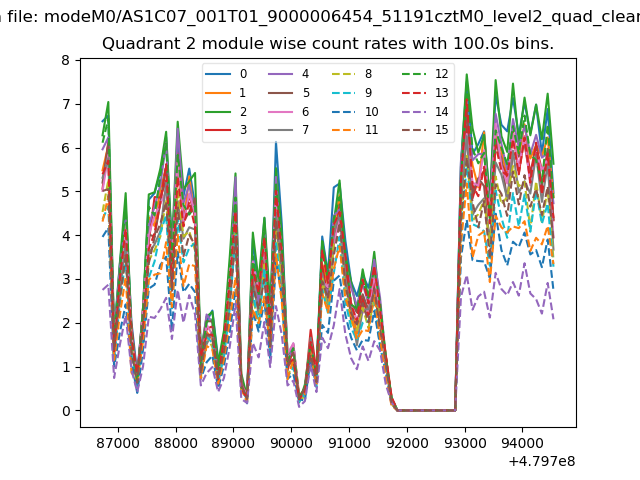
| Module-wise count rates for Quadrant B Data is divided into 100 sec bins |
 |
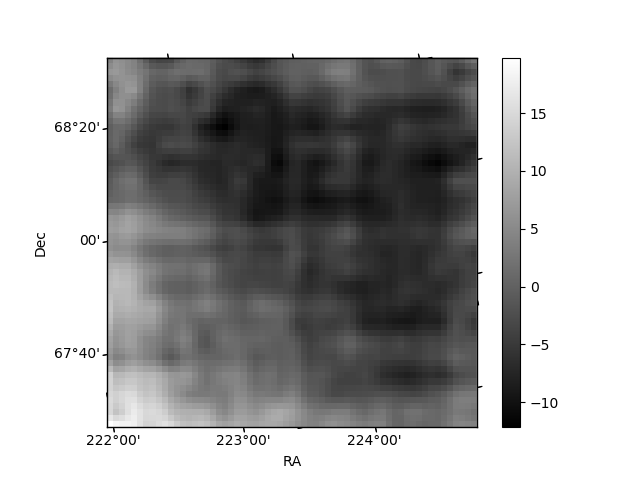 |
| Module-wise count rates for Quadrant C Data is divided into 100 sec bins |
 |
 |
| Module-wise count rates for Quadrant D Data is divided into 100 sec bins |
 |
 |
| Parameter | Plot |
|---|---|
| CZT HV Monitor | 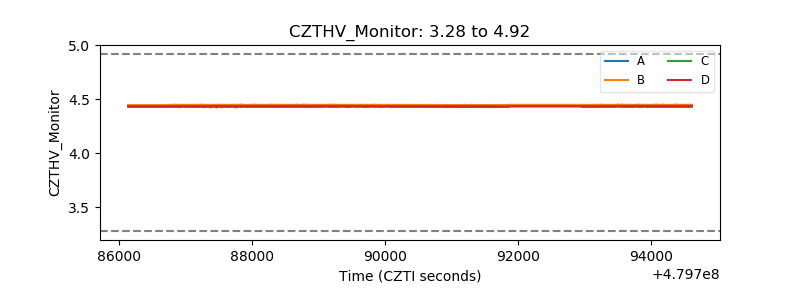 |
| D_VDD | 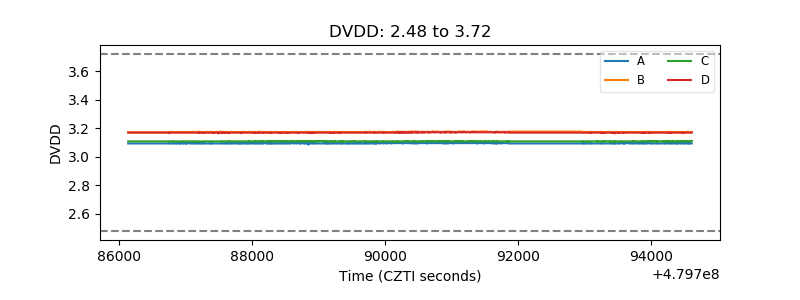 |
| Temperature 1 | 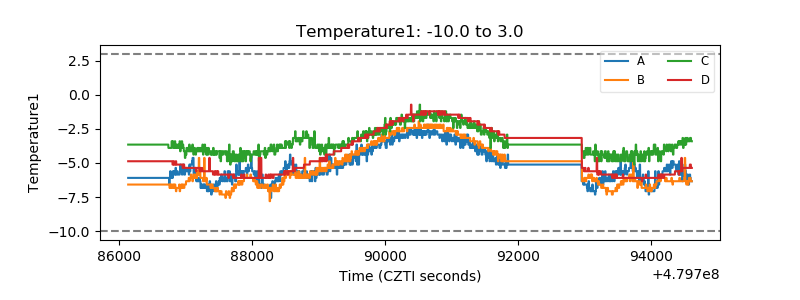 |
| Veto HV Monitor | 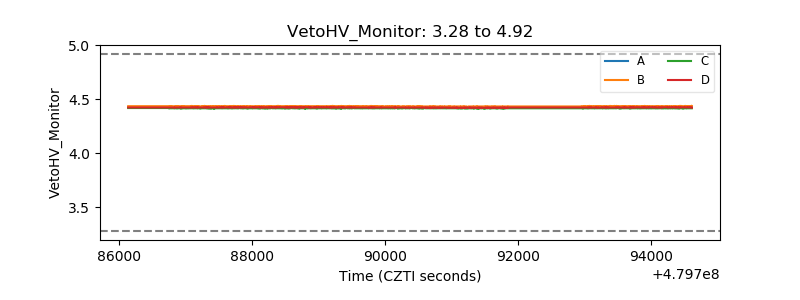 |
| Veto LLD |  |
| Alpha Counter | 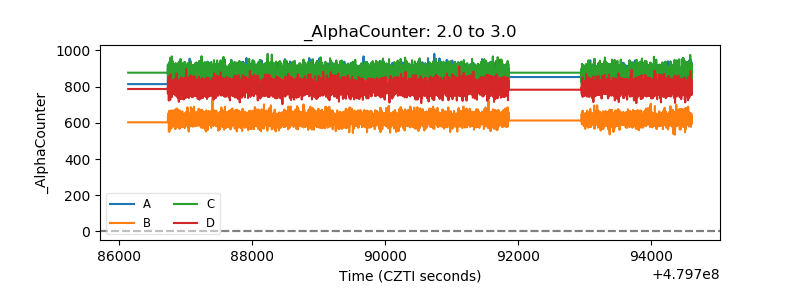 |
| _CPM_Rate | 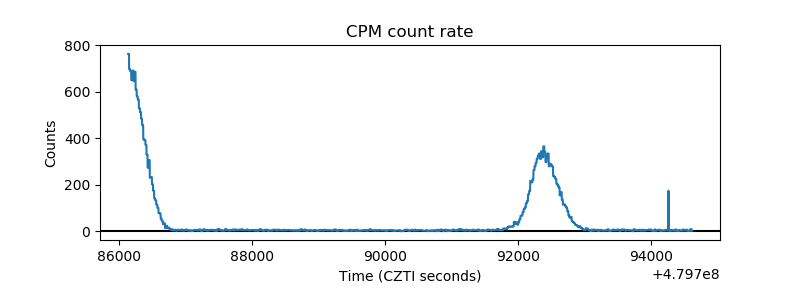 |
| CZT Counter | 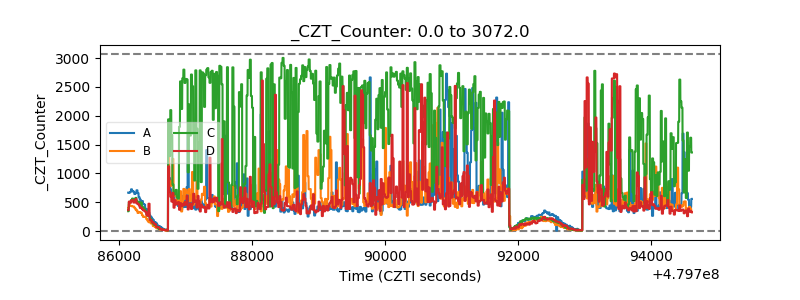 |
| +2.5 Volts monitor | 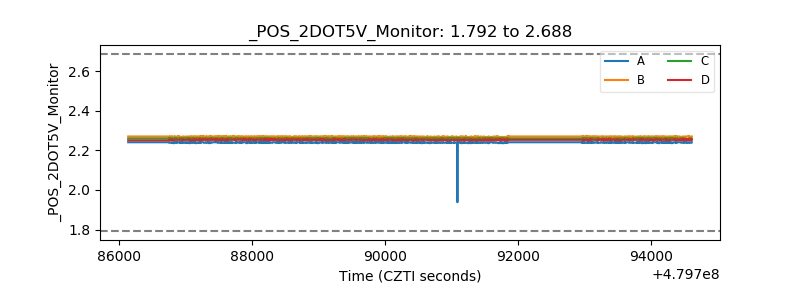 |
| +5 Volts monitor | 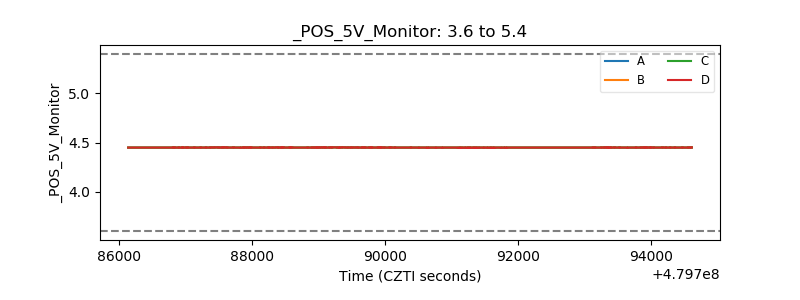 |
| _ROLL_ROT | 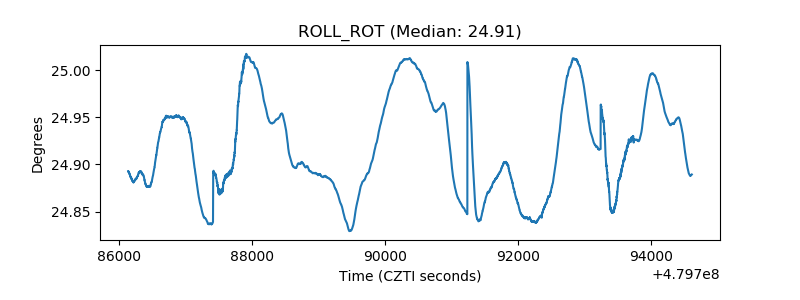 |
| _Roll_DEC | 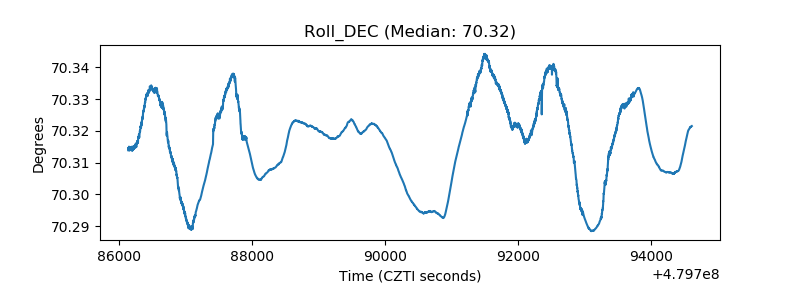 |
| _Roll_RA | 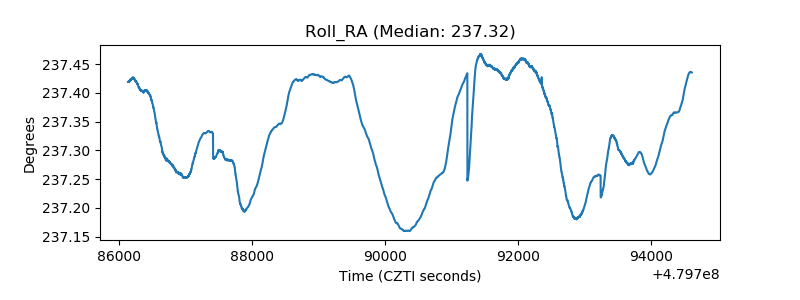 |
| Veto Counter | 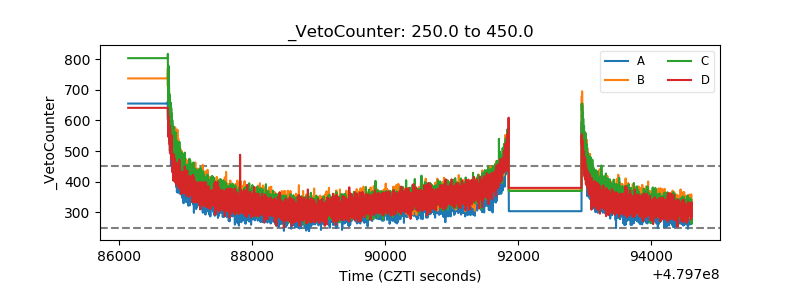 |