| Param | Original file | Final file |
|---|---|---|
| Filename | modeM0/AS1C07_001T01_9000006454_51192cztM0_level2.fits | modeM0/AS1C07_001T01_9000006454_51192cztM0_level2_quad_clean.evt |
| Size (bytes) | 56,882,880 | 9,607,680 |
| Size | 54.2 MB | 9.2 MB |
| Events in quadrant A | 484,903 | 63,756 |
| Events in quadrant B | 456,565 | 71,017 |
| Events in quadrant C | 673,705 | 26,855 |
| Events in quadrant D | 421,098 | 62,072 |
| Mode M0 | |||
|---|---|---|---|
| Quadrant | BADHDUFLAG | Total packets | Discarded packets |
| A | 0 | 7612 | 5529 |
| B | 0 | 7040 | 4966 |
| C | 0 | 16814 | 14442 |
| D | 0 | 7958 | 5908 |
| Mode SS | |||
|---|---|---|---|
| Quadrant | BADHDUFLAG | Total packets | Discarded packets |
| A | 0 | 63 | 45 |
| B | 0 | 60 | 39 |
| C | 0 | 64 | 44 |
| D | 0 | 63 | 30 |
| Mode M9 | |||
|---|---|---|---|
| Quadrant | BADHDUFLAG | Total packets | Discarded packets |
| A | 0 | 1 | 1 |
| B | 1 | 1 | 1 |
| C | 1 | -1 | -1 |
| D | 1 | -1 | -1 |
| Quadrant | Total seconds | Saturated seconds | Saturation percentage |
|---|---|---|---|
| A | 904 | 3 | 0.331858% |
| B | 967 | 1 | 0.103413% |
| C | 522 | 52 | 9.961686% |
| D | 968 | 3 | 0.309917% |
Noise dominated data is calculated using 1-second bins in cleaned event files. If a bin has >2000 counts, and if more than 50% of those come from <1% of pixels, then it is considered to be noise-dominated and hence unusable.
| Quadrant | # 1 sec bins | Bins with >0 counts | Bins with >2000 counts | High rate bins dominated by noise | Noise dominated (total time) | Noise dominated (detector-on time) | Marked lightcurve |
|---|---|---|---|---|---|---|---|
| A | 1048573 | 1264 | 4 | 4 | 0.00% | 0.32% | 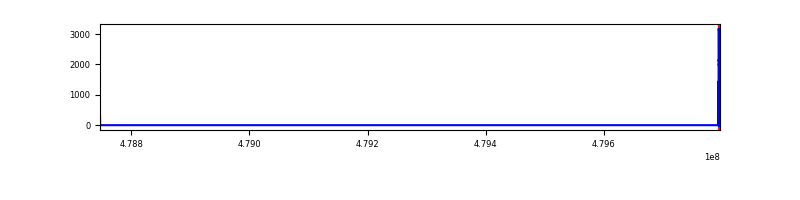 |
| B | 3073 | 1400 | 0 | 0 | 0.00% | 0.00% | 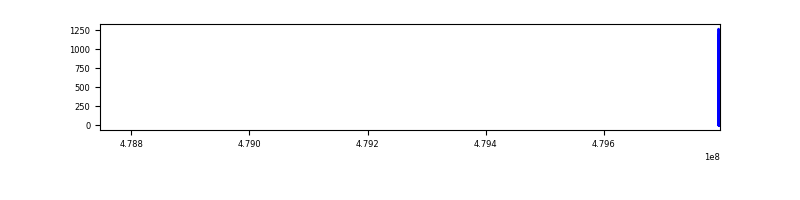 |
| C | 3130 | 806 | 32 | 32 | 1.02% | 3.97% | 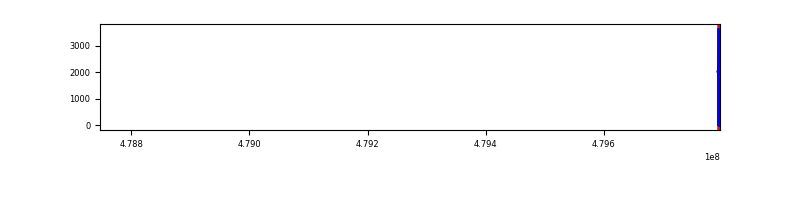 |
| D | 2962 | 1376 | 0 | 0 | 0.00% | 0.00% | 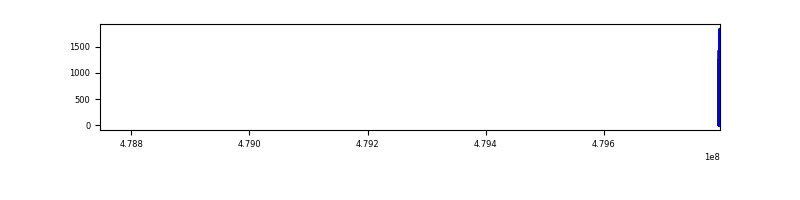 |
Top three noisy pixels from each quadrant. If the there are fewer than three noisy pixels in the level2.evt file, extra rows are filled as -1
| Pixel properties | Quadrant properties | ||||||
|---|---|---|---|---|---|---|---|
| Quadrant | DetID | PixID | Counts | Sigma | Mean | Median | Sigma |
| A | 3 | 62 | 71707 | 3168.0 | 84 | 82 | 22.6 |
| A | 14 | 254 | 29360 | 1294.98 | 84 | 82 | 22.6 |
| A | 9 | 160 | 19982 | 880.18 | 84 | 82 | 22.6 |
| B | 10 | 254 | 28076 | 1332.1 | 90 | 88 | 21.0 |
| B | 10 | 60 | 23014 | 1091.17 | 90 | 88 | 21.0 |
| B | 8 | 128 | 12053 | 569.48 | 90 | 88 | 21.0 |
| C | 4 | 12 | 225968 | 15728.85 | 45 | 44 | 14.4 |
| C | 12 | 247 | 116746 | 8124.8 | 45 | 44 | 14.4 |
| C | 15 | 229 | 67375 | 4687.59 | 45 | 44 | 14.4 |
| D | 15 | 94 | 29799 | 1175.06 | 85 | 82 | 25.3 |
| D | 11 | 245 | 10490 | 411.55 | 85 | 82 | 25.3 |
| D | 6 | 30 | 6855 | 267.82 | 85 | 82 | 25.3 |
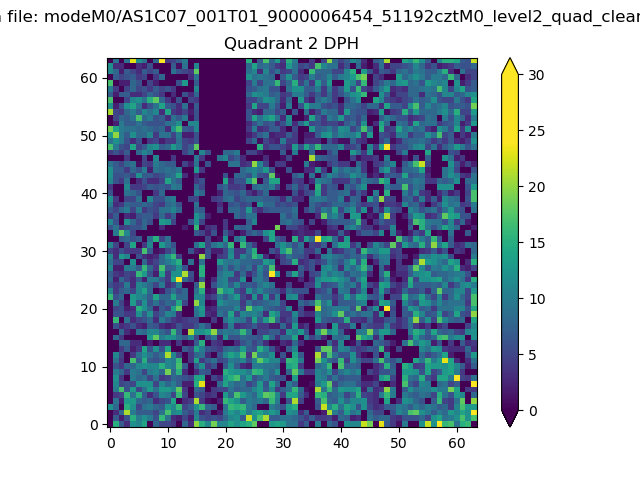
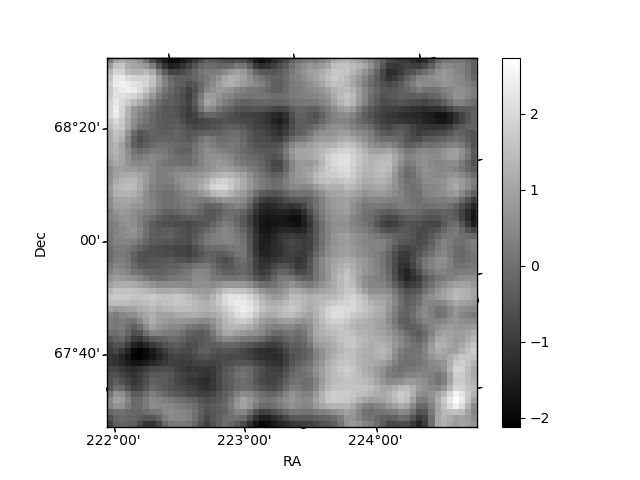
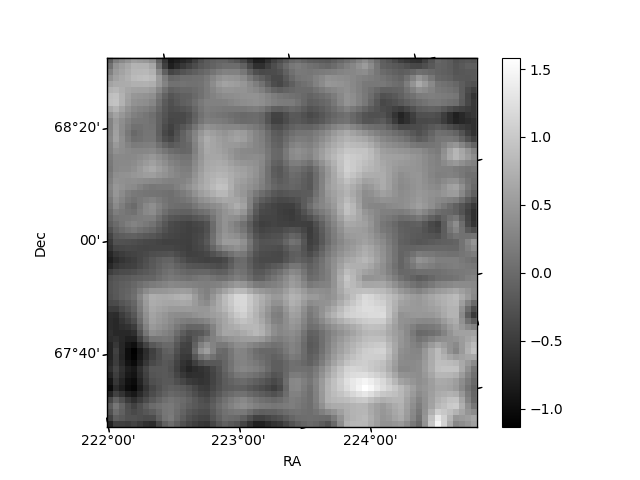
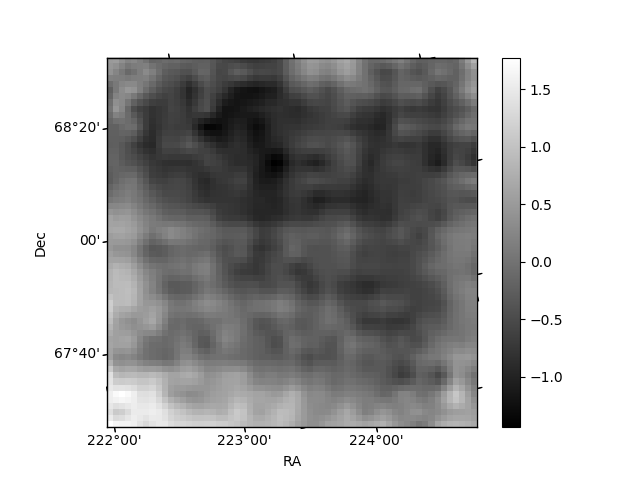
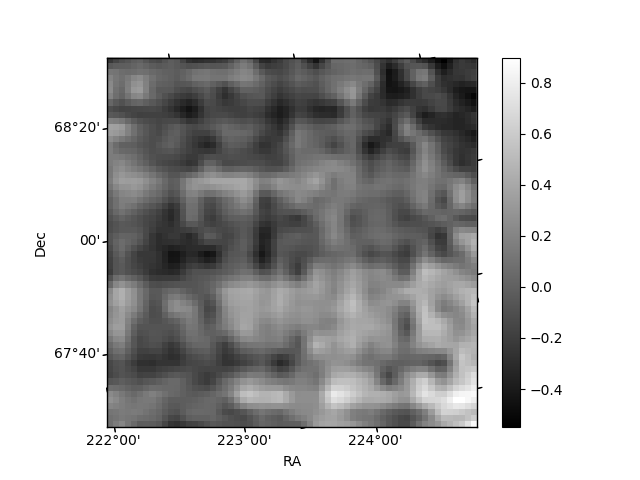
Histogram calculated using DETX and DETY for each event in the final _common_clean file
| Quadrant A | 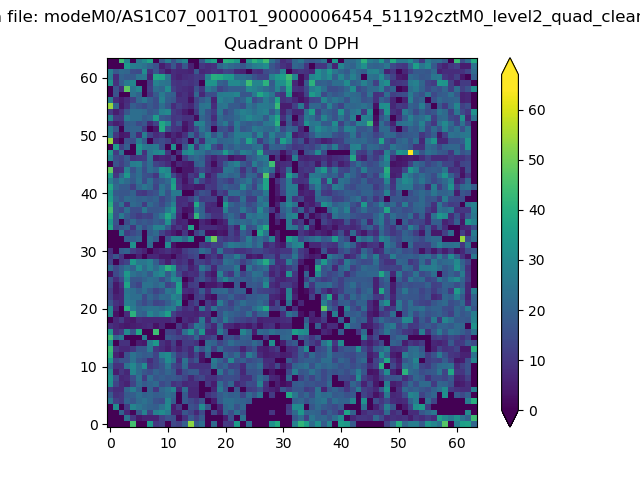 |
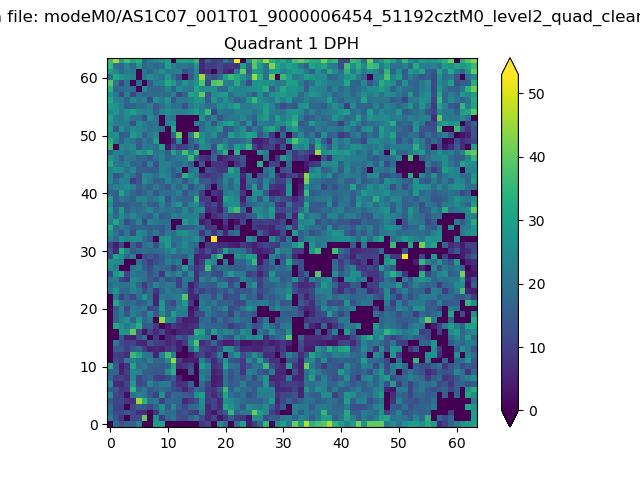 |
Quadrant B |
|---|---|---|---|
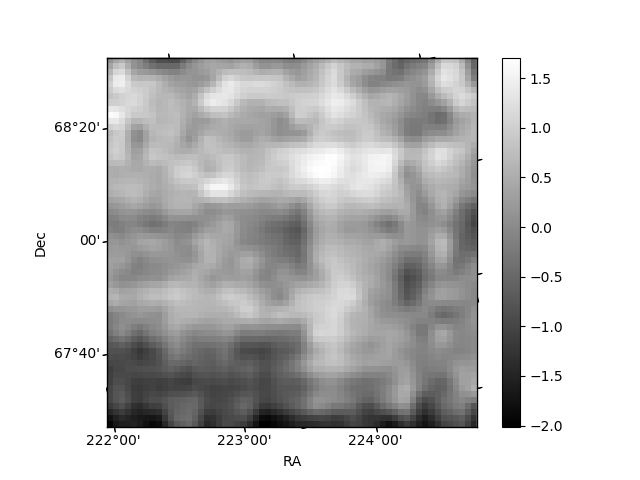
| Quadrant D | 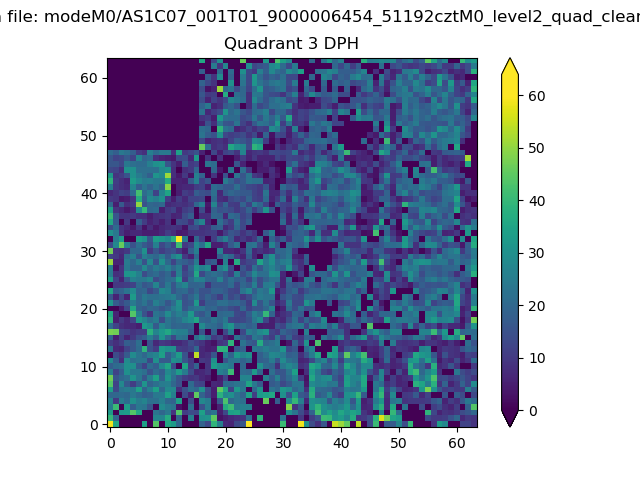 |
 |
Quadrant C |
| Plot type | Count rate plots | Images |
|---|---|---|
| Comparison with Poisson distribution Blue bars denote a histogram of data divided into 1 sec bins. Red curve is a Poisson curve with rate = median count rate of data. |
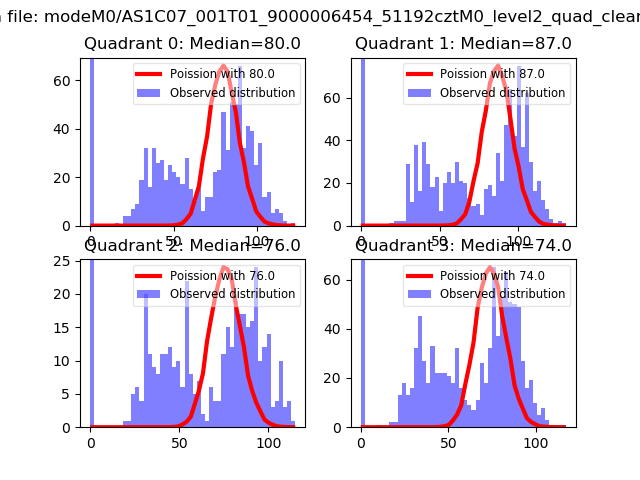 |
 |
| Quadrant-wise count rates Data is divided into 100 sec bins |
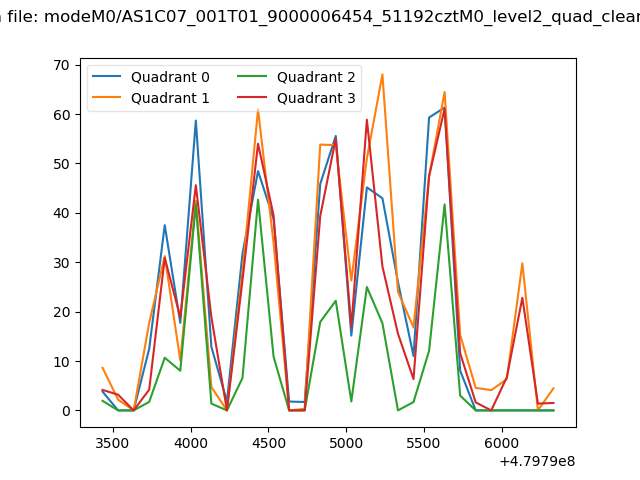 |
|
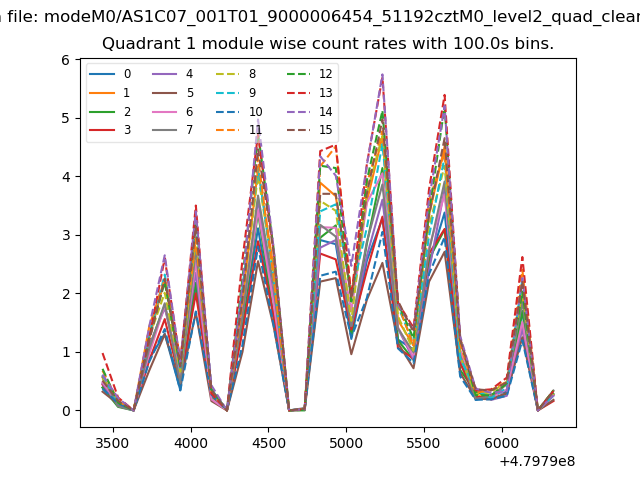
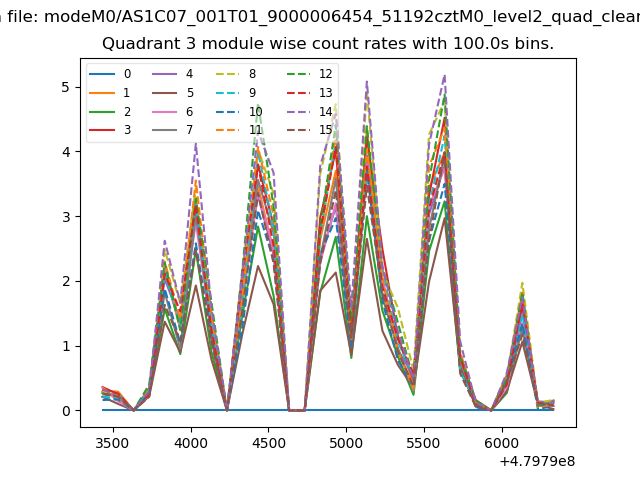
| Module-wise count rates for Quadrant A Data is divided into 100 sec bins |
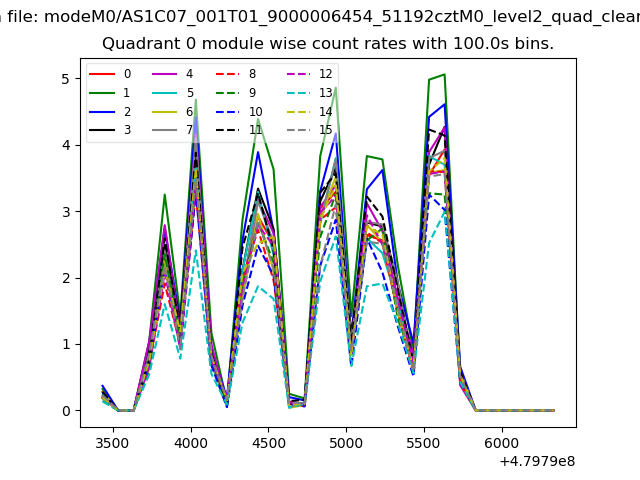 |
 |
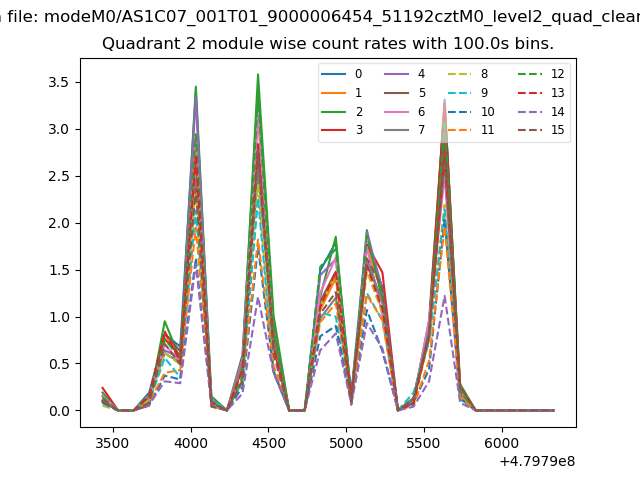
| Module-wise count rates for Quadrant B Data is divided into 100 sec bins |
 |
 |
| Module-wise count rates for Quadrant C Data is divided into 100 sec bins |
 |
 |
| Module-wise count rates for Quadrant D Data is divided into 100 sec bins |
 |
 |
| Parameter | Plot |
|---|---|
| CZT HV Monitor | 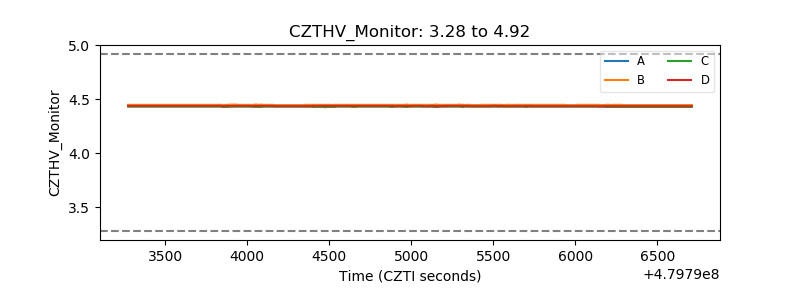 |
| D_VDD | 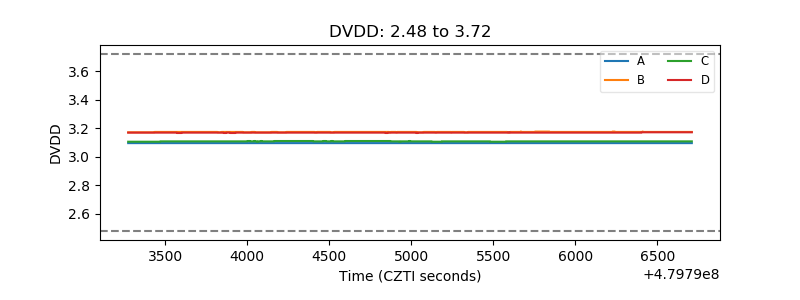 |
| Temperature 1 | 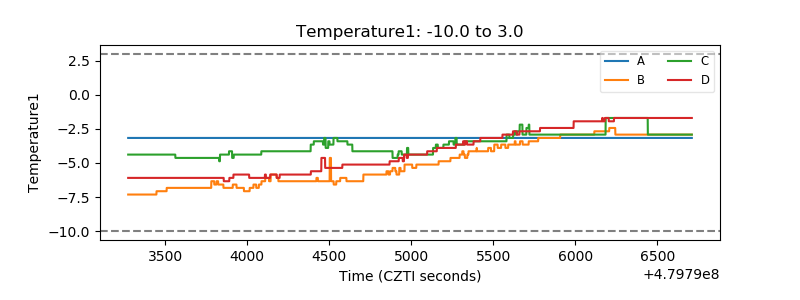 |
| Veto HV Monitor | 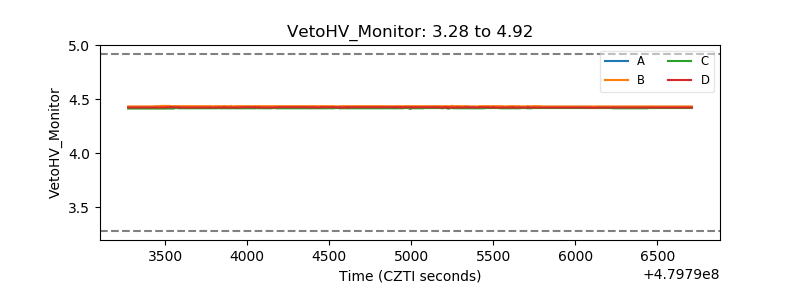 |
| Veto LLD | 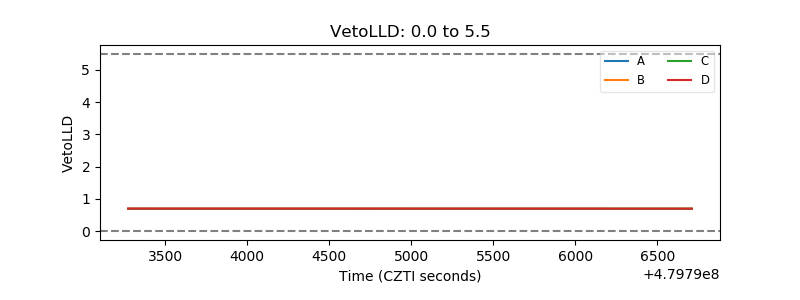 |
| Alpha Counter | 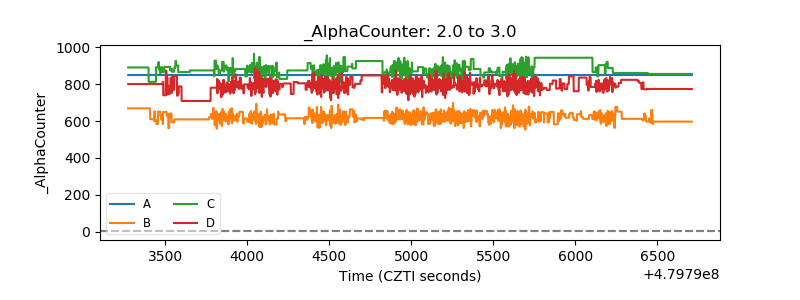 |
| _CPM_Rate | 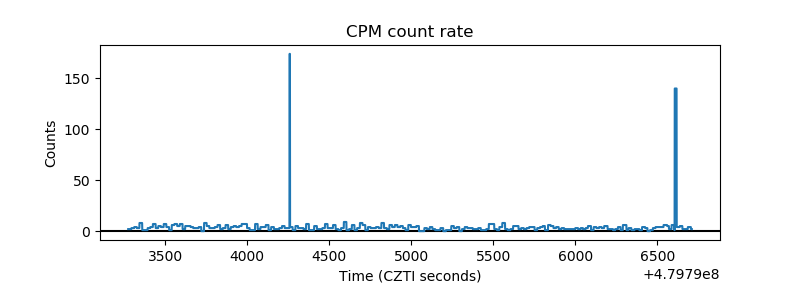 |
| CZT Counter | 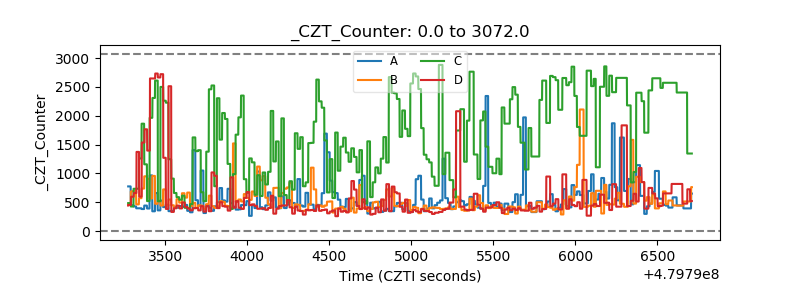 |
| +2.5 Volts monitor | 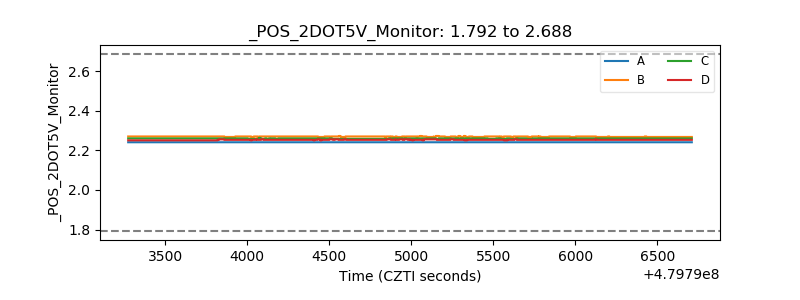 |
| +5 Volts monitor | 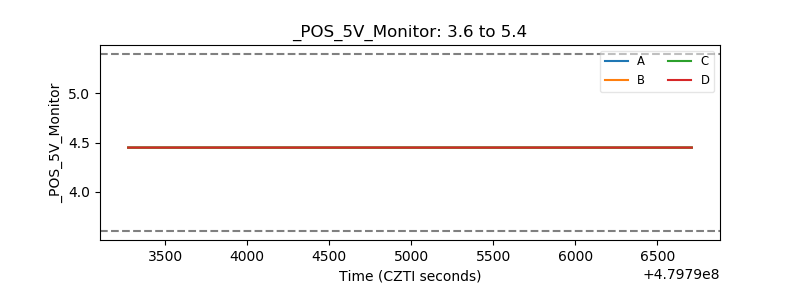 |
| _ROLL_ROT | 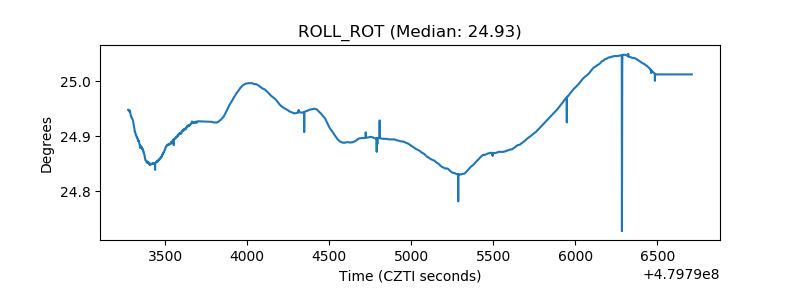 |
| _Roll_DEC | 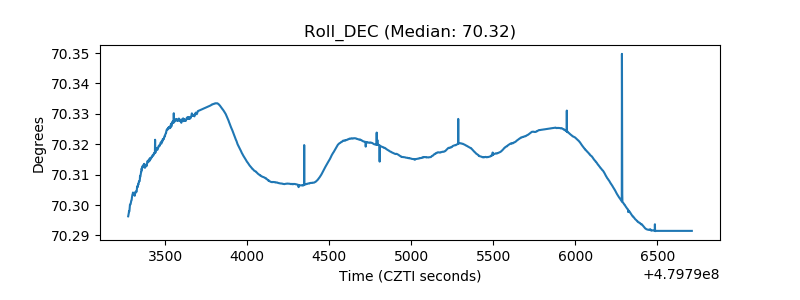 |
| _Roll_RA | 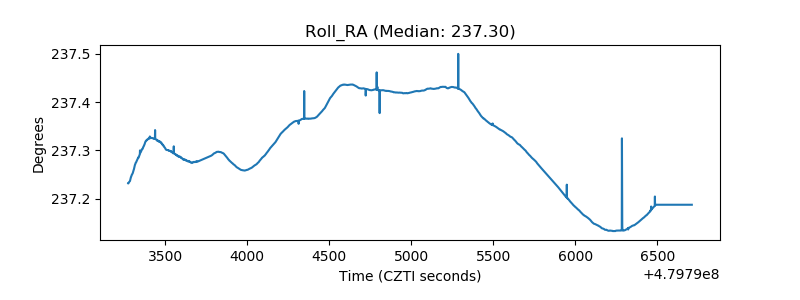 |
| Veto Counter | 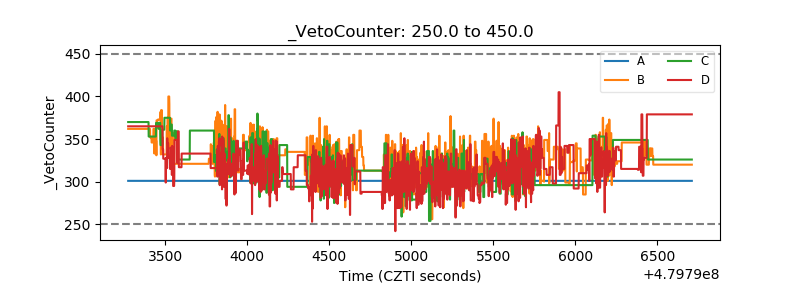 |