| Param | Original file | Final file |
|---|---|---|
| Filename | modeM0/AS1C07_001T01_9000006454_51193cztM0_level2.fits | modeM0/AS1C07_001T01_9000006454_51193cztM0_level2_quad_clean.evt |
| Size (bytes) | 764,674,560 | 82,163,520 |
| Size | 729.3 MB | 78.4 MB |
| Events in quadrant A | 4,656,745 | 588,534 |
| Events in quadrant B | 5,982,517 | 618,896 |
| Events in quadrant C | 12,931,166 | 291,590 |
| Events in quadrant D | 4,229,886 | 533,019 |
| Mode M0 | |||
|---|---|---|---|
| Quadrant | BADHDUFLAG | Total packets | Discarded packets |
| A | 0 | 18339 | 1 |
| B | 0 | 22336 | 1 |
| C | 0 | 42851 | 1 |
| D | 0 | 17276 | 1 |
| Mode SS | |||
|---|---|---|---|
| Quadrant | BADHDUFLAG | Total packets | Discarded packets |
| A | 0 | 132 | 0 |
| B | 0 | 132 | 0 |
| C | 0 | 132 | 0 |
| D | 0 | 132 | 0 |
| Mode M9 | |||
|---|---|---|---|
| Quadrant | BADHDUFLAG | Total packets | Discarded packets |
| A | 0 | 5 | 0 |
| B | 0 | 5 | 0 |
| C | 0 | 5 | 0 |
| D | 0 | 5 | 0 |
| Quadrant | Total seconds | Saturated seconds | Saturation percentage |
|---|---|---|---|
| A | 6531 | 180 | 2.756086% |
| B | 6532 | 503 | 7.700551% |
| C | 6532 | 3681 | 56.353337% |
| D | 6532 | 212 | 3.245560% |
Noise dominated data is calculated using 1-second bins in cleaned event files. If a bin has >2000 counts, and if more than 50% of those come from <1% of pixels, then it is considered to be noise-dominated and hence unusable.
| Quadrant | # 1 sec bins | Bins with >0 counts | Bins with >2000 counts | High rate bins dominated by noise | Noise dominated (total time) | Noise dominated (detector-on time) | Marked lightcurve |
|---|---|---|---|---|---|---|---|
| A | 7031 | 6533 | 93 | 93 | 1.32% | 1.42% | 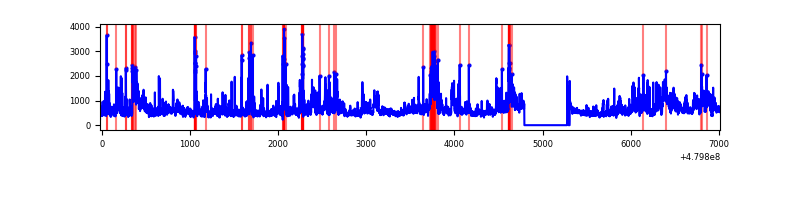 |
| B | 7032 | 6534 | 239 | 239 | 3.40% | 3.66% | 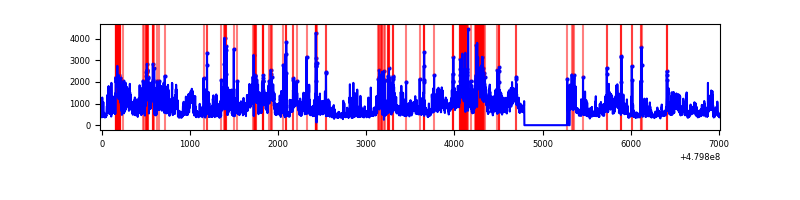 |
| C | 7032 | 6534 | 3342 | 3342 | 47.53% | 51.15% | 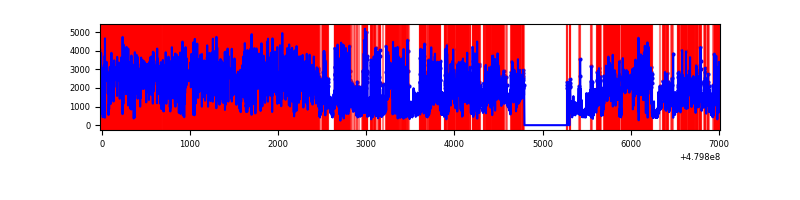 |
| D | 7032 | 6534 | 189 | 189 | 2.69% | 2.89% | 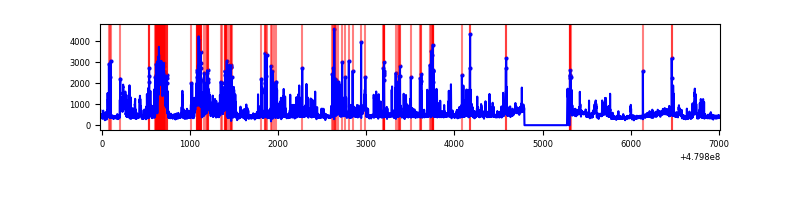 |
Top three noisy pixels from each quadrant. If the there are fewer than three noisy pixels in the level2.evt file, extra rows are filled as -1
| Pixel properties | Quadrant properties | ||||||
|---|---|---|---|---|---|---|---|
| Quadrant | DetID | PixID | Counts | Sigma | Mean | Median | Sigma |
| A | 12 | 3 | 773195 | 4679.81 | 668 | 652 | 165.1 |
| A | 9 | 160 | 329328 | 1991.01 | 668 | 652 | 165.1 |
| A | 14 | 254 | 279510 | 1689.23 | 668 | 652 | 165.1 |
| B | 10 | 254 | 1813654 | 12805.56 | 657 | 634 | 141.6 |
| B | 4 | 21 | 230218 | 1621.58 | 657 | 634 | 141.6 |
| B | 5 | 172 | 198302 | 1396.15 | 657 | 634 | 141.6 |
| C | 4 | 12 | 7353115 | 54614.5 | 487 | 482 | 134.6 |
| C | 12 | 247 | 2583746 | 19188.18 | 487 | 482 | 134.6 |
| C | 15 | 229 | 390201 | 2894.79 | 487 | 482 | 134.6 |
| D | 15 | 174 | 380018 | 2125.61 | 639 | 617 | 178.5 |
| D | 10 | 181 | 238512 | 1332.82 | 639 | 617 | 178.5 |
| D | 3 | 12 | 228334 | 1275.79 | 639 | 617 | 178.5 |
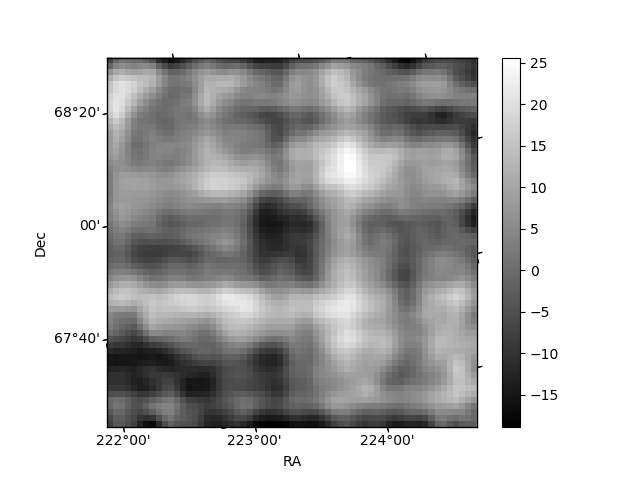
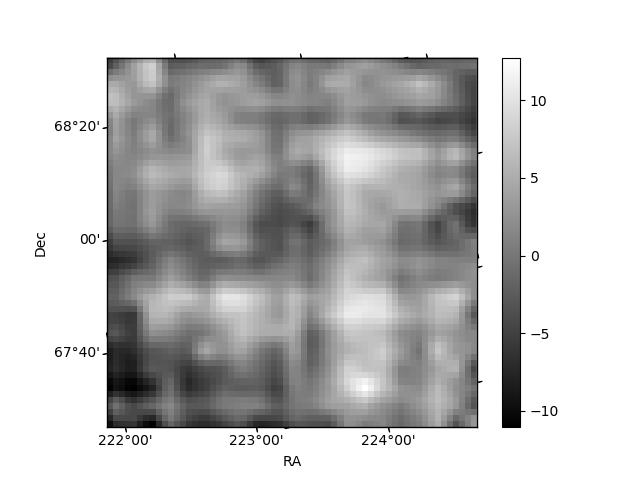
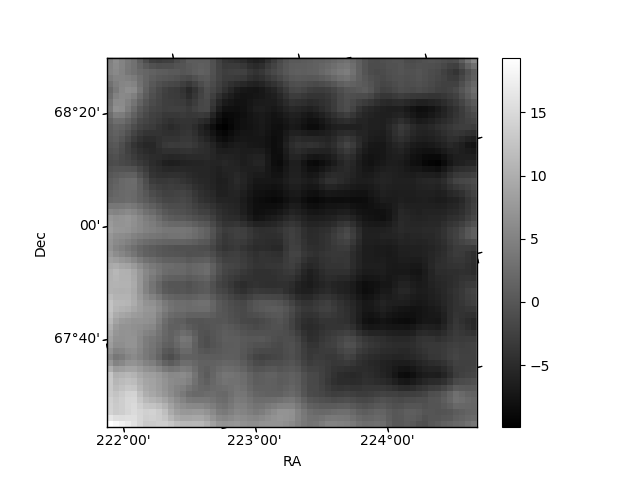
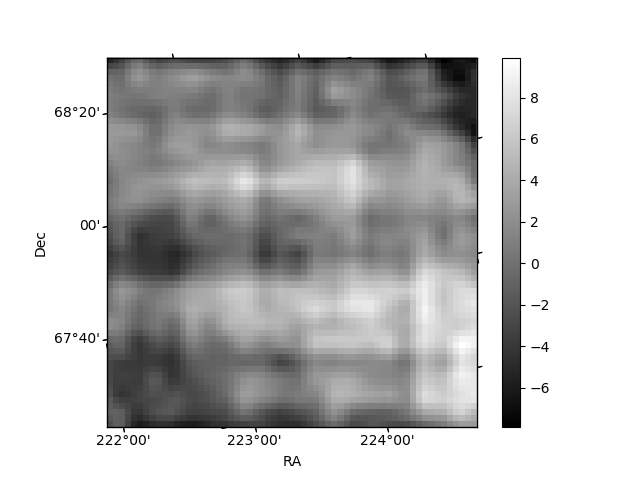
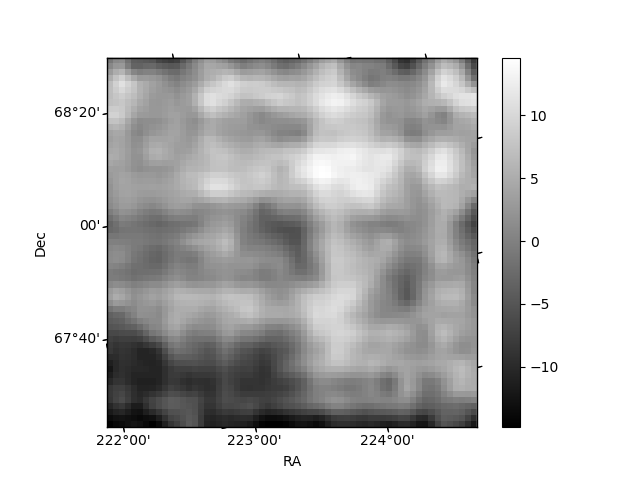
Histogram calculated using DETX and DETY for each event in the final _common_clean file
| Quadrant A | 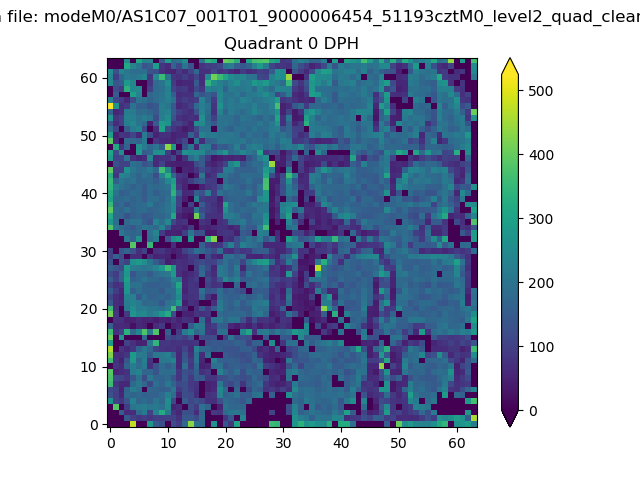 |
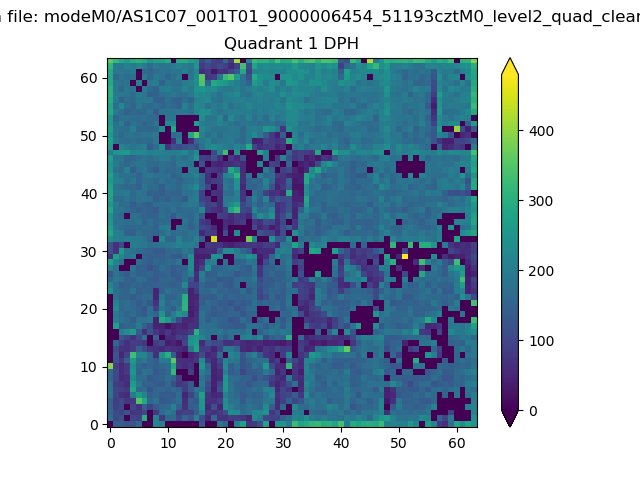 |
Quadrant B |
|---|---|---|---|
| Quadrant D | 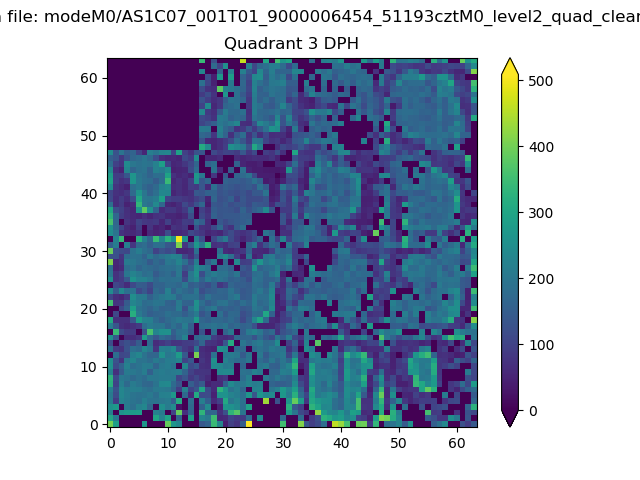 |
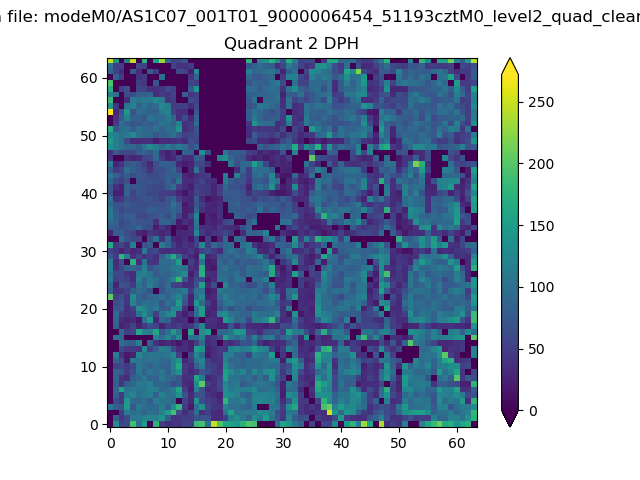 |
Quadrant C |
| Plot type | Count rate plots | Images |
|---|---|---|
| Comparison with Poisson distribution Blue bars denote a histogram of data divided into 1 sec bins. Red curve is a Poisson curve with rate = median count rate of data. |
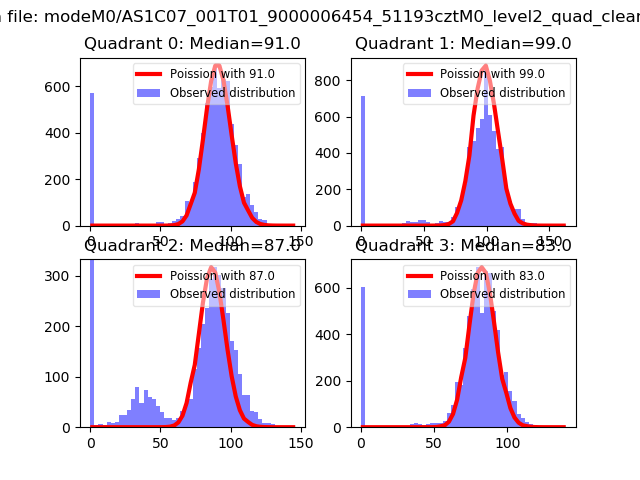 |
 |
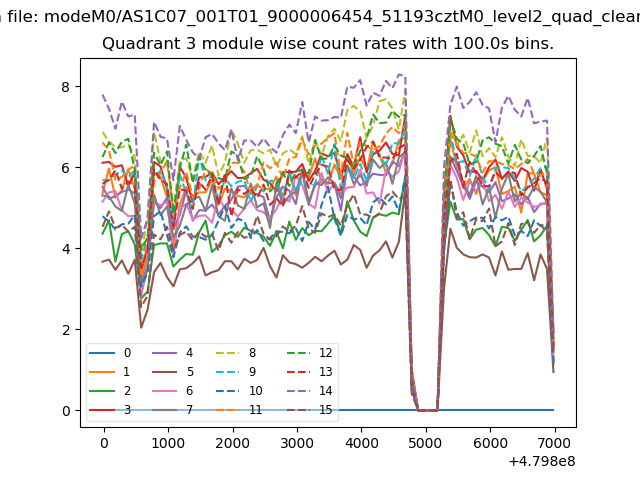
| Quadrant-wise count rates Data is divided into 100 sec bins |
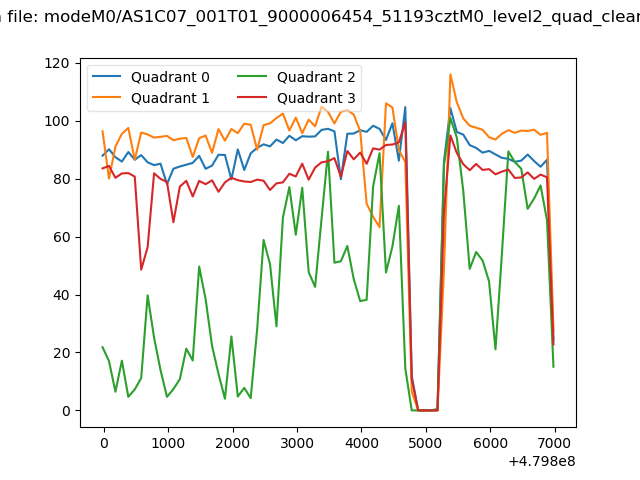 |
|
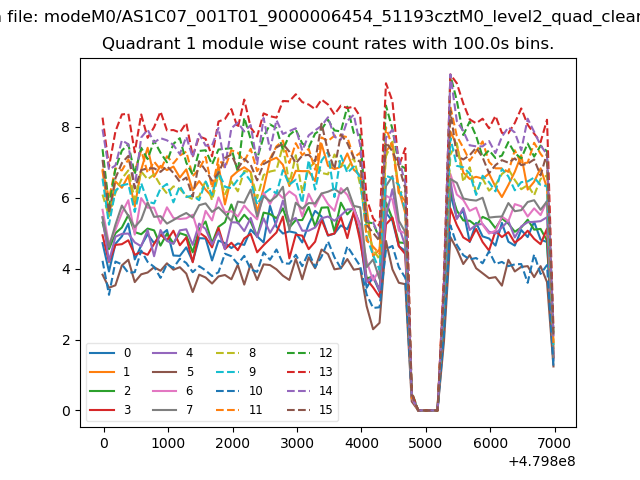
| Module-wise count rates for Quadrant A Data is divided into 100 sec bins |
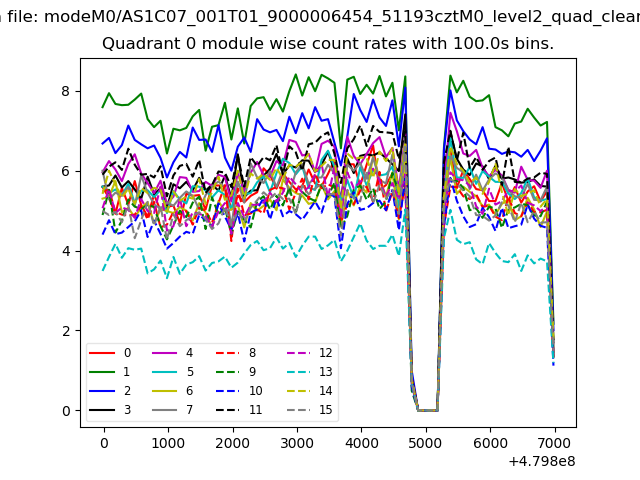 |
 |
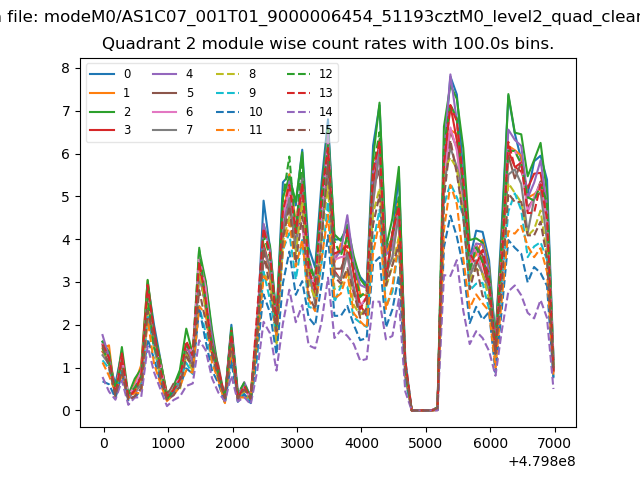
| Module-wise count rates for Quadrant B Data is divided into 100 sec bins |
 |
 |
| Module-wise count rates for Quadrant C Data is divided into 100 sec bins |
 |
 |
| Module-wise count rates for Quadrant D Data is divided into 100 sec bins |
 |
 |
| Parameter | Plot |
|---|---|
| CZT HV Monitor | 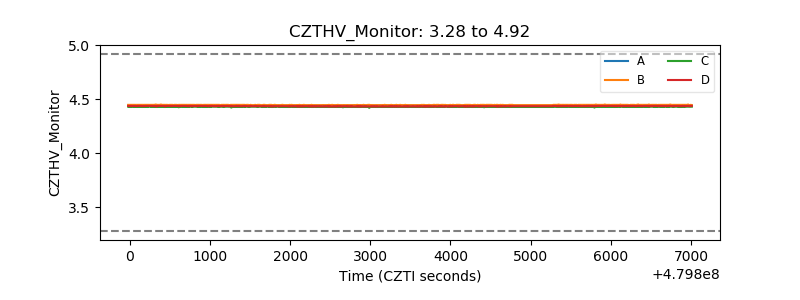 |
| D_VDD | 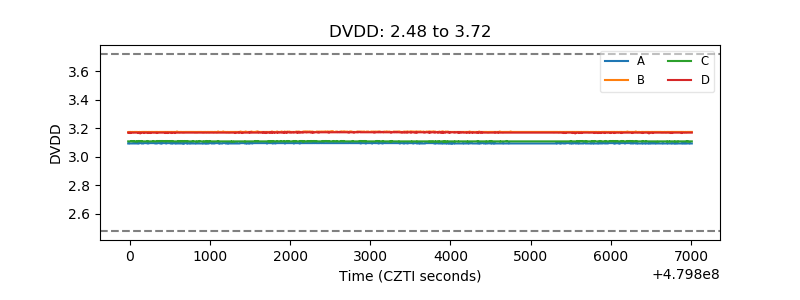 |
| Temperature 1 | 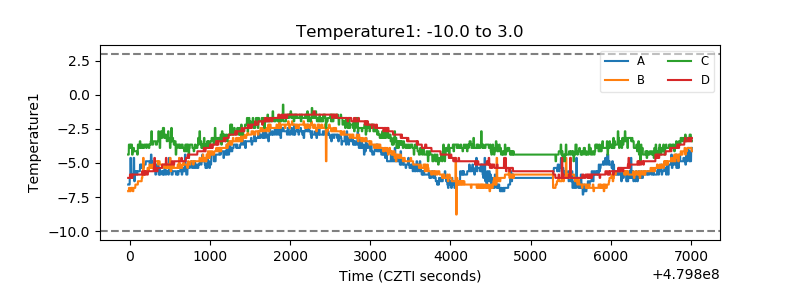 |
| Veto HV Monitor | 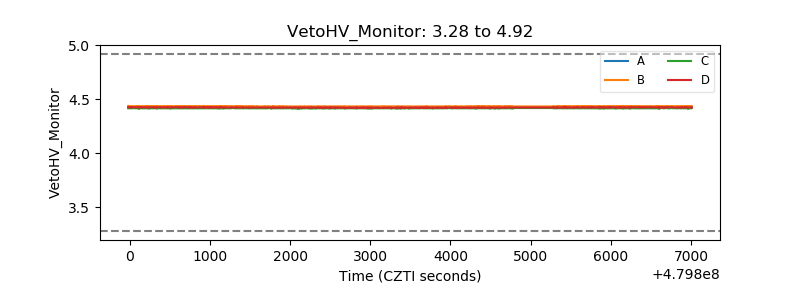 |
| Veto LLD | 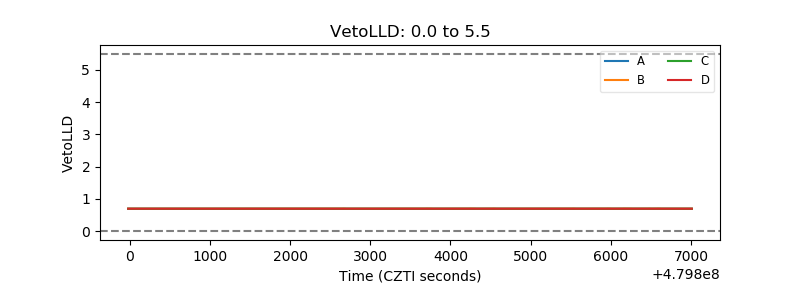 |
| Alpha Counter | 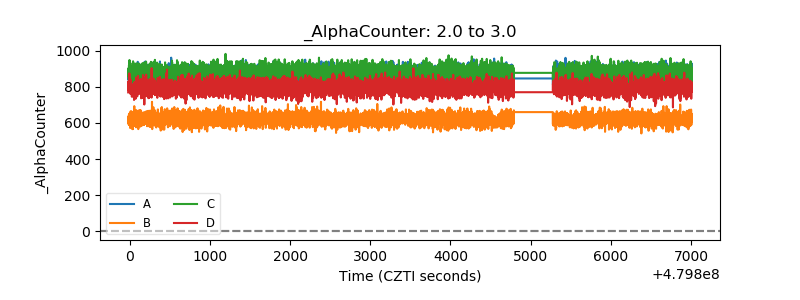 |
| _CPM_Rate | 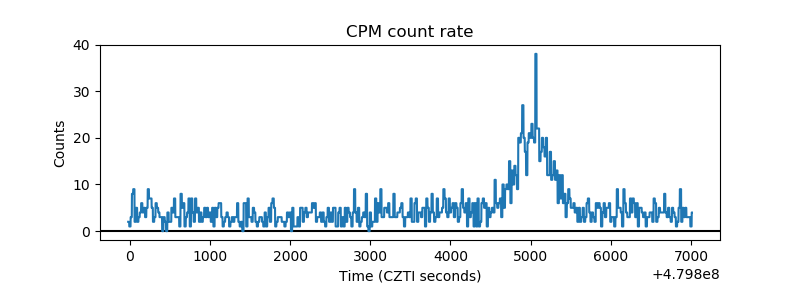 |
| CZT Counter | 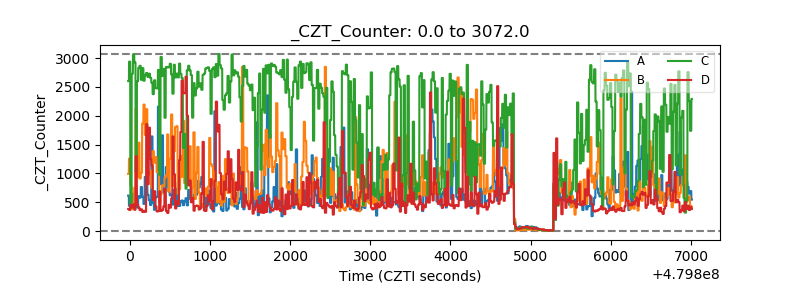 |
| +2.5 Volts monitor | 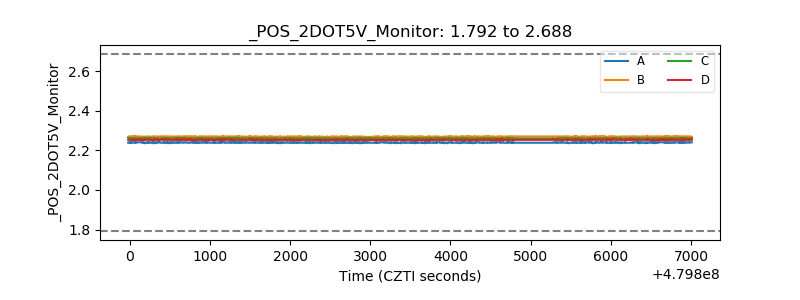 |
| +5 Volts monitor | 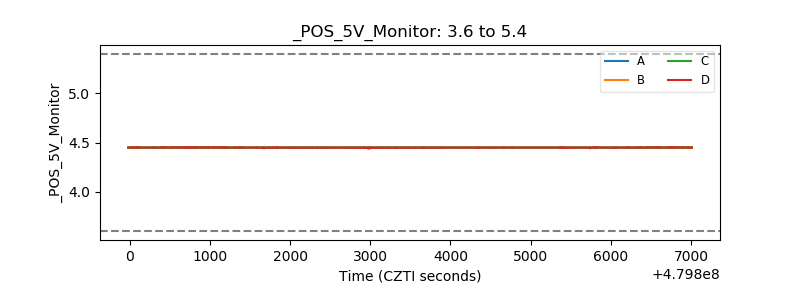 |
| _ROLL_ROT | 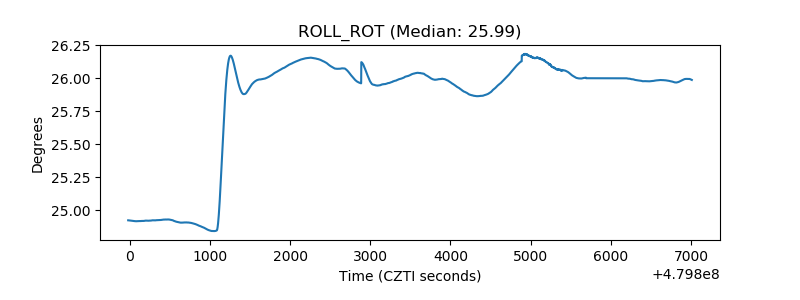 |
| _Roll_DEC | 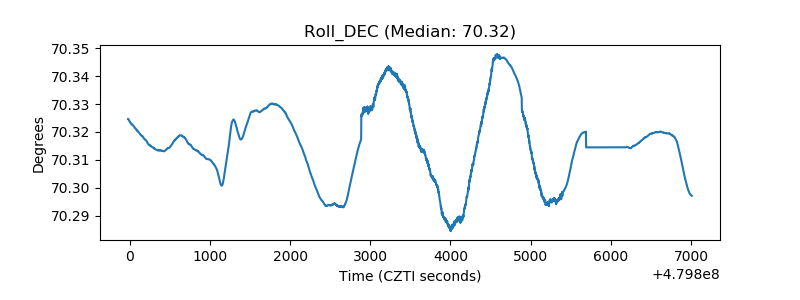 |
| _Roll_RA | 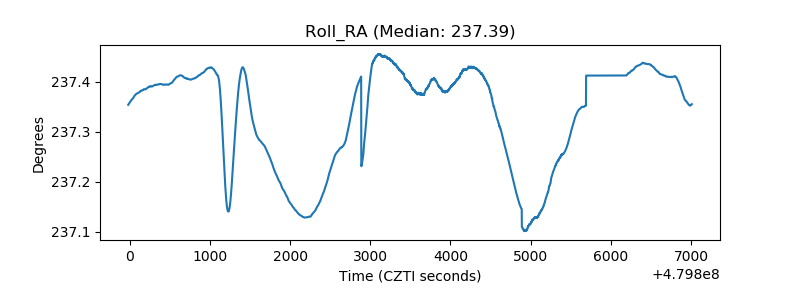 |
| Veto Counter | 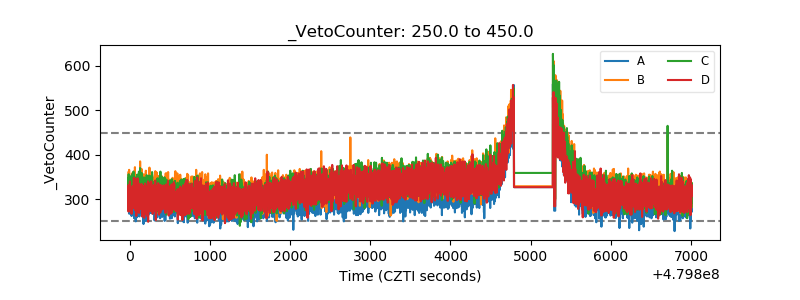 |