| Param | Original file | Final file |
|---|---|---|
| Filename | modeM0/AS1C07_001T01_9000006454_51194cztM0_level2.fits | modeM0/AS1C07_001T01_9000006454_51194cztM0_level2_quad_clean.evt |
| Size (bytes) | 691,128,000 | 94,222,080 |
| Size | 659.1 MB | 89.9 MB |
| Events in quadrant A | 4,882,220 | 629,877 |
| Events in quadrant B | 5,568,395 | 680,169 |
| Events in quadrant C | 10,672,367 | 476,980 |
| Events in quadrant D | 3,920,405 | 579,231 |
| Mode M0 | |||
|---|---|---|---|
| Quadrant | BADHDUFLAG | Total packets | Discarded packets |
| A | 0 | 19282 | 0 |
| B | 0 | 21365 | 0 |
| C | 0 | 36590 | 0 |
| D | 0 | 16684 | 0 |
| Mode SS | |||
|---|---|---|---|
| Quadrant | BADHDUFLAG | Total packets | Discarded packets |
| A | 0 | 140 | 0 |
| B | 0 | 140 | 0 |
| C | 0 | 140 | 0 |
| D | 0 | 140 | 0 |
| Quadrant | Total seconds | Saturated seconds | Saturation percentage |
|---|---|---|---|
| A | 6981 | 132 | 1.890847% |
| B | 6981 | 344 | 4.927661% |
| C | 6981 | 1984 | 28.419997% |
| D | 6981 | 94 | 1.346512% |
Noise dominated data is calculated using 1-second bins in cleaned event files. If a bin has >2000 counts, and if more than 50% of those come from <1% of pixels, then it is considered to be noise-dominated and hence unusable.
| Quadrant | # 1 sec bins | Bins with >0 counts | Bins with >2000 counts | High rate bins dominated by noise | Noise dominated (total time) | Noise dominated (detector-on time) | Marked lightcurve |
|---|---|---|---|---|---|---|---|
| A | 6981 | 6981 | 96 | 96 | 1.38% | 1.38% | 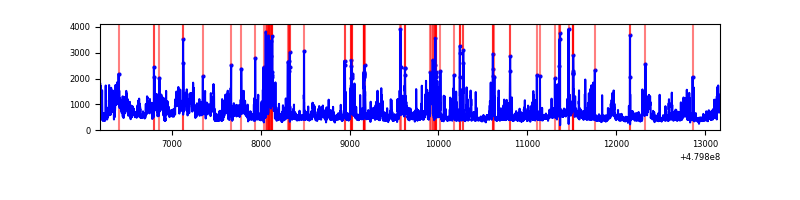 |
| B | 6981 | 6981 | 203 | 203 | 2.91% | 2.91% | 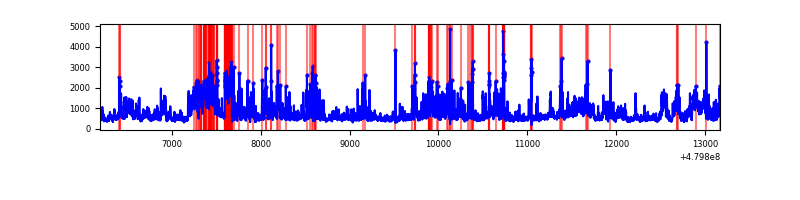 |
| C | 6981 | 6981 | 1925 | 1925 | 27.57% | 27.57% | 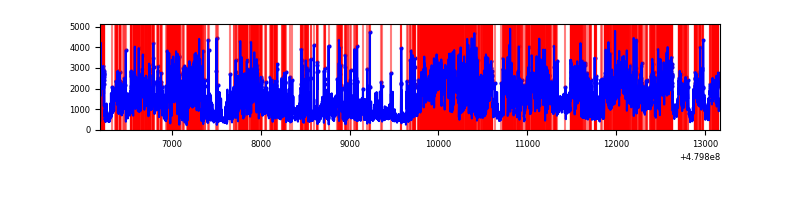 |
| D | 6981 | 6981 | 71 | 71 | 1.02% | 1.02% | 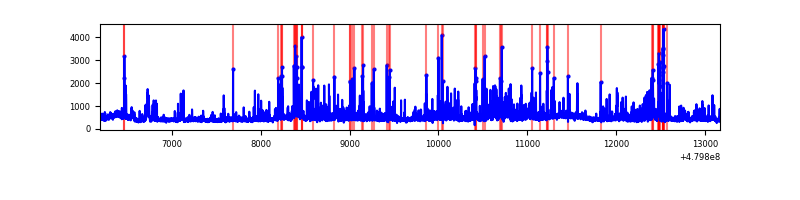 |
Top three noisy pixels from each quadrant. If the there are fewer than three noisy pixels in the level2.evt file, extra rows are filled as -1
| Pixel properties | Quadrant properties | ||||||
|---|---|---|---|---|---|---|---|
| Quadrant | DetID | PixID | Counts | Sigma | Mean | Median | Sigma |
| A | 12 | 3 | 1061726 | 5938.32 | 717 | 701 | 178.7 |
| A | 3 | 62 | 310218 | 1732.3 | 717 | 701 | 178.7 |
| A | 12 | 194 | 126997 | 706.85 | 717 | 701 | 178.7 |
| B | 10 | 254 | 1189021 | 7853.02 | 710 | 684 | 151.3 |
| B | 5 | 172 | 346217 | 2283.42 | 710 | 684 | 151.3 |
| B | 8 | 128 | 272526 | 1796.44 | 710 | 684 | 151.3 |
| C | 4 | 12 | 6619099 | 38221.86 | 632 | 627 | 173.2 |
| C | 12 | 247 | 626477 | 3614.3 | 632 | 627 | 173.2 |
| C | 13 | 3 | 253409 | 1459.82 | 632 | 627 | 173.2 |
| D | 2 | 216 | 257547 | 1333.5 | 690 | 668 | 192.6 |
| D | 10 | 181 | 158068 | 817.09 | 690 | 668 | 192.6 |
| D | 15 | 138 | 138622 | 716.14 | 690 | 668 | 192.6 |
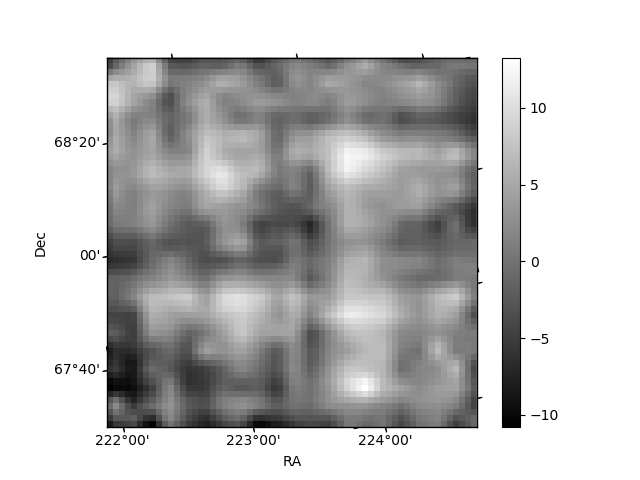
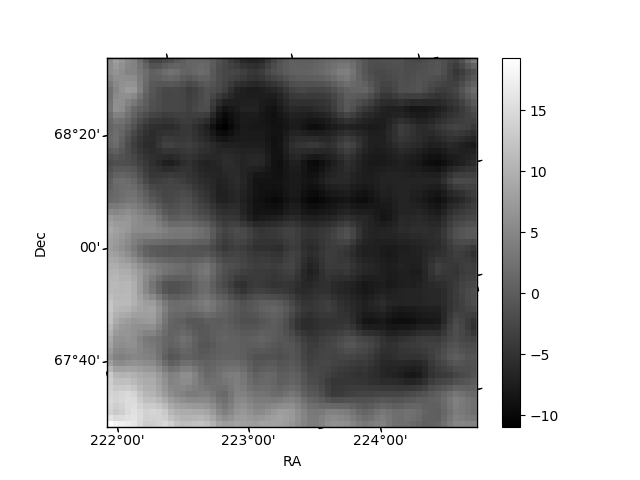
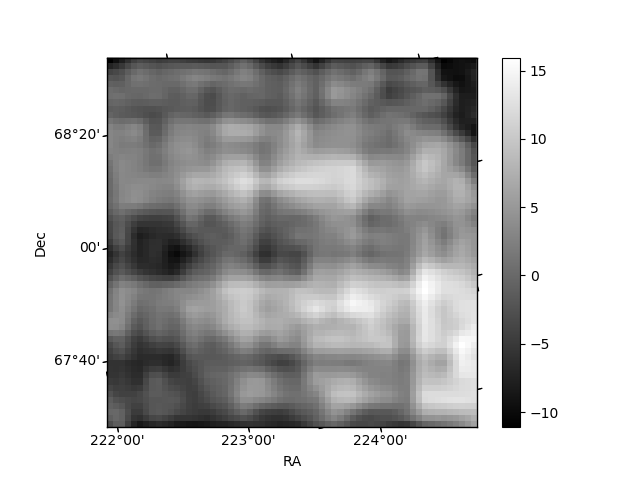
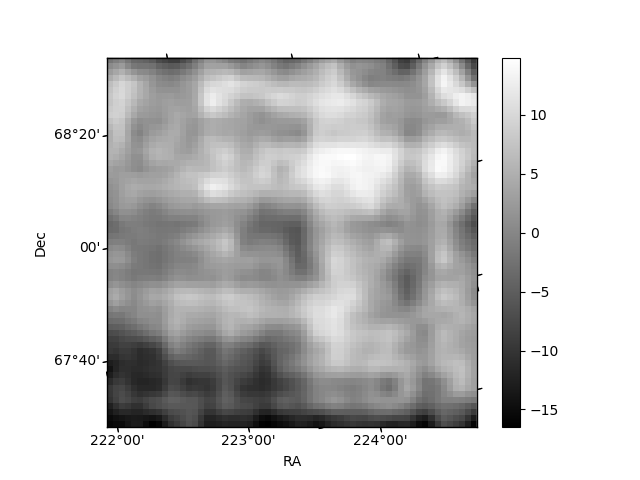
Histogram calculated using DETX and DETY for each event in the final _common_clean file
| Quadrant A | 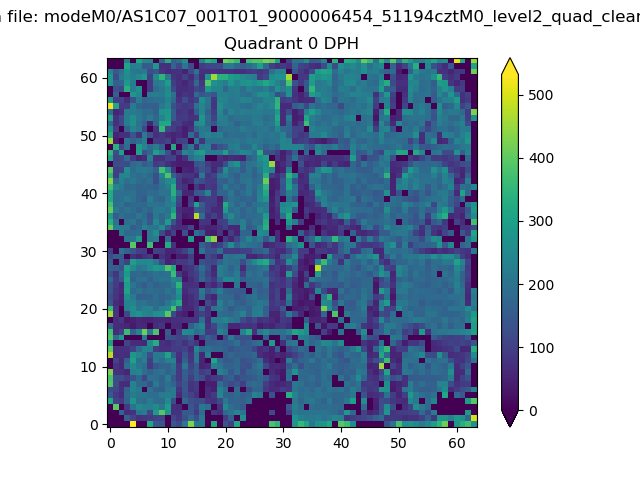 |
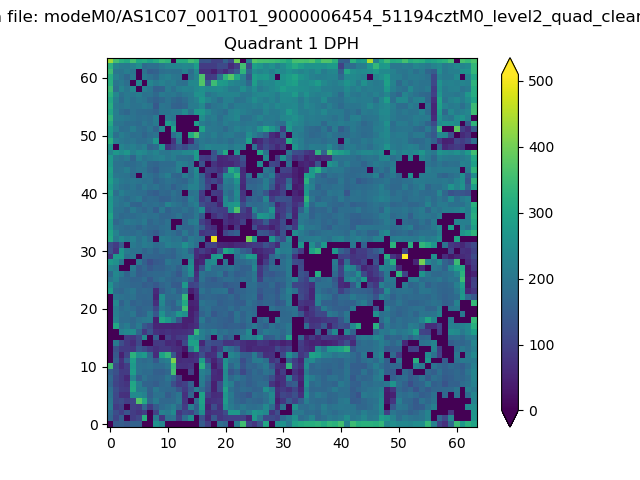 |
Quadrant B |
|---|---|---|---|
| Quadrant D | 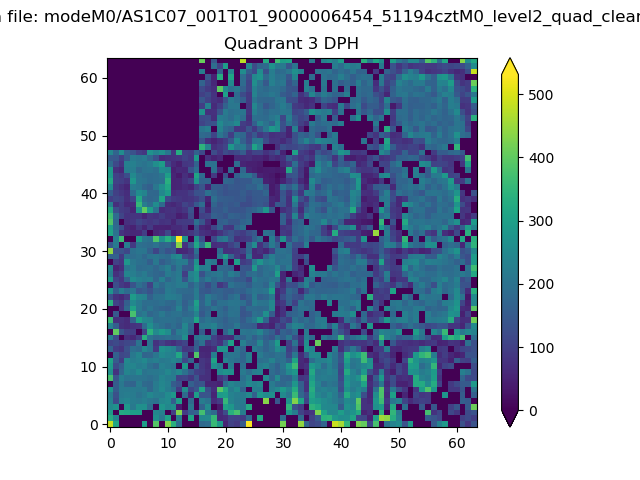 |
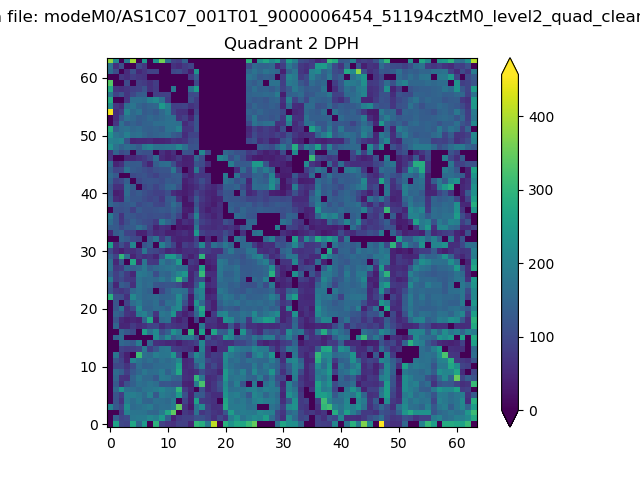 |
Quadrant C |
| Plot type | Count rate plots | Images |
|---|---|---|
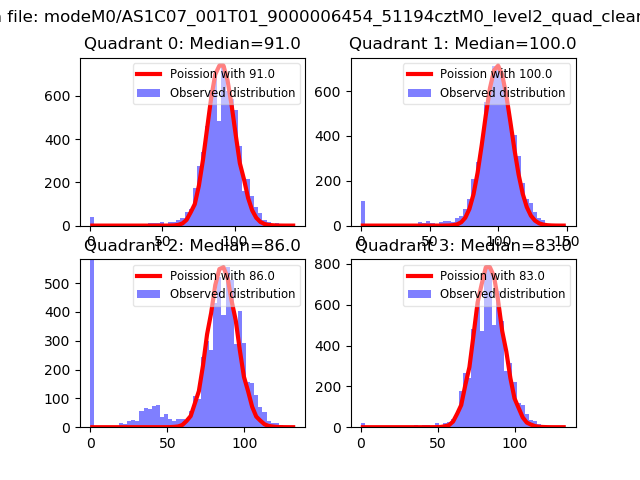
| Comparison with Poisson distribution Blue bars denote a histogram of data divided into 1 sec bins. Red curve is a Poisson curve with rate = median count rate of data. |
 |
 |
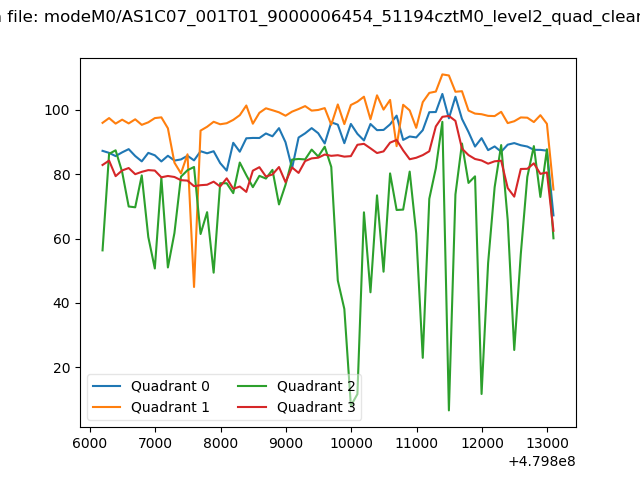
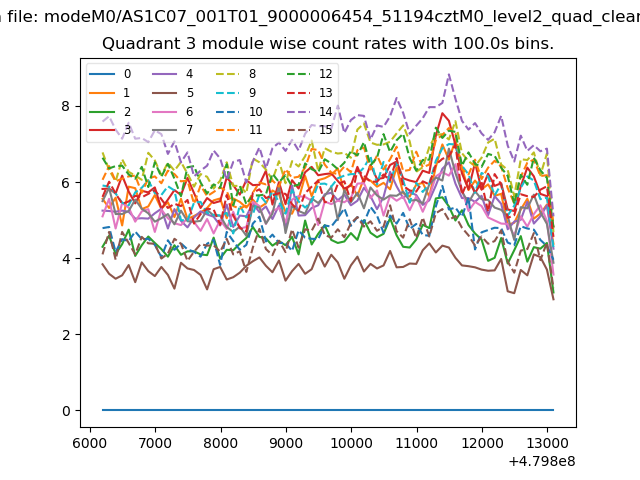
| Quadrant-wise count rates Data is divided into 100 sec bins |
 |
|
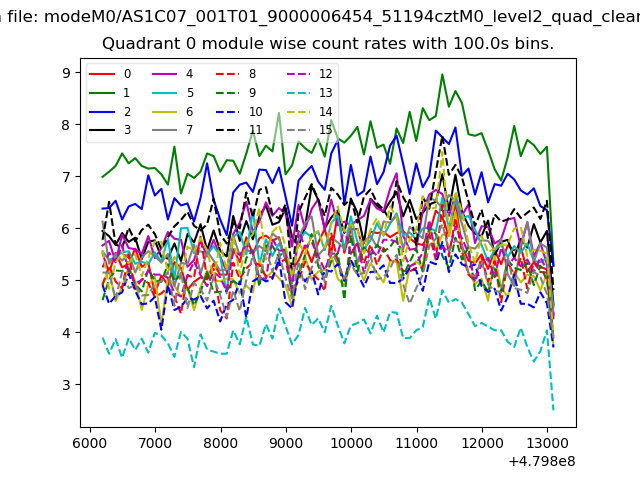
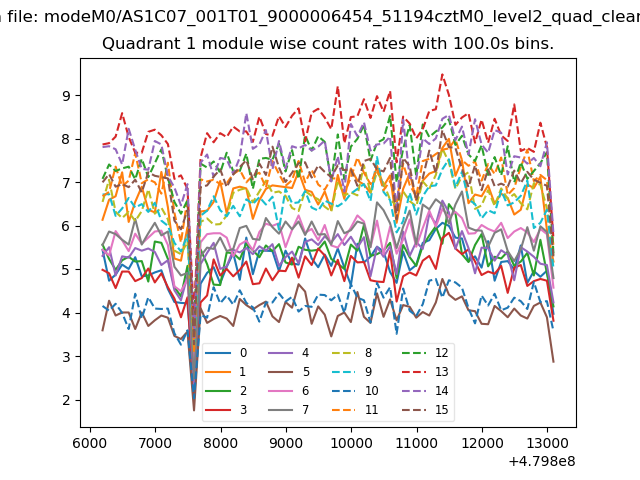
| Module-wise count rates for Quadrant A Data is divided into 100 sec bins |
 |
 |
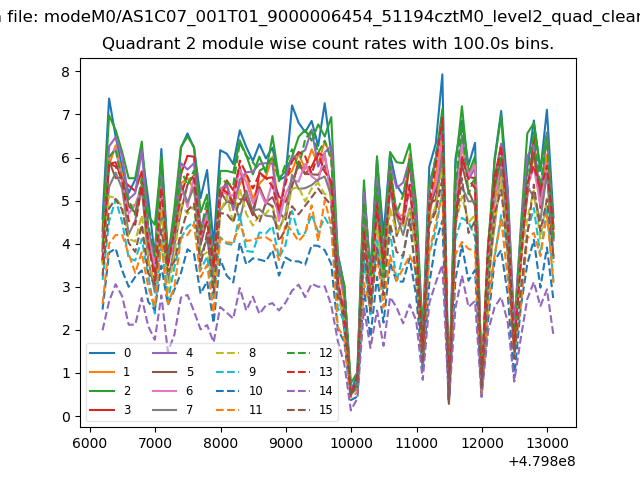
| Module-wise count rates for Quadrant B Data is divided into 100 sec bins |
 |
 |
| Module-wise count rates for Quadrant C Data is divided into 100 sec bins |
 |
 |
| Module-wise count rates for Quadrant D Data is divided into 100 sec bins |
 |
 |
| Parameter | Plot |
|---|---|
| CZT HV Monitor |  |
| D_VDD | 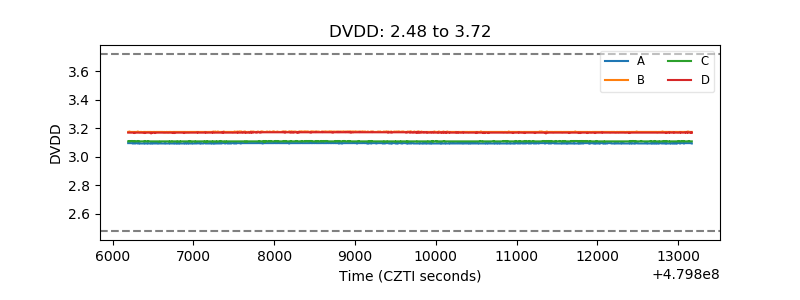 |
| Temperature 1 | 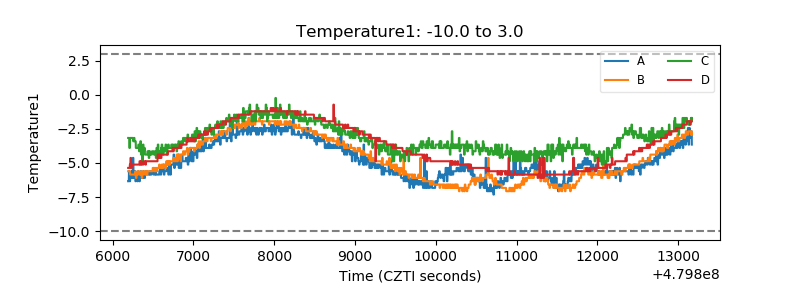 |
| Veto HV Monitor | 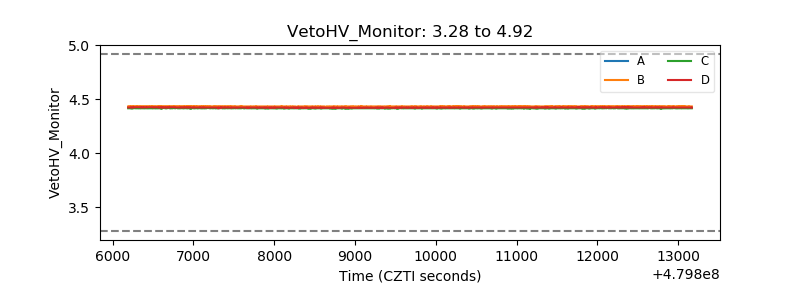 |
| Veto LLD | 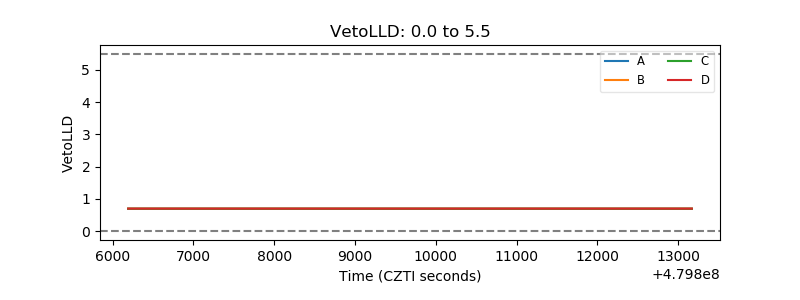 |
| Alpha Counter | 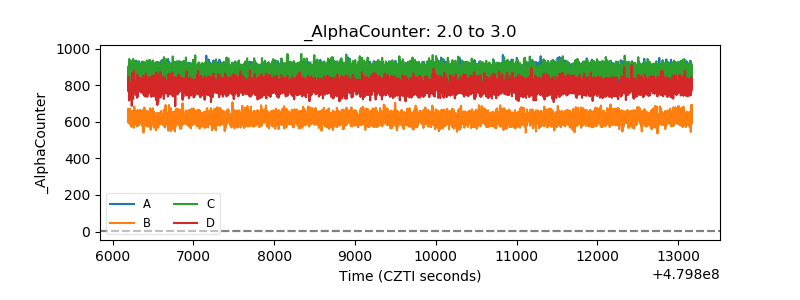 |
| _CPM_Rate | 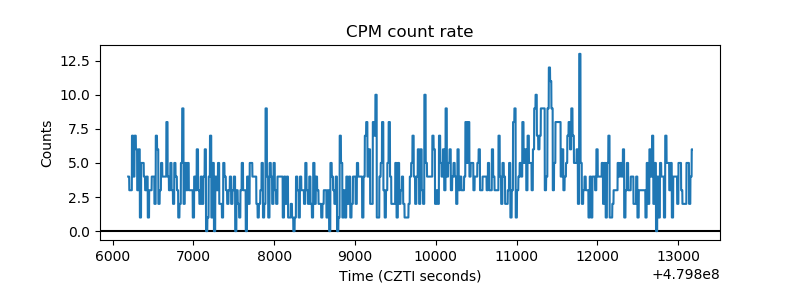 |
| CZT Counter | 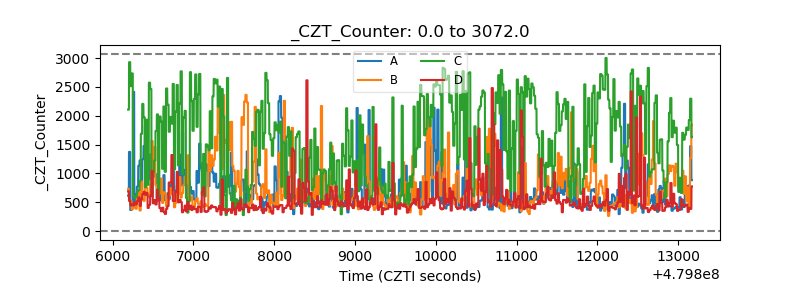 |
| +2.5 Volts monitor | 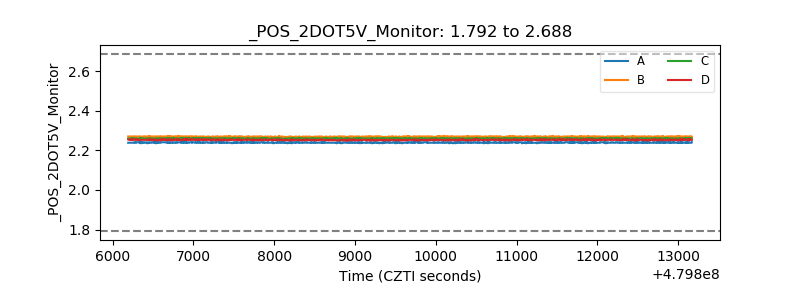 |
| +5 Volts monitor |  |
| _ROLL_ROT | 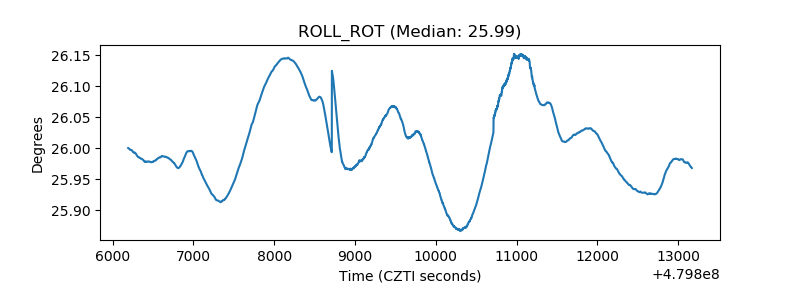 |
| _Roll_DEC | 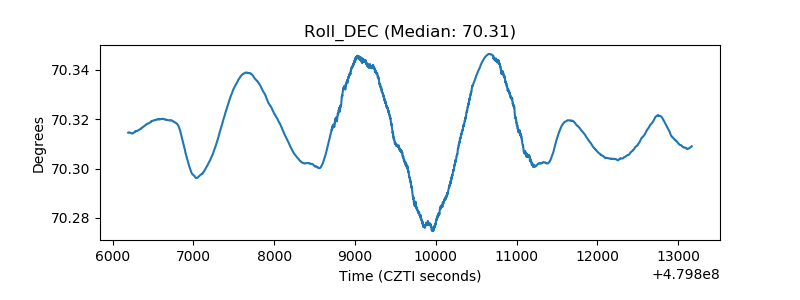 |
| _Roll_RA | 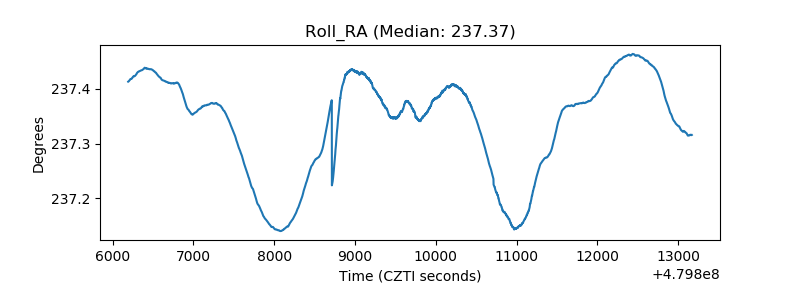 |
| Veto Counter | 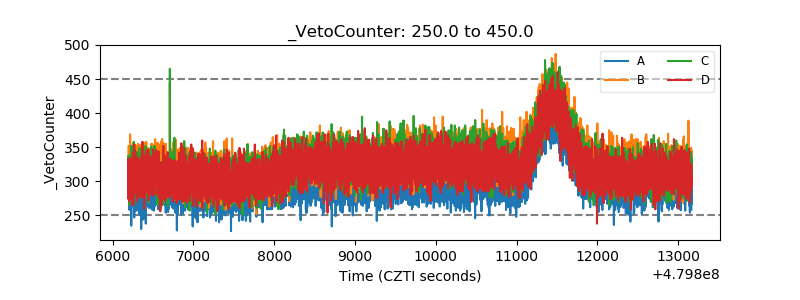 |