| Param | Original file | Final file |
|---|---|---|
| Filename | modeM0/AS1C07_001T01_9000006454_51195cztM0_level2.fits | modeM0/AS1C07_001T01_9000006454_51195cztM0_level2_quad_clean.evt |
| Size (bytes) | 873,509,760 | 97,709,760 |
| Size | 833.0 MB | 93.2 MB |
| Events in quadrant A | 5,560,580 | 687,221 |
| Events in quadrant B | 6,756,509 | 704,345 |
| Events in quadrant C | 13,569,505 | 435,046 |
| Events in quadrant D | 5,851,314 | 594,669 |
| Mode M0 | |||
|---|---|---|---|
| Quadrant | BADHDUFLAG | Total packets | Discarded packets |
| A | 0 | 21827 | 2 |
| B | 0 | 25400 | 0 |
| C | 0 | 45605 | 0 |
| D | 0 | 22841 | 0 |
| Mode SS | |||
|---|---|---|---|
| Quadrant | BADHDUFLAG | Total packets | Discarded packets |
| A | 0 | 154 | 0 |
| B | 0 | 154 | 0 |
| C | 0 | 154 | 0 |
| D | 0 | 154 | 0 |
| Quadrant | Total seconds | Saturated seconds | Saturation percentage |
|---|---|---|---|
| A | 7719 | 245 | 3.173986% |
| B | 7719 | 840 | 10.882239% |
| C | 7719 | 3217 | 41.676383% |
| D | 7719 | 565 | 7.319601% |
Noise dominated data is calculated using 1-second bins in cleaned event files. If a bin has >2000 counts, and if more than 50% of those come from <1% of pixels, then it is considered to be noise-dominated and hence unusable.
| Quadrant | # 1 sec bins | Bins with >0 counts | Bins with >2000 counts | High rate bins dominated by noise | Noise dominated (total time) | Noise dominated (detector-on time) | Marked lightcurve |
|---|---|---|---|---|---|---|---|
| A | 7719 | 7719 | 173 | 173 | 2.24% | 2.24% | 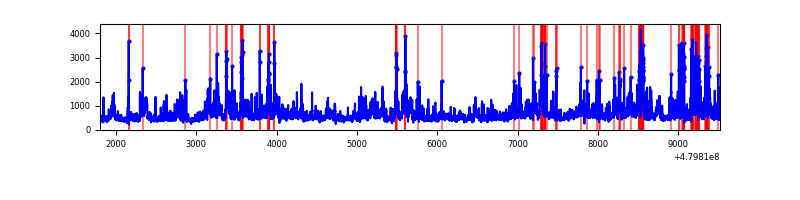 |
| B | 7719 | 7719 | 410 | 410 | 5.31% | 5.31% | 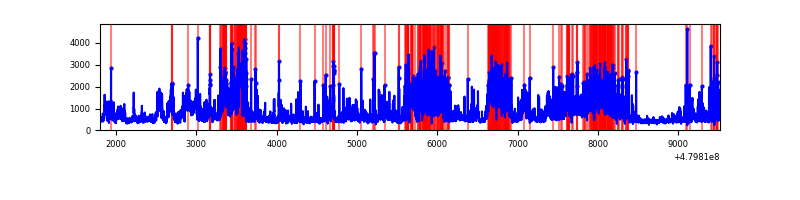 |
| C | 7719 | 7719 | 3015 | 3015 | 39.06% | 39.06% | 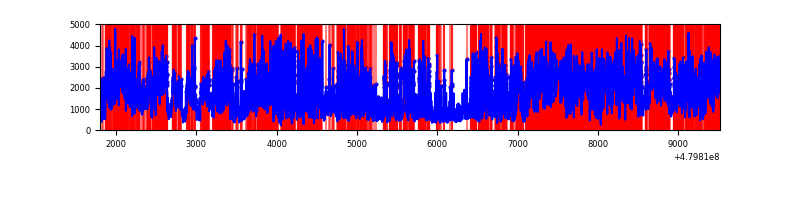 |
| D | 7719 | 7719 | 509 | 509 | 6.59% | 6.59% | 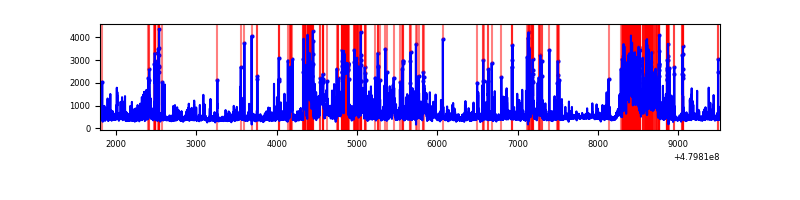 |
Top three noisy pixels from each quadrant. If the there are fewer than three noisy pixels in the level2.evt file, extra rows are filled as -1
| Pixel properties | Quadrant properties | ||||||
|---|---|---|---|---|---|---|---|
| Quadrant | DetID | PixID | Counts | Sigma | Mean | Median | Sigma |
| A | 12 | 3 | 1043916 | 5363.69 | 785 | 767 | 194.5 |
| A | 9 | 160 | 279580 | 1433.61 | 785 | 767 | 194.5 |
| A | 3 | 62 | 229334 | 1175.25 | 785 | 767 | 194.5 |
| B | 12 | 18 | 1321055 | 8077.61 | 764 | 738 | 163.5 |
| B | 10 | 254 | 597670 | 3651.99 | 764 | 738 | 163.5 |
| B | 8 | 128 | 531414 | 3246.64 | 764 | 738 | 163.5 |
| C | 4 | 12 | 6994726 | 38927.84 | 640 | 635 | 179.7 |
| C | 10 | 252 | 968877 | 5389.06 | 640 | 635 | 179.7 |
| C | 12 | 247 | 784587 | 4363.33 | 640 | 635 | 179.7 |
| D | 10 | 172 | 661745 | 3210.3 | 737 | 714 | 205.9 |
| D | 8 | 176 | 578082 | 2803.99 | 737 | 714 | 205.9 |
| D | 2 | 216 | 379136 | 1837.81 | 737 | 714 | 205.9 |
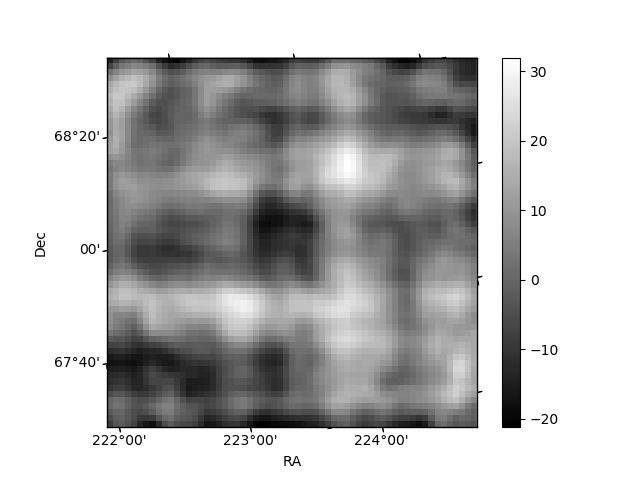
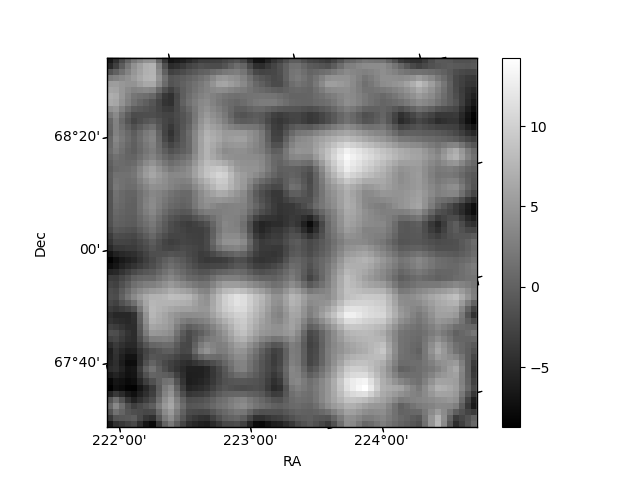
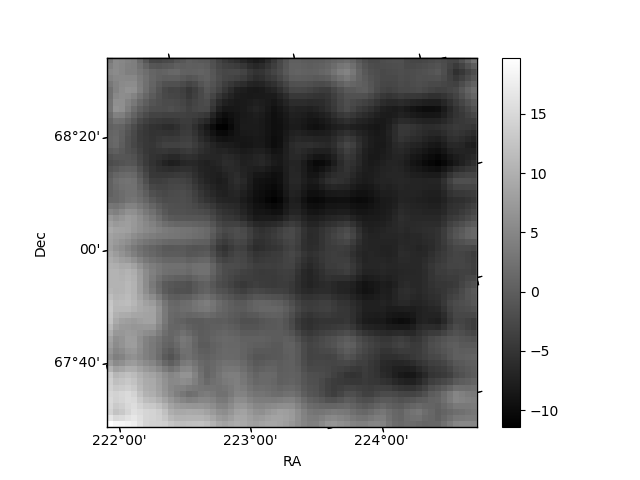
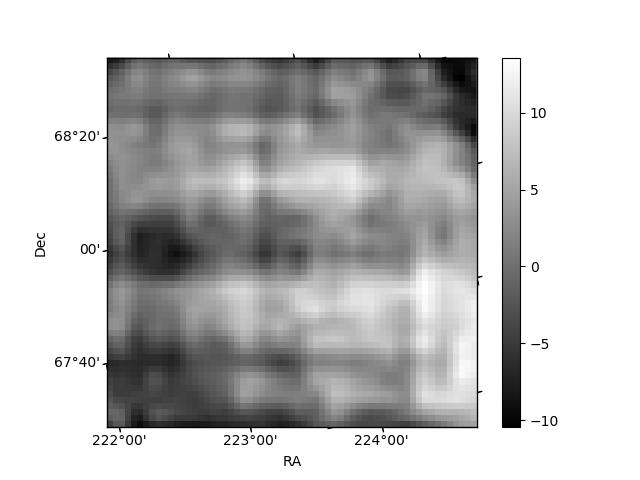
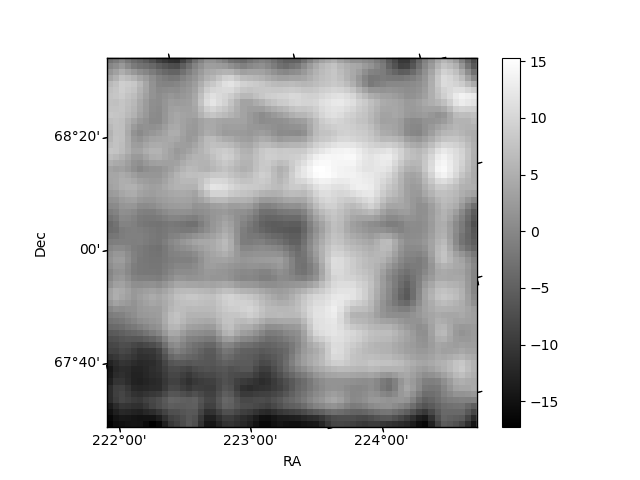
Histogram calculated using DETX and DETY for each event in the final _common_clean file
| Quadrant A | 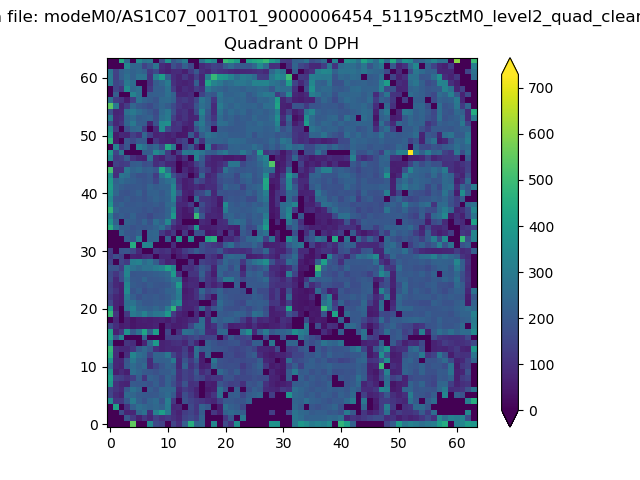 |
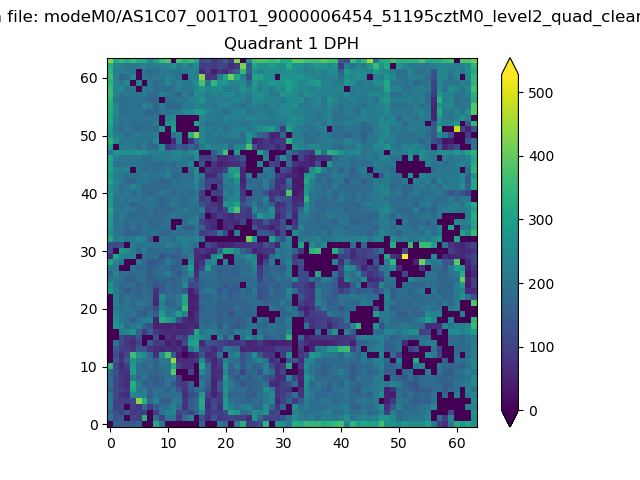 |
Quadrant B |
|---|---|---|---|
| Quadrant D | 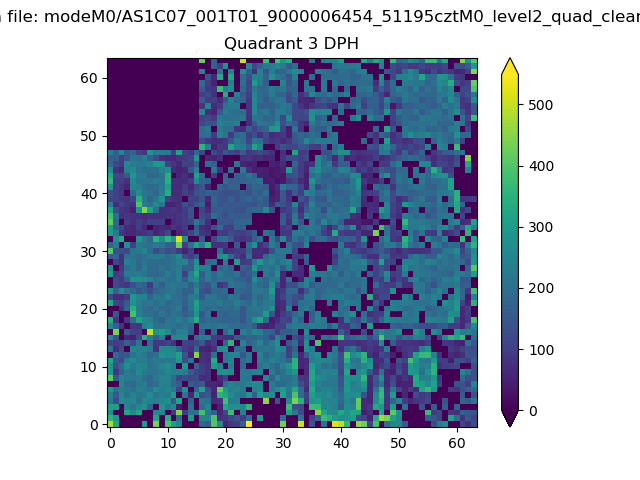 |
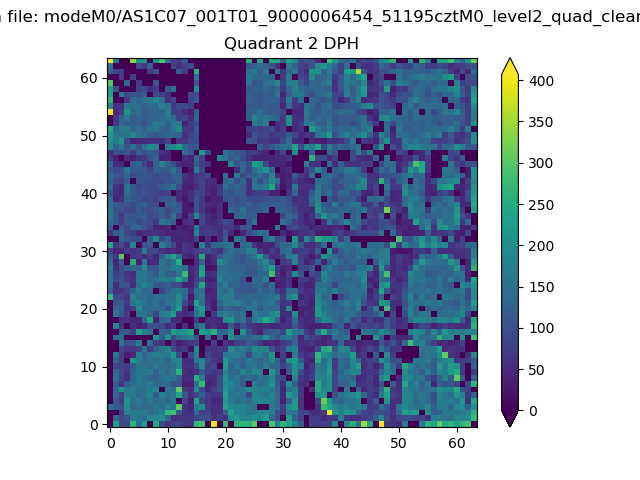 |
Quadrant C |
| Plot type | Count rate plots | Images |
|---|---|---|
| Comparison with Poisson distribution Blue bars denote a histogram of data divided into 1 sec bins. Red curve is a Poisson curve with rate = median count rate of data. |
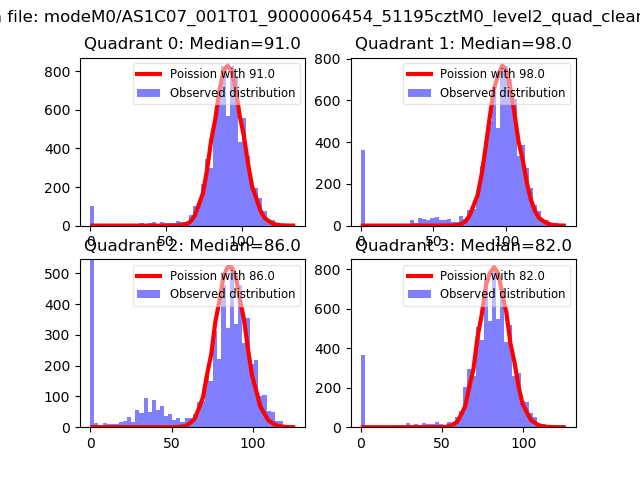 |
 |
| Quadrant-wise count rates Data is divided into 100 sec bins |
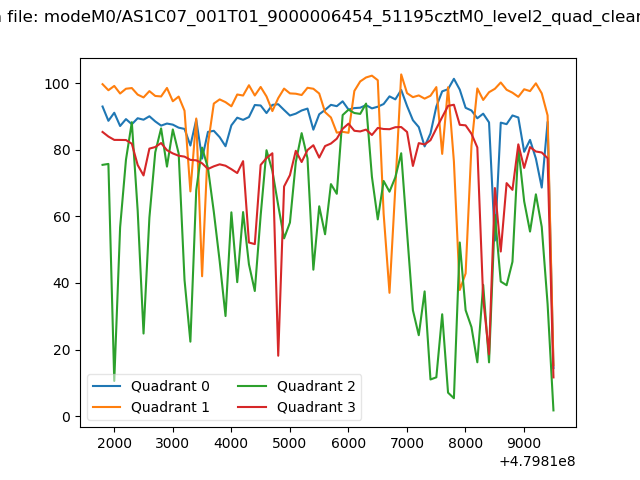 |
|
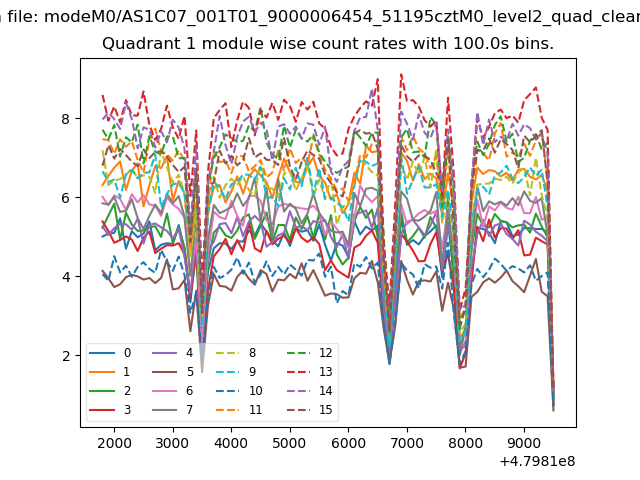
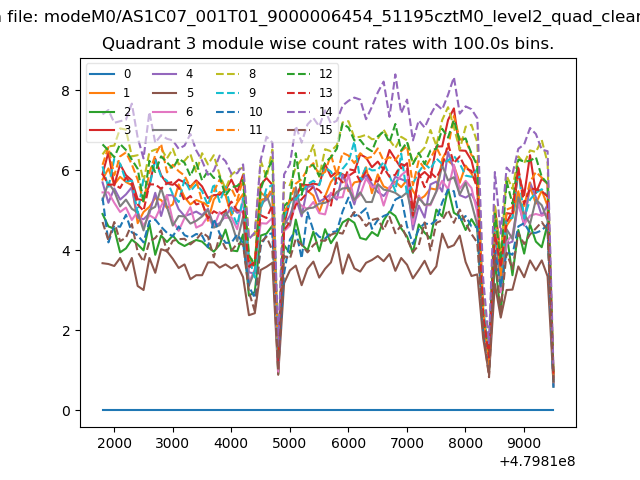
| Module-wise count rates for Quadrant A Data is divided into 100 sec bins |
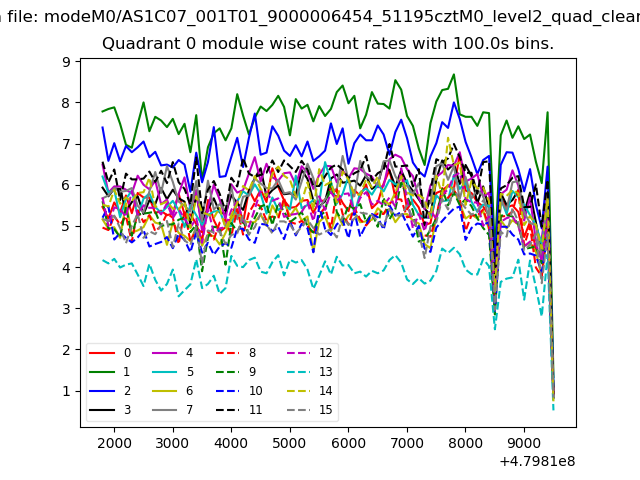 |
 |
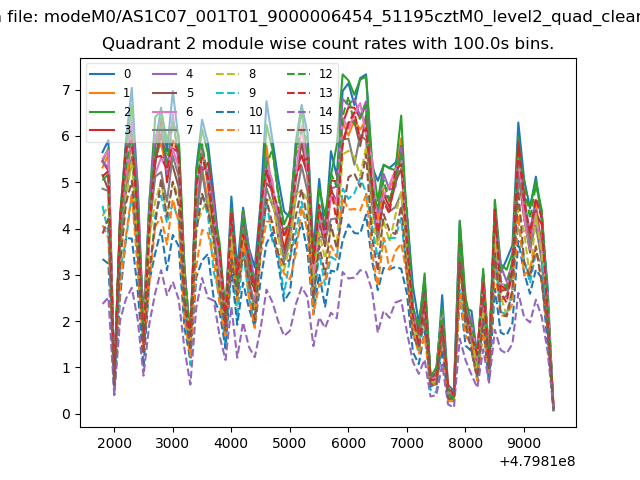
| Module-wise count rates for Quadrant B Data is divided into 100 sec bins |
 |
 |
| Module-wise count rates for Quadrant C Data is divided into 100 sec bins |
 |
 |
| Module-wise count rates for Quadrant D Data is divided into 100 sec bins |
 |
 |
| Parameter | Plot |
|---|---|
| CZT HV Monitor | 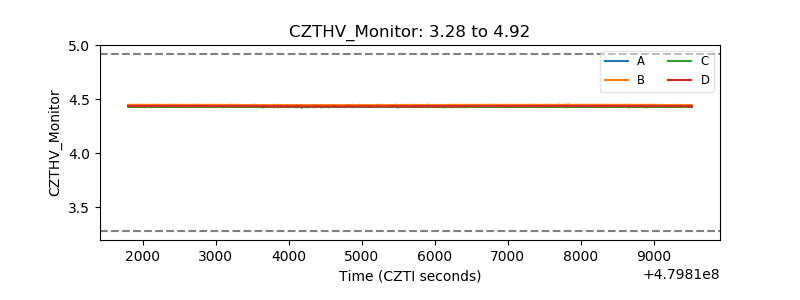 |
| D_VDD | 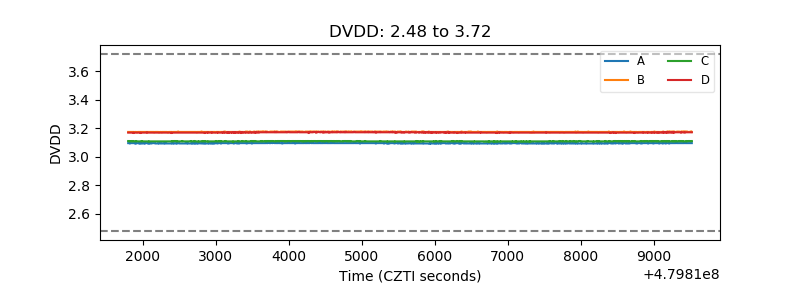 |
| Temperature 1 | 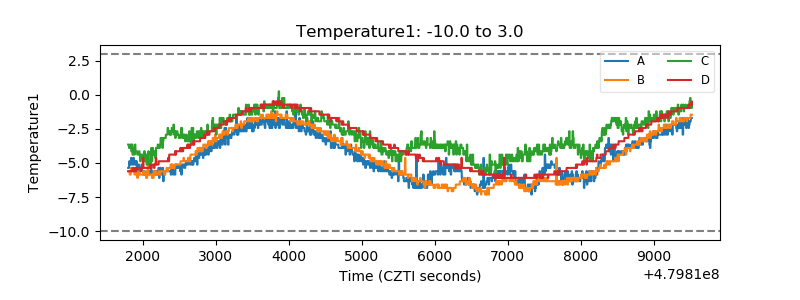 |
| Veto HV Monitor | 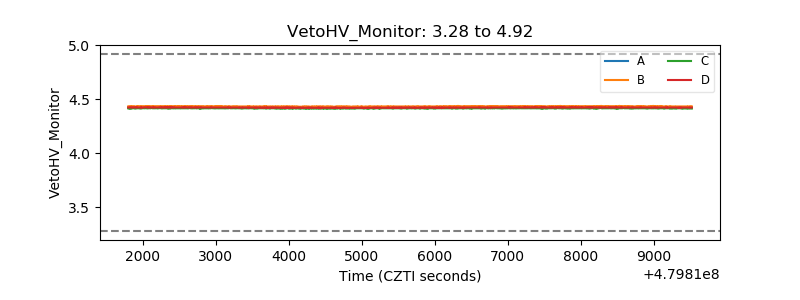 |
| Veto LLD | 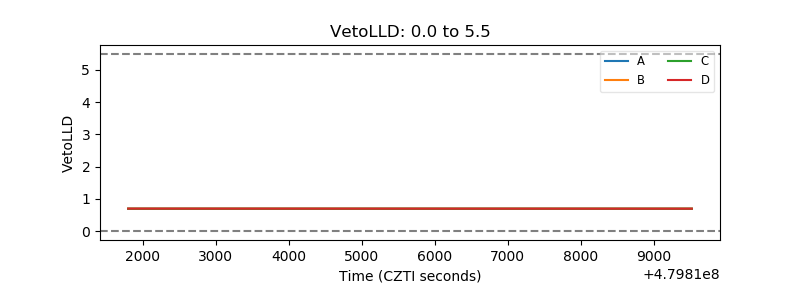 |
| Alpha Counter | 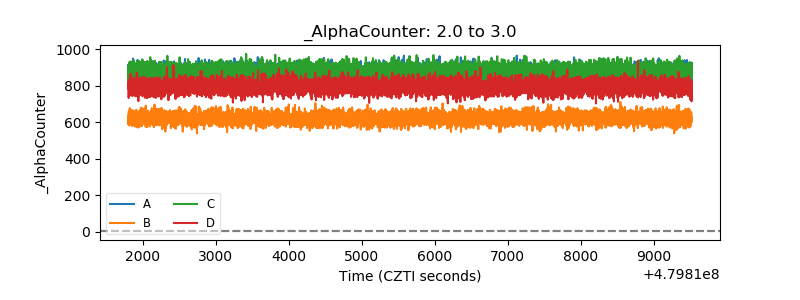 |
| _CPM_Rate | 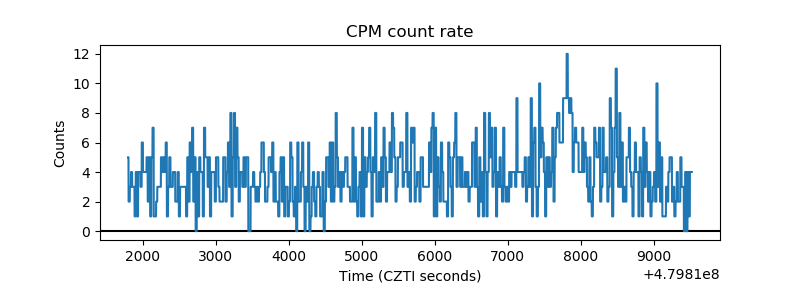 |
| CZT Counter | 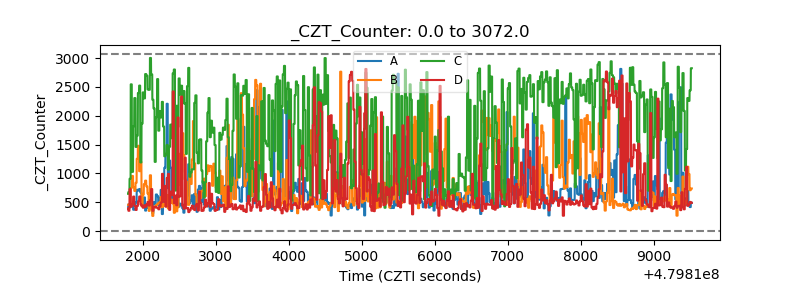 |
| +2.5 Volts monitor | 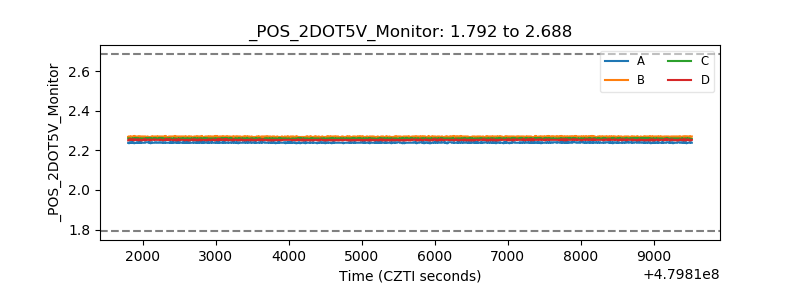 |
| +5 Volts monitor |  |
| _ROLL_ROT | 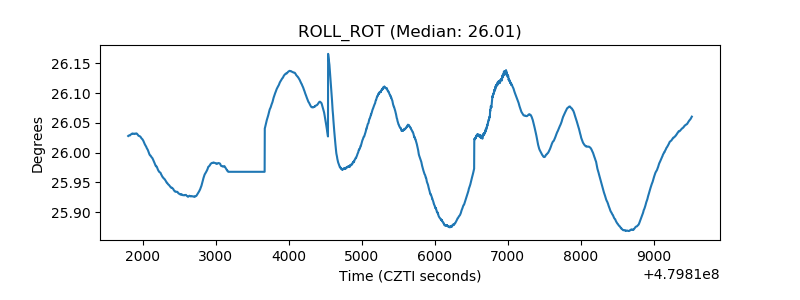 |
| _Roll_DEC | 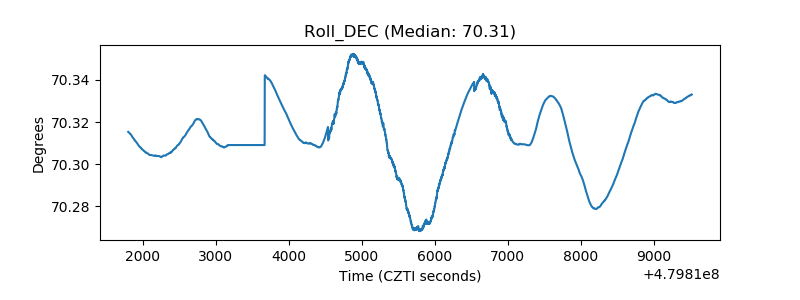 |
| _Roll_RA | 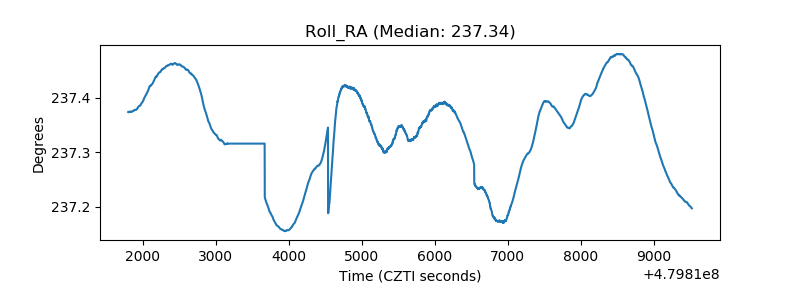 |
| Veto Counter | 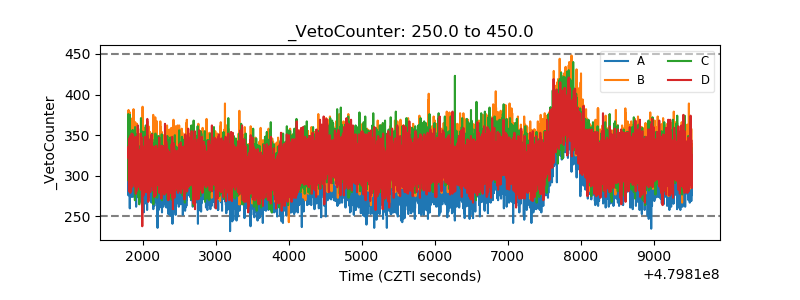 |