| Param | Original file | Final file |
|---|---|---|
| Filename | modeM0/AS1C07_001T01_9000006454_51196cztM0_level2.fits | modeM0/AS1C07_001T01_9000006454_51196cztM0_level2_quad_clean.evt |
| Size (bytes) | 786,833,280 | 91,713,600 |
| Size | 750.4 MB | 87.5 MB |
| Events in quadrant A | 5,190,876 | 642,265 |
| Events in quadrant B | 4,860,121 | 702,651 |
| Events in quadrant C | 13,326,571 | 356,256 |
| Events in quadrant D | 5,193,503 | 575,956 |
| Mode M0 | |||
|---|---|---|---|
| Quadrant | BADHDUFLAG | Total packets | Discarded packets |
| A | 0 | 20293 | 0 |
| B | 0 | 19342 | 0 |
| C | 0 | 44503 | 1 |
| D | 0 | 20455 | 0 |
| Mode SS | |||
|---|---|---|---|
| Quadrant | BADHDUFLAG | Total packets | Discarded packets |
| A | 0 | 144 | 0 |
| B | 0 | 144 | 0 |
| C | 0 | 144 | 0 |
| D | 0 | 144 | 0 |
| Quadrant | Total seconds | Saturated seconds | Saturation percentage |
|---|---|---|---|
| A | 7169 | 298 | 4.156786% |
| B | 7169 | 280 | 3.905705% |
| C | 7169 | 3634 | 50.690473% |
| D | 7169 | 343 | 4.784489% |
Noise dominated data is calculated using 1-second bins in cleaned event files. If a bin has >2000 counts, and if more than 50% of those come from <1% of pixels, then it is considered to be noise-dominated and hence unusable.
| Quadrant | # 1 sec bins | Bins with >0 counts | Bins with >2000 counts | High rate bins dominated by noise | Noise dominated (total time) | Noise dominated (detector-on time) | Marked lightcurve |
|---|---|---|---|---|---|---|---|
| A | 7169 | 7169 | 177 | 177 | 2.47% | 2.47% | 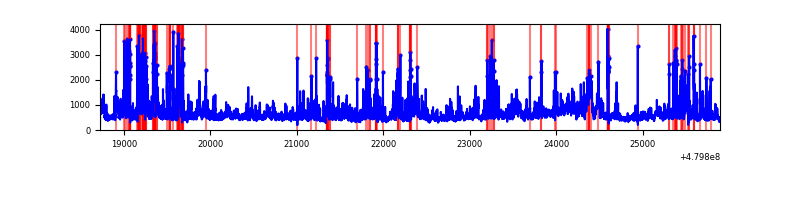 |
| B | 7169 | 7169 | 153 | 153 | 2.13% | 2.13% | 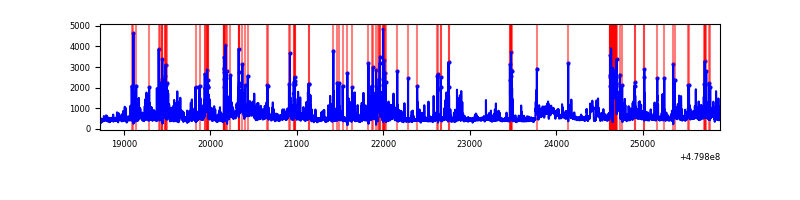 |
| C | 7169 | 7169 | 3178 | 3178 | 44.33% | 44.33% | 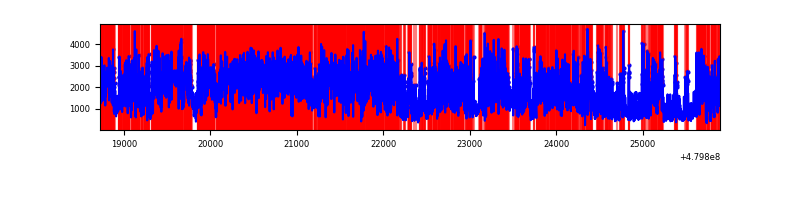 |
| D | 7169 | 7169 | 286 | 286 | 3.99% | 3.99% | 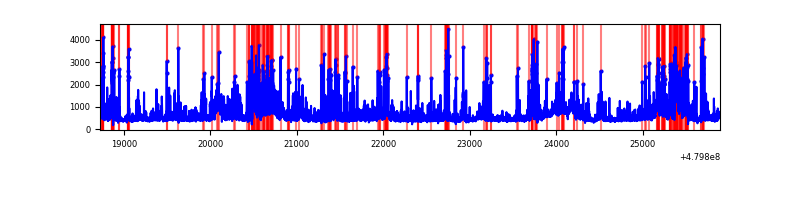 |
Top three noisy pixels from each quadrant. If the there are fewer than three noisy pixels in the level2.evt file, extra rows are filled as -1
| Pixel properties | Quadrant properties | ||||||
|---|---|---|---|---|---|---|---|
| Quadrant | DetID | PixID | Counts | Sigma | Mean | Median | Sigma |
| A | 12 | 3 | 695124 | 3730.06 | 745 | 725 | 186.2 |
| A | 13 | 248 | 262456 | 1405.92 | 745 | 725 | 186.2 |
| A | 3 | 114 | 185176 | 990.8 | 745 | 725 | 186.2 |
| B | 4 | 170 | 360139 | 2237.83 | 742 | 717 | 160.6 |
| B | 5 | 172 | 324093 | 2013.4 | 742 | 717 | 160.6 |
| B | 8 | 234 | 271889 | 1688.37 | 742 | 717 | 160.6 |
| C | 4 | 12 | 5863199 | 36169.94 | 590 | 587 | 162.1 |
| C | 15 | 230 | 1289994 | 7955.12 | 590 | 587 | 162.1 |
| C | 10 | 252 | 862785 | 5319.41 | 590 | 587 | 162.1 |
| D | 10 | 172 | 359355 | 1759.41 | 716 | 690 | 203.9 |
| D | 8 | 176 | 299888 | 1467.7 | 716 | 690 | 203.9 |
| D | 7 | 60 | 220732 | 1079.4 | 716 | 690 | 203.9 |
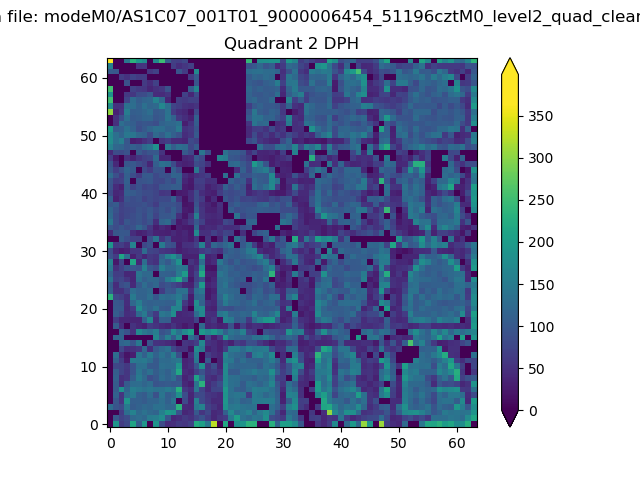
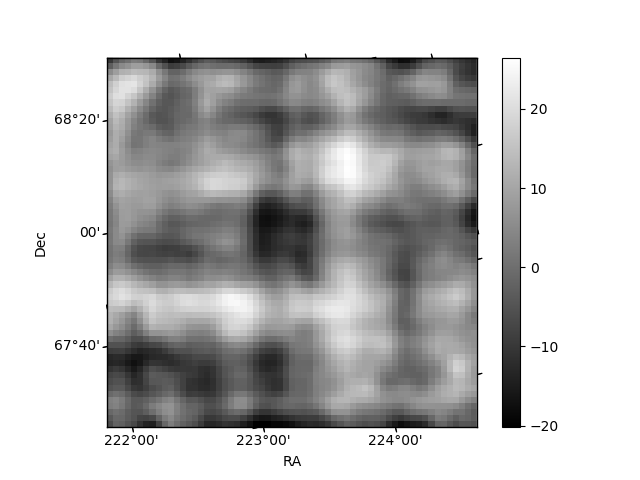
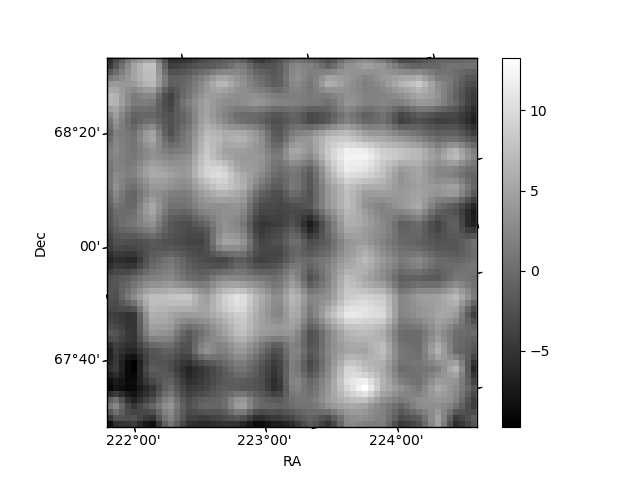
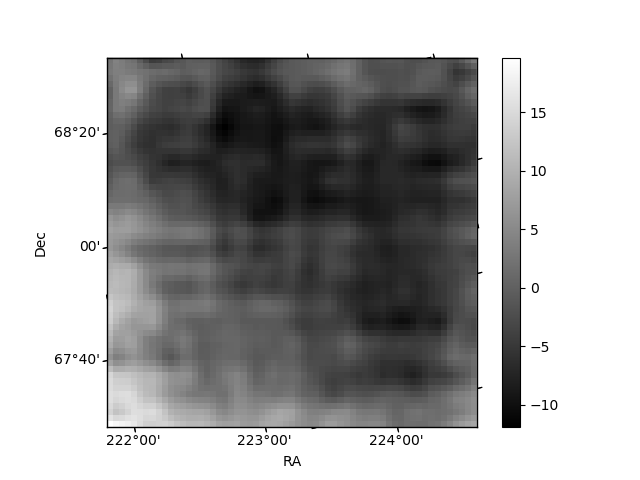
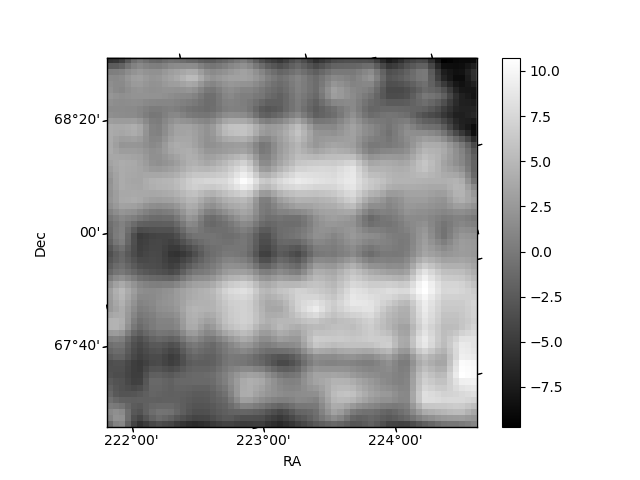
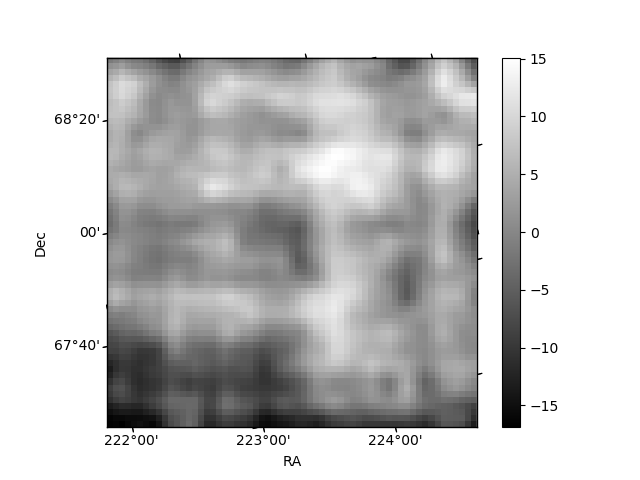
Histogram calculated using DETX and DETY for each event in the final _common_clean file
| Quadrant A | 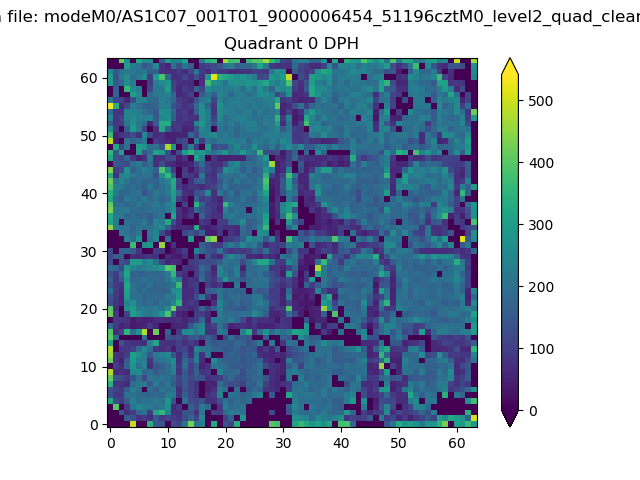 |
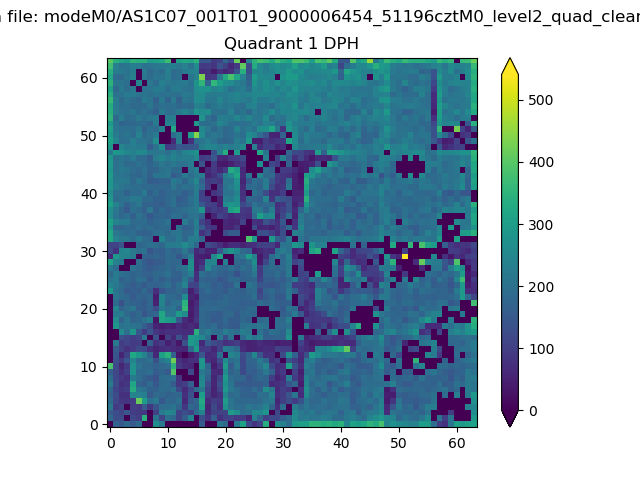 |
Quadrant B |
|---|---|---|---|
| Quadrant D | 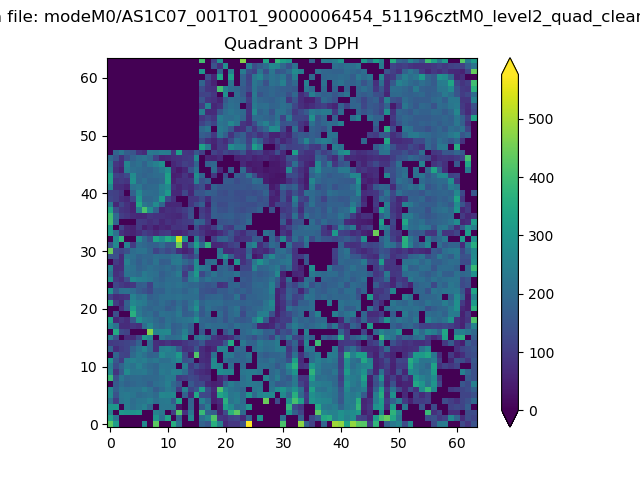 |
 |
Quadrant C |
| Plot type | Count rate plots | Images |
|---|---|---|
| Comparison with Poisson distribution Blue bars denote a histogram of data divided into 1 sec bins. Red curve is a Poisson curve with rate = median count rate of data. |
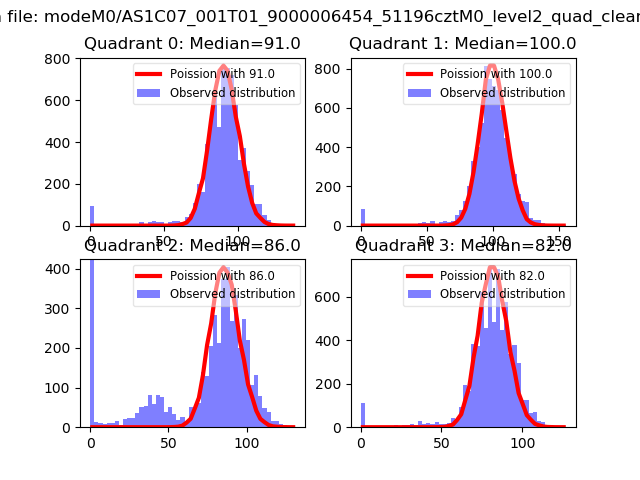 |
 |
| Quadrant-wise count rates Data is divided into 100 sec bins |
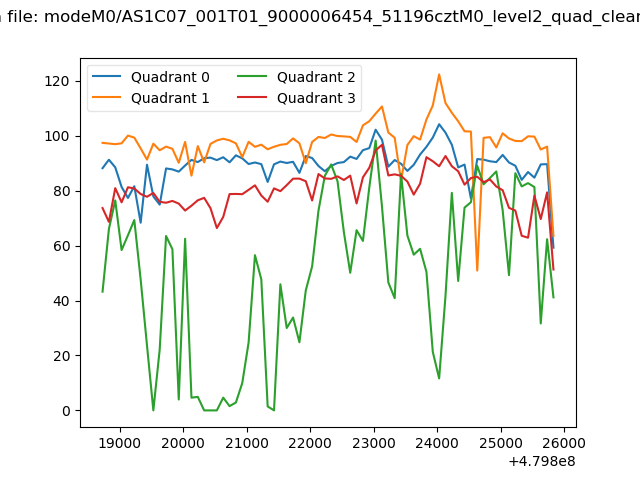 |
|
| Module-wise count rates for Quadrant A Data is divided into 100 sec bins |
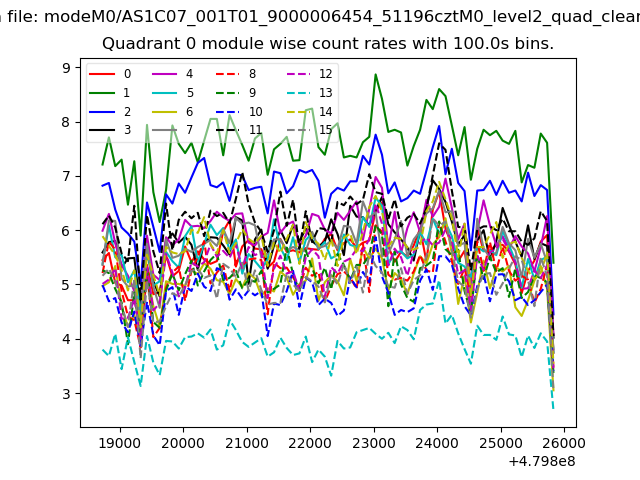 |
 |
| Module-wise count rates for Quadrant B Data is divided into 100 sec bins |
 |
 |
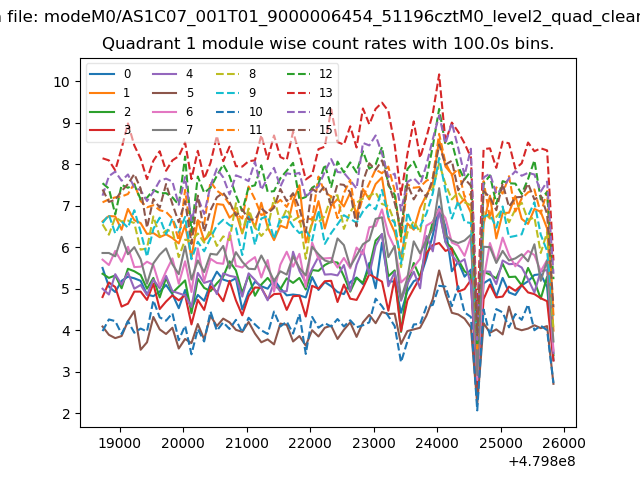
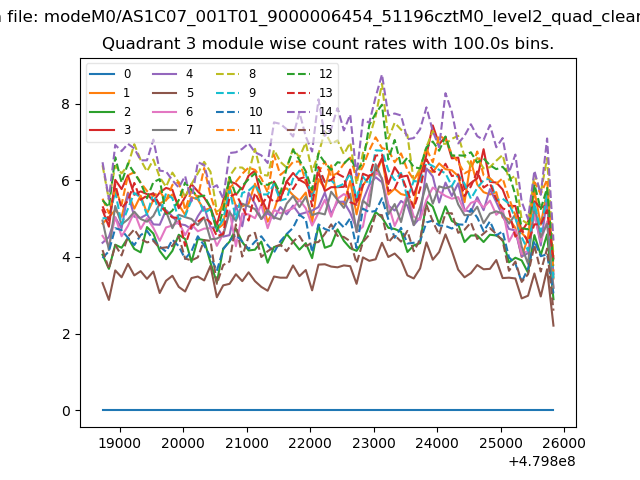
| Module-wise count rates for Quadrant C Data is divided into 100 sec bins |
 |
 |
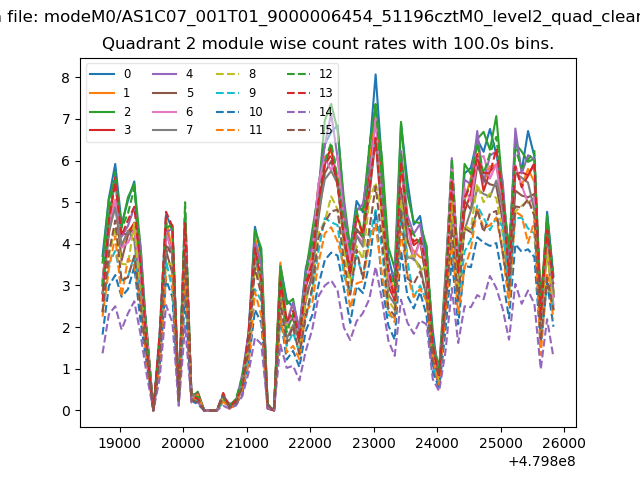
| Module-wise count rates for Quadrant D Data is divided into 100 sec bins |
 |
 |
| Parameter | Plot |
|---|---|
| CZT HV Monitor | 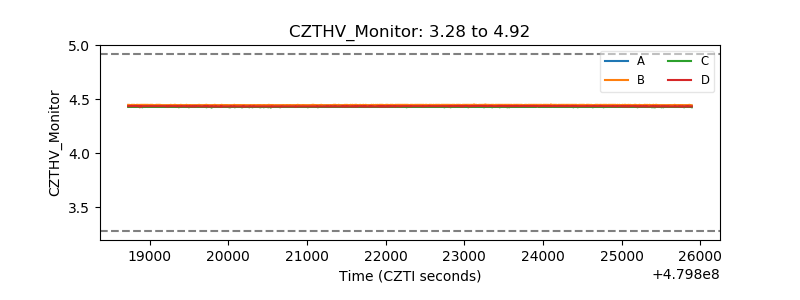 |
| D_VDD | 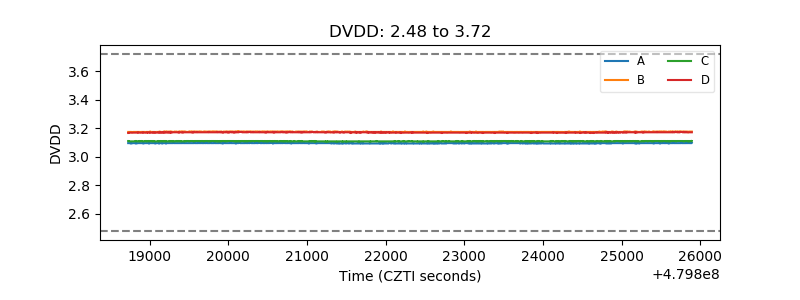 |
| Temperature 1 | 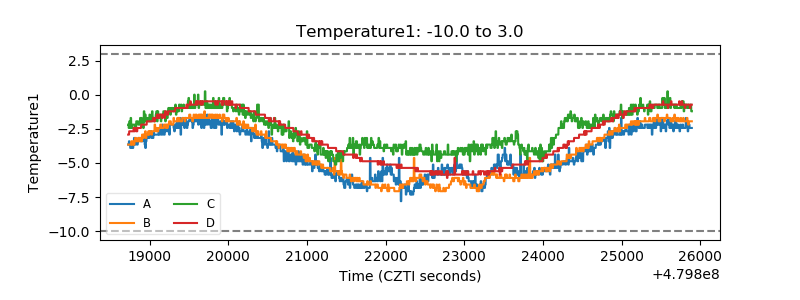 |
| Veto HV Monitor |  |
| Veto LLD | 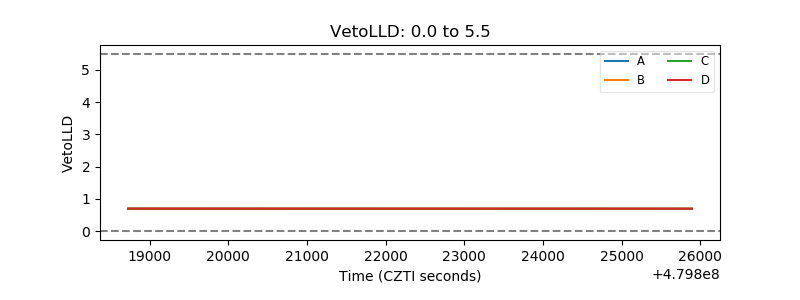 |
| Alpha Counter | 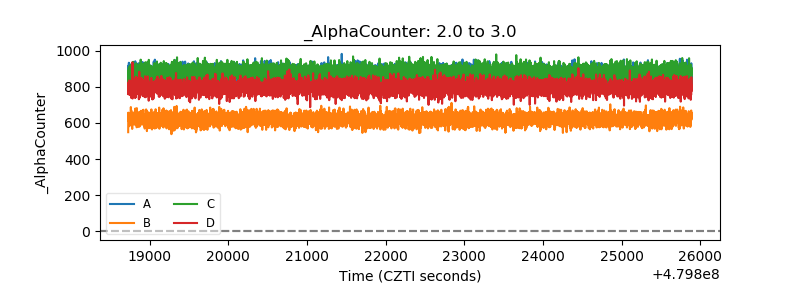 |
| _CPM_Rate | 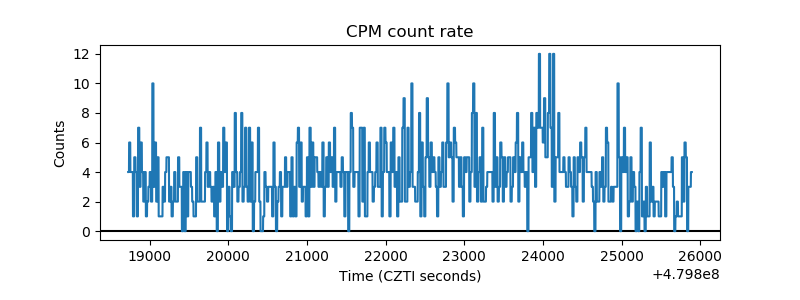 |
| CZT Counter | 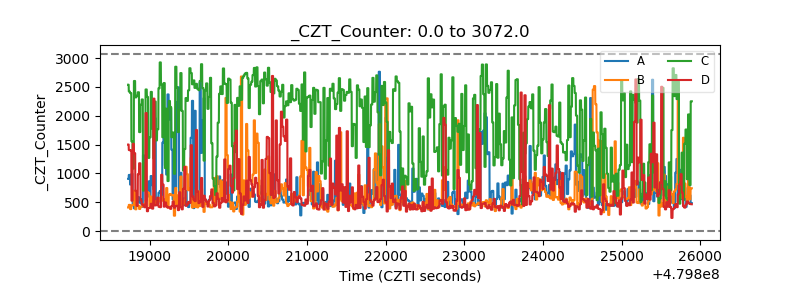 |
| +2.5 Volts monitor | 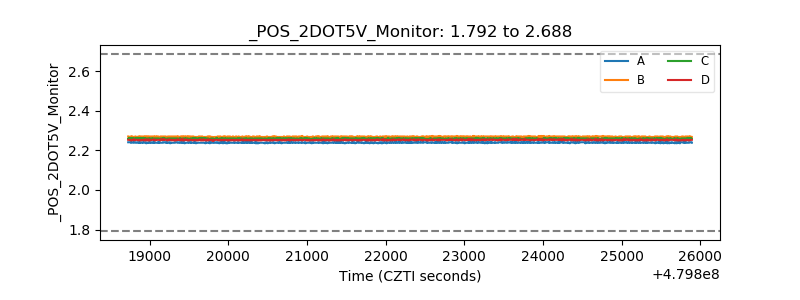 |
| +5 Volts monitor | 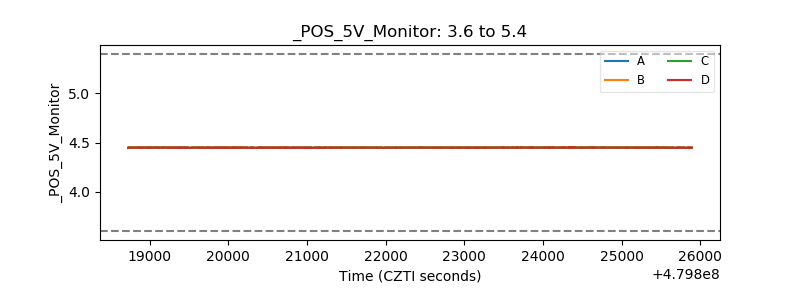 |
| _ROLL_ROT | 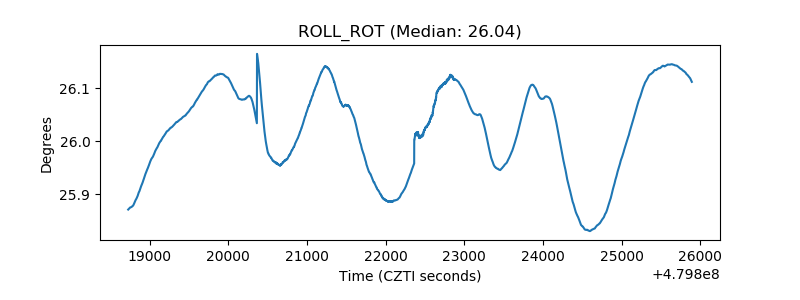 |
| _Roll_DEC | 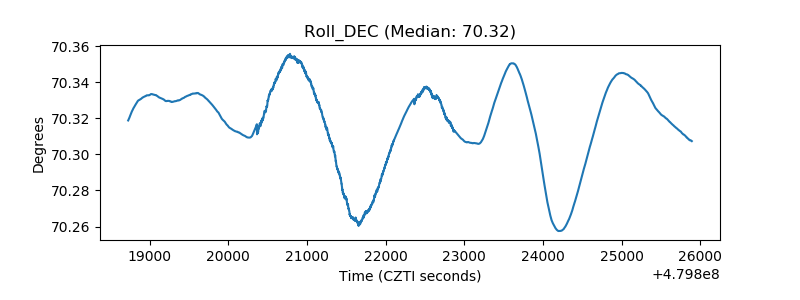 |
| _Roll_RA | 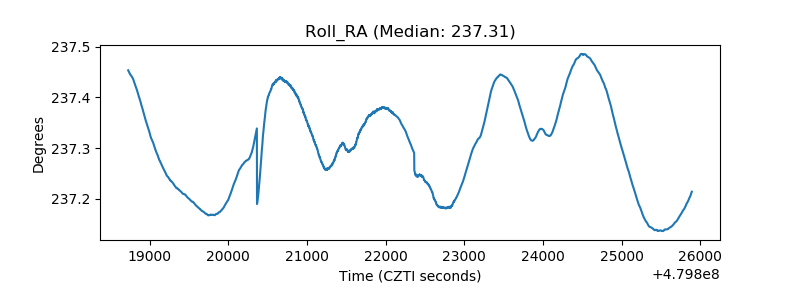 |
| Veto Counter | 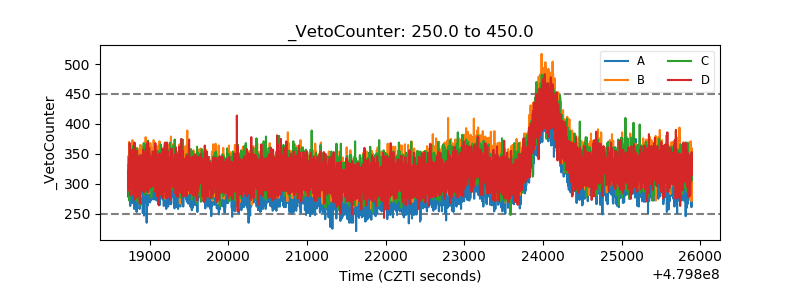 |