| Param | Original file | Final file |
|---|---|---|
| Filename | modeM0/AS1C07_001T01_9000006454_51199cztM0_level2.fits | modeM0/AS1C07_001T01_9000006454_51199cztM0_level2_quad_clean.evt |
| Size (bytes) | 2,060,962,560 | 221,572,800 |
| Size | 1.9 GB | 211.3 MB |
| Events in quadrant A | 12,363,673 | 1,615,978 |
| Events in quadrant B | 14,192,111 | 1,587,052 |
| Events in quadrant C | 28,058,305 | 991,060 |
| Events in quadrant D | 20,272,750 | 1,257,790 |
| Mode M0 | |||
|---|---|---|---|
| Quadrant | BADHDUFLAG | Total packets | Discarded packets |
| A | 0 | 49398 | 4 |
| B | 0 | 54698 | 4 |
| C | 0 | 95869 | 12 |
| D | 0 | 72914 | 4 |
| Mode SS | |||
|---|---|---|---|
| Quadrant | BADHDUFLAG | Total packets | Discarded packets |
| A | 0 | 372 | 0 |
| B | 0 | 372 | 0 |
| C | 0 | 372 | 0 |
| D | 0 | 372 | 0 |
| Mode M9 | |||
|---|---|---|---|
| Quadrant | BADHDUFLAG | Total packets | Discarded packets |
| A | 0 | 15 | 0 |
| B | 0 | 15 | 0 |
| C | 0 | 15 | 0 |
| D | 0 | 15 | 0 |
| Quadrant | Total seconds | Saturated seconds | Saturation percentage |
|---|---|---|---|
| A | 18210 | 623 | 3.421197% |
| B | 18211 | 2081 | 11.427159% |
| C | 18210 | 7108 | 39.033498% |
| D | 18211 | 3079 | 16.907364% |
Noise dominated data is calculated using 1-second bins in cleaned event files. If a bin has >2000 counts, and if more than 50% of those come from <1% of pixels, then it is considered to be noise-dominated and hence unusable.
| Quadrant | # 1 sec bins | Bins with >0 counts | Bins with >2000 counts | High rate bins dominated by noise | Noise dominated (total time) | Noise dominated (detector-on time) | Marked lightcurve |
|---|---|---|---|---|---|---|---|
| A | 19765 | 18215 | 249 | 249 | 1.26% | 1.37% | 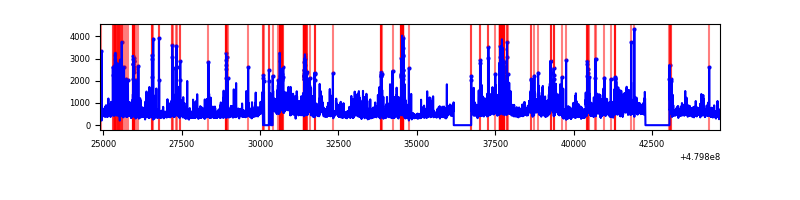 |
| B | 19766 | 18216 | 1358 | 1358 | 6.87% | 7.45% | 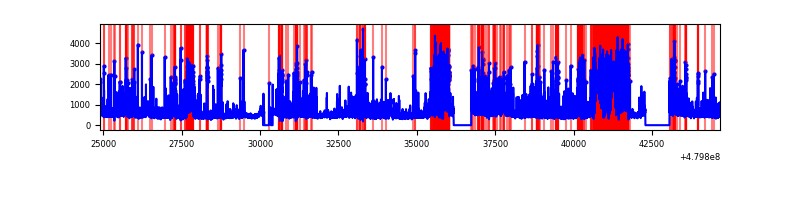 |
| C | 19766 | 18213 | 6372 | 6372 | 32.24% | 34.99% | 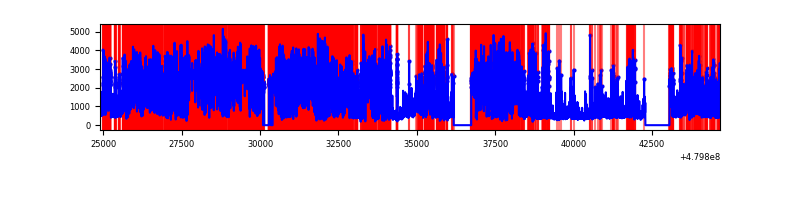 |
| D | 19766 | 18215 | 2522 | 2522 | 12.76% | 13.85% | 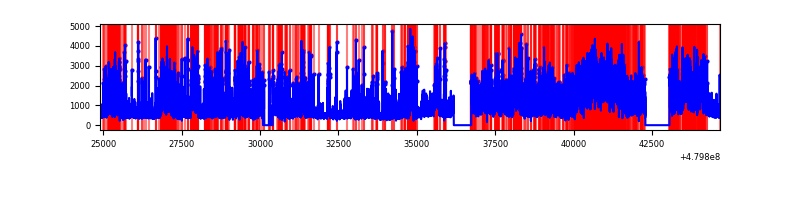 |
Top three noisy pixels from each quadrant. If the there are fewer than three noisy pixels in the level2.evt file, extra rows are filled as -1
| Pixel properties | Quadrant properties | ||||||
|---|---|---|---|---|---|---|---|
| Quadrant | DetID | PixID | Counts | Sigma | Mean | Median | Sigma |
| A | 12 | 3 | 2542726 | 5359.99 | 1899 | 1852 | 474.0 |
| A | 12 | 194 | 304497 | 638.43 | 1899 | 1852 | 474.0 |
| A | 13 | 248 | 269179 | 563.93 | 1899 | 1852 | 474.0 |
| B | 12 | 32 | 3251636 | 8527.0 | 1803 | 1741 | 381.1 |
| B | 5 | 172 | 460299 | 1203.15 | 1803 | 1741 | 381.1 |
| B | 0 | 213 | 428341 | 1119.3 | 1803 | 1741 | 381.1 |
| C | 4 | 12 | 14517146 | 35178.86 | 1475 | 1460 | 412.6 |
| C | 15 | 253 | 1454698 | 3521.93 | 1475 | 1460 | 412.6 |
| C | 1 | 60 | 1096308 | 2653.37 | 1475 | 1460 | 412.6 |
| D | 2 | 62 | 6319079 | 12598.82 | 1763 | 1703 | 501.4 |
| D | 8 | 176 | 1446597 | 2881.57 | 1763 | 1703 | 501.4 |
| D | 7 | 126 | 784927 | 1561.99 | 1763 | 1703 | 501.4 |
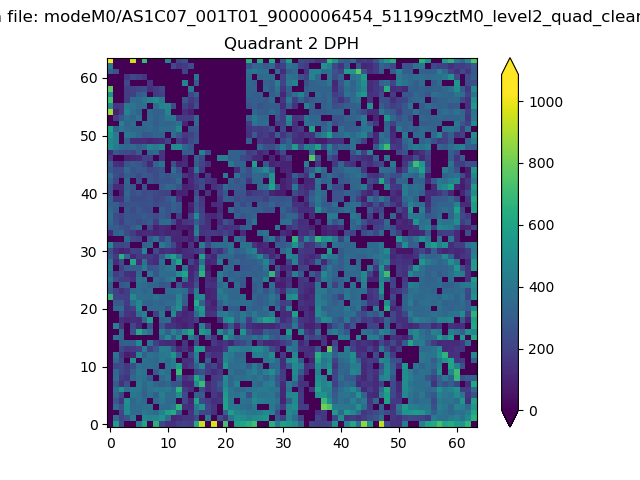
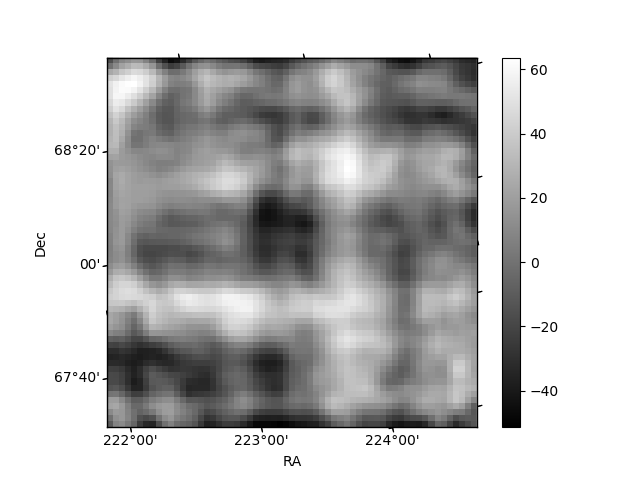
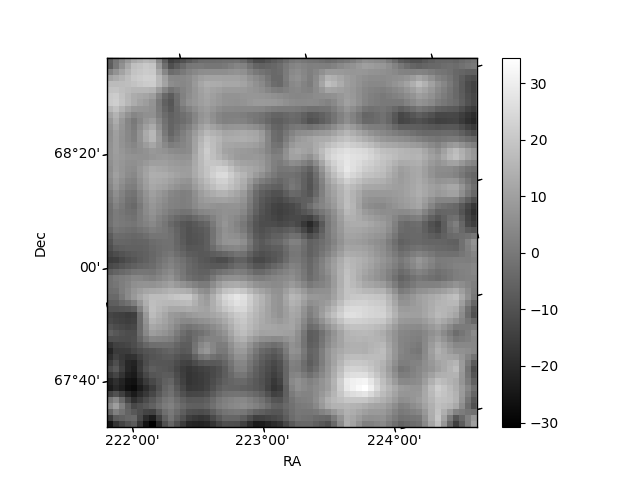
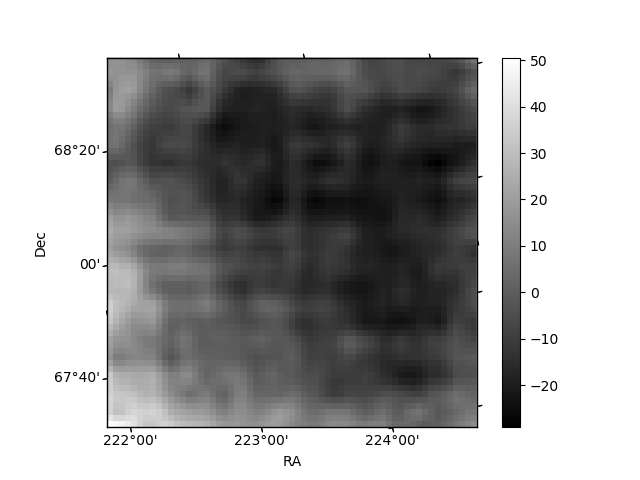
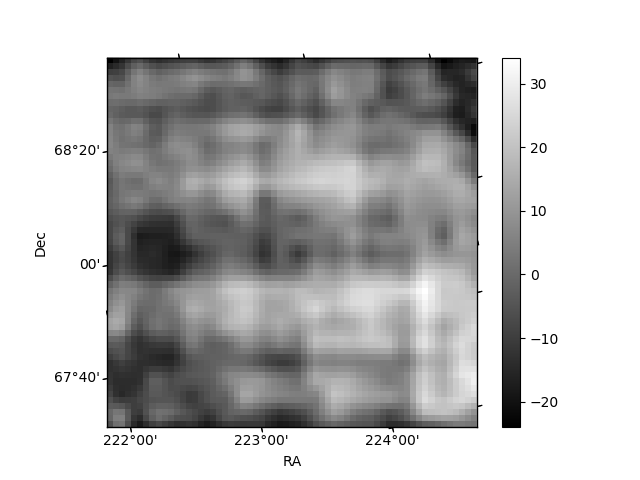
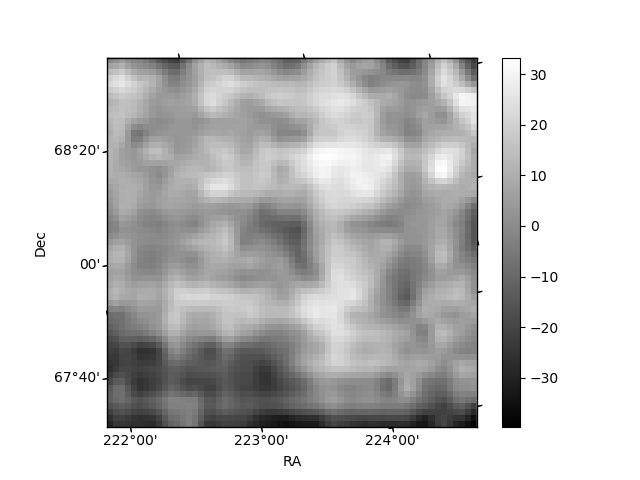
Histogram calculated using DETX and DETY for each event in the final _common_clean file
| Quadrant A | 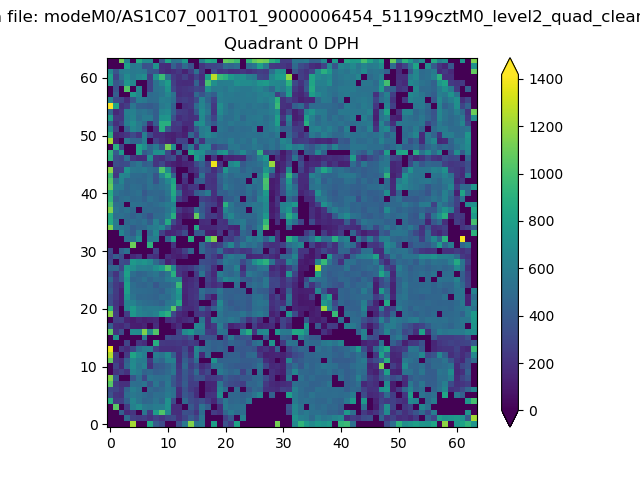 |
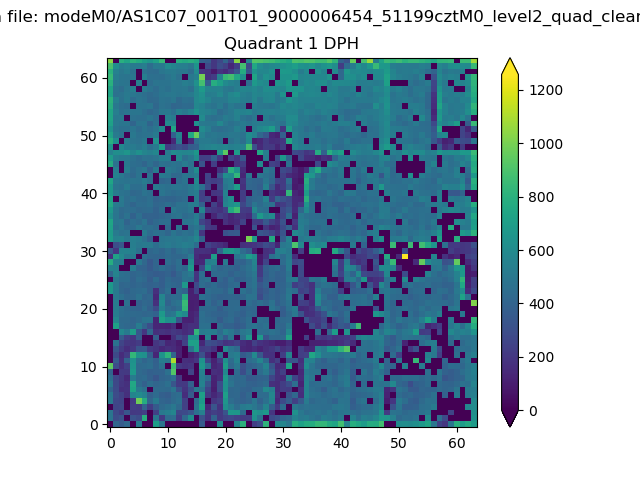 |
Quadrant B |
|---|---|---|---|
| Quadrant D | 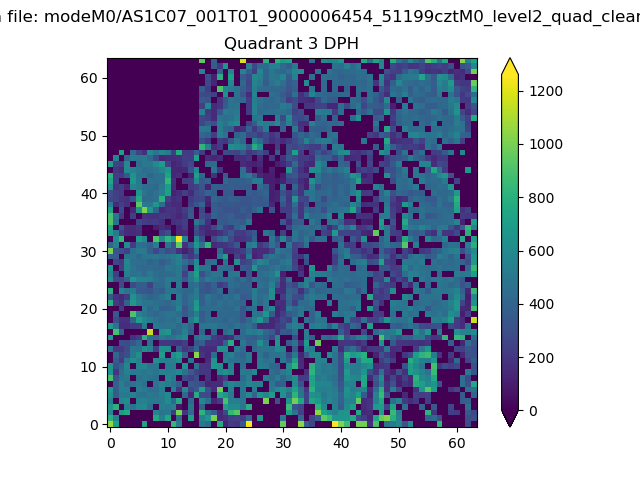 |
 |
Quadrant C |
| Plot type | Count rate plots | Images |
|---|---|---|
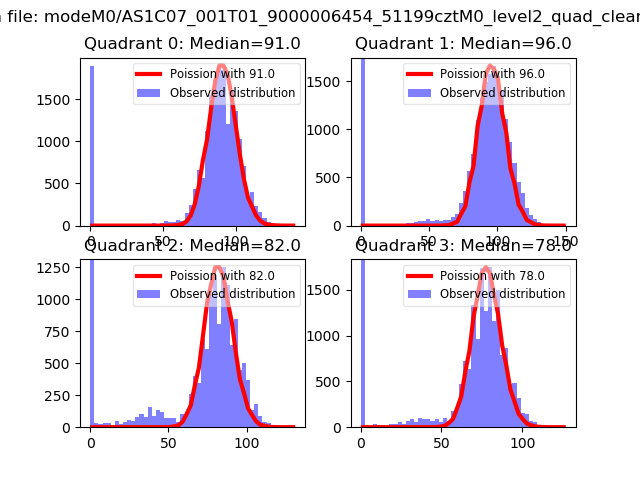
| Comparison with Poisson distribution Blue bars denote a histogram of data divided into 1 sec bins. Red curve is a Poisson curve with rate = median count rate of data. |
 |
 |
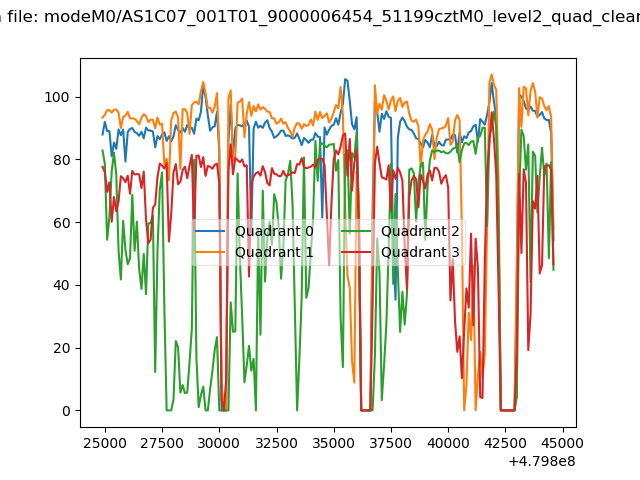
| Quadrant-wise count rates Data is divided into 100 sec bins |
 |
|
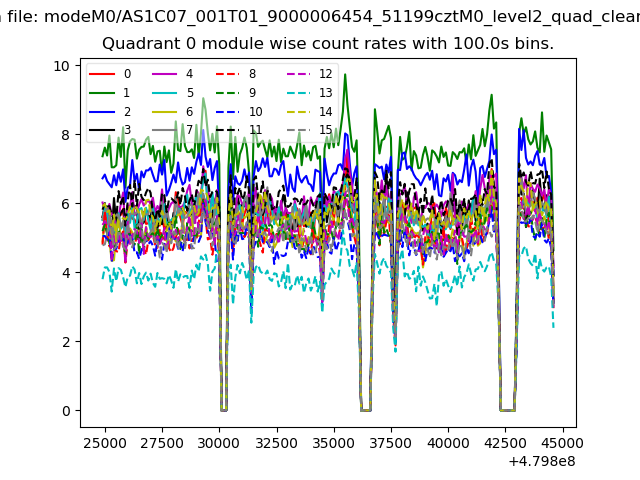
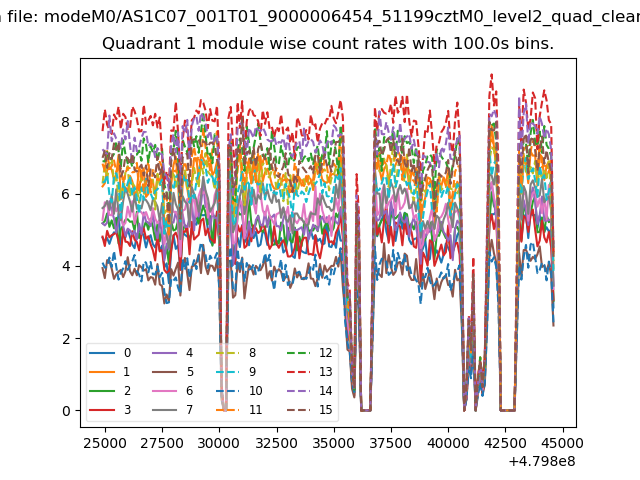
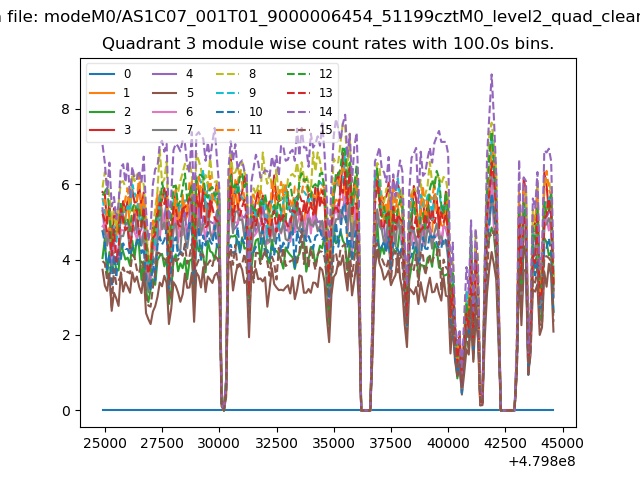
| Module-wise count rates for Quadrant A Data is divided into 100 sec bins |
 |
 |
| Module-wise count rates for Quadrant B Data is divided into 100 sec bins |
 |
 |
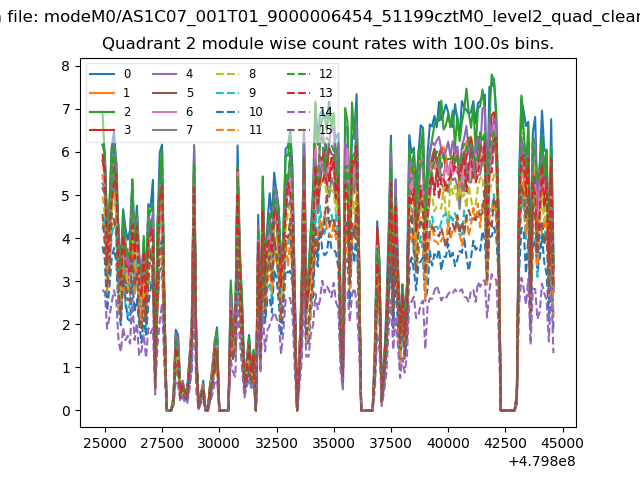
| Module-wise count rates for Quadrant C Data is divided into 100 sec bins |
 |
 |
| Module-wise count rates for Quadrant D Data is divided into 100 sec bins |
 |
 |
| Parameter | Plot |
|---|---|
| CZT HV Monitor | 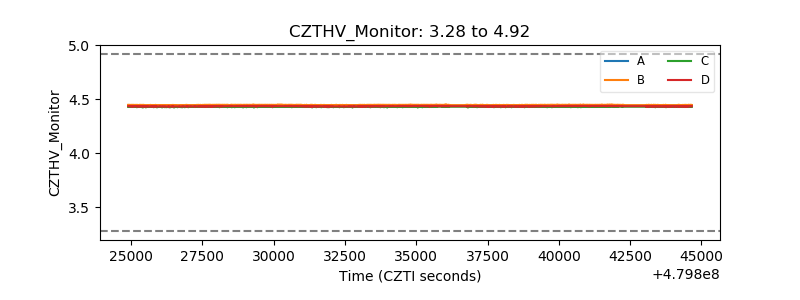 |
| D_VDD | 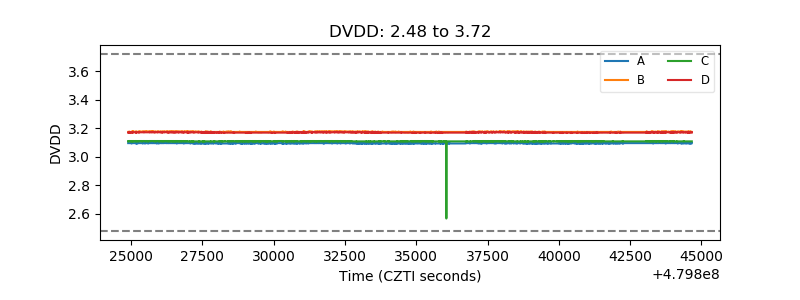 |
| Temperature 1 | 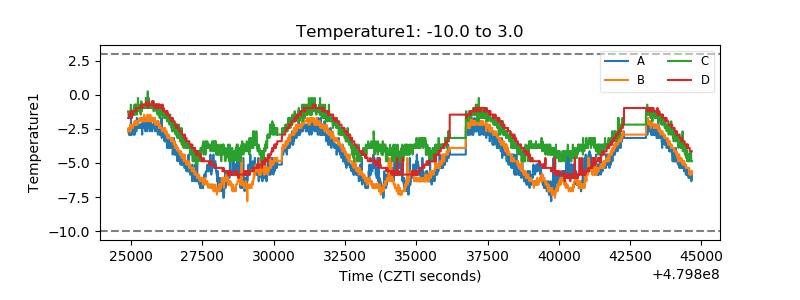 |
| Veto HV Monitor | 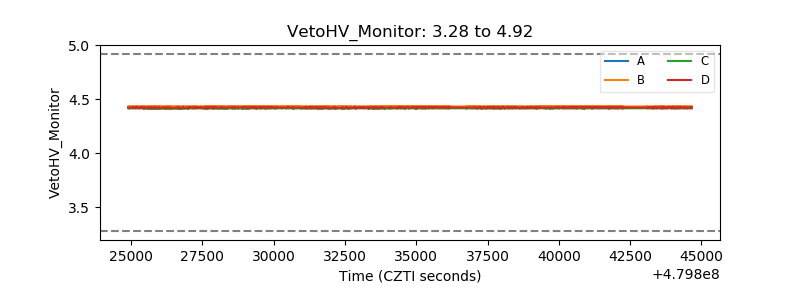 |
| Veto LLD | 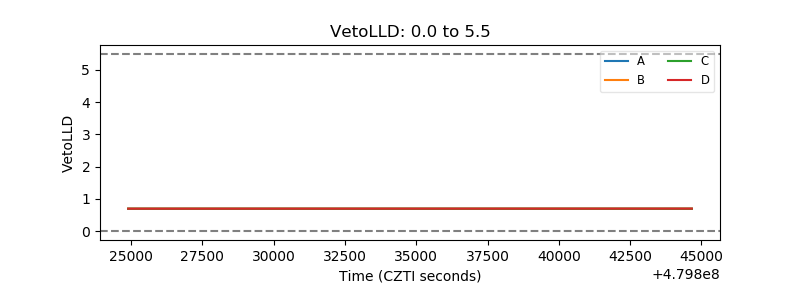 |
| Alpha Counter | 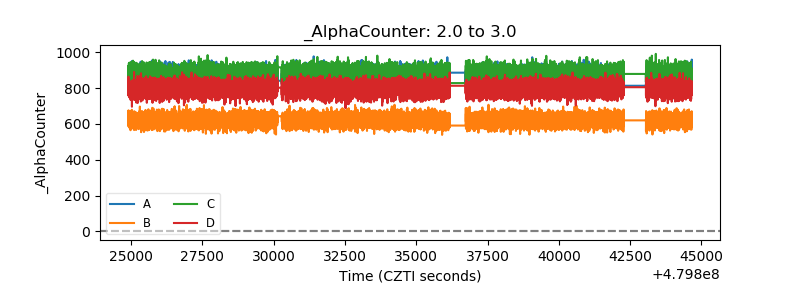 |
| _CPM_Rate | 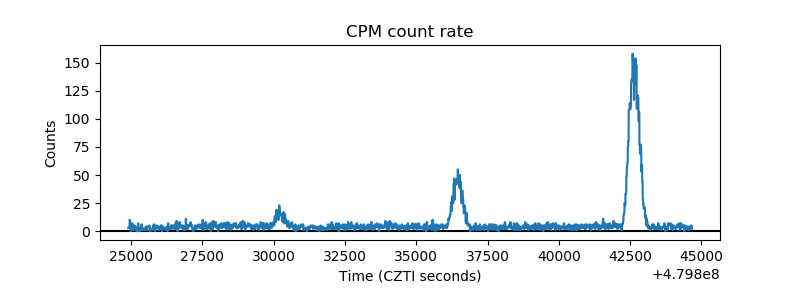 |
| CZT Counter | 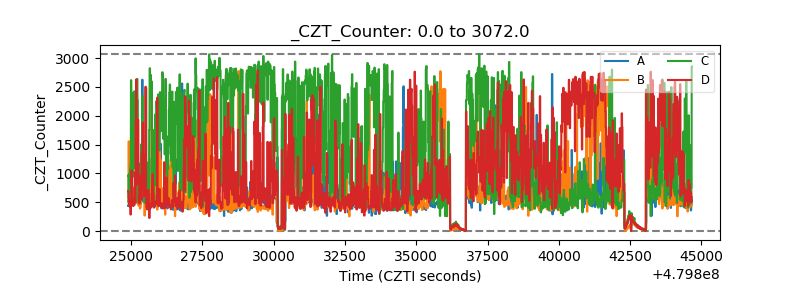 |
| +2.5 Volts monitor | 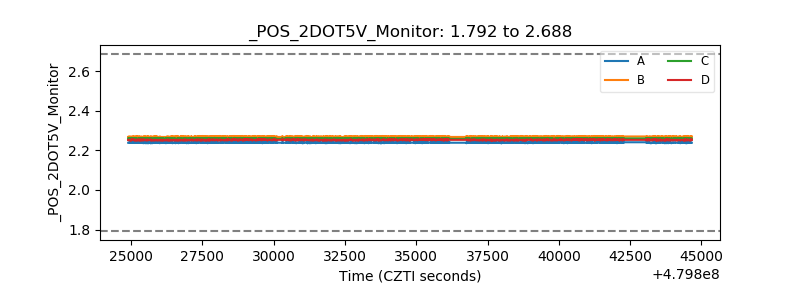 |
| +5 Volts monitor | 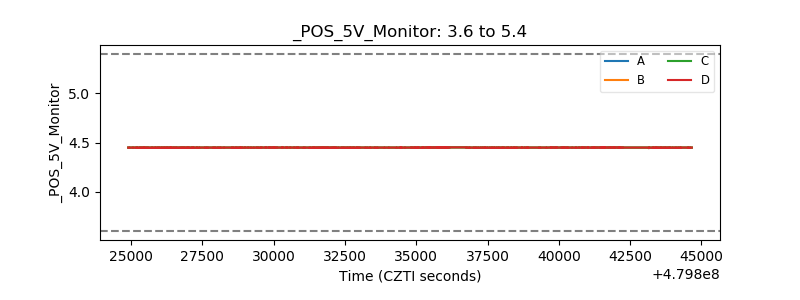 |
| _ROLL_ROT | 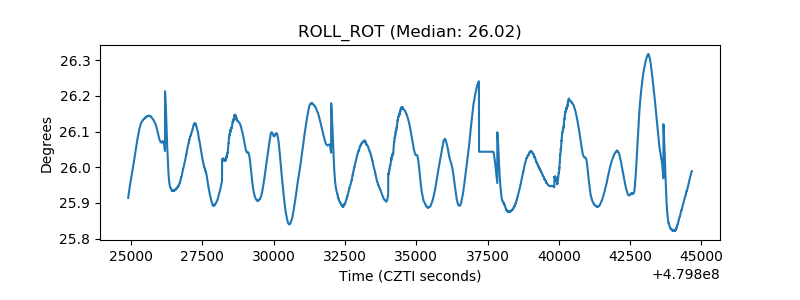 |
| _Roll_DEC | 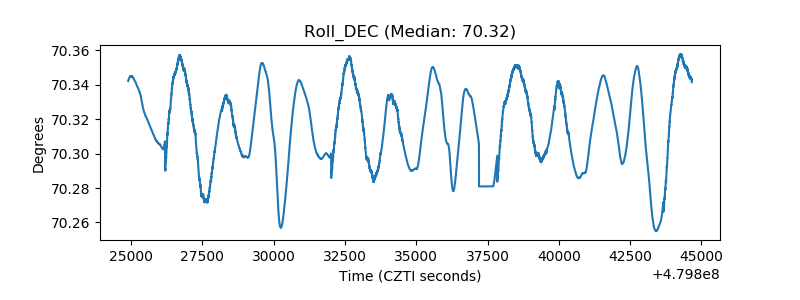 |
| _Roll_RA | 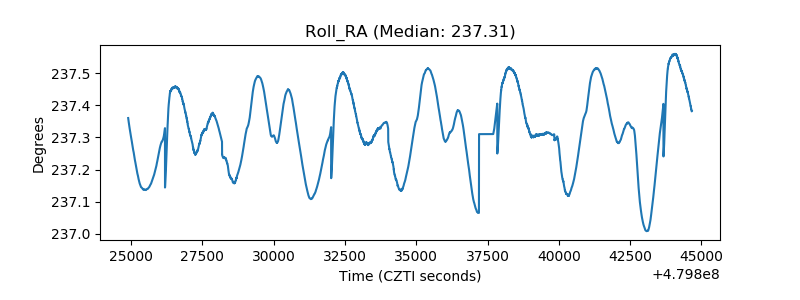 |
| Veto Counter | 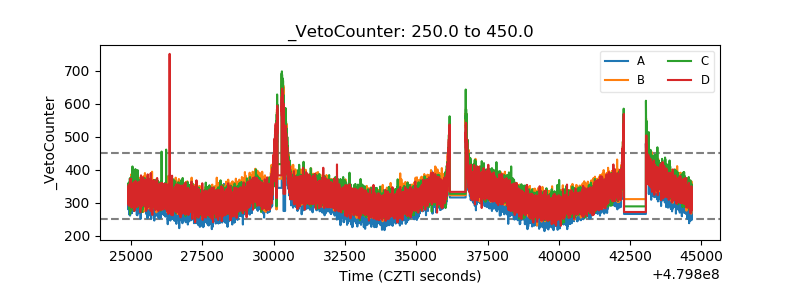 |