| Param | Original file | Final file |
|---|---|---|
| Filename | modeM0/AS1C07_001T01_9000006454_51200cztM0_level2.fits | modeM0/AS1C07_001T01_9000006454_51200cztM0_level2_quad_clean.evt |
| Size (bytes) | 659,738,880 | 92,684,160 |
| Size | 629.2 MB | 88.4 MB |
| Events in quadrant A | 4,615,166 | 623,648 |
| Events in quadrant B | 5,369,890 | 641,583 |
| Events in quadrant C | 7,195,950 | 547,438 |
| Events in quadrant D | 6,723,533 | 527,448 |
| Mode M0 | |||
|---|---|---|---|
| Quadrant | BADHDUFLAG | Total packets | Discarded packets |
| A | 0 | 18250 | 2 |
| B | 0 | 20543 | 3 |
| C | 0 | 26070 | 2 |
| D | 0 | 24604 | 2 |
| Mode SS | |||
|---|---|---|---|
| Quadrant | BADHDUFLAG | Total packets | Discarded packets |
| A | 0 | 136 | 0 |
| B | 0 | 136 | 0 |
| C | 0 | 136 | 0 |
| D | 0 | 136 | 0 |
| Mode M9 | |||
|---|---|---|---|
| Quadrant | BADHDUFLAG | Total packets | Discarded packets |
| A | 0 | 14 | 0 |
| B | 0 | 15 | 0 |
| C | 0 | 15 | 0 |
| D | 0 | 15 | 0 |
| Quadrant | Total seconds | Saturated seconds | Saturation percentage |
|---|---|---|---|
| A | 6684 | 79 | 1.181927% |
| B | 6683 | 519 | 7.765973% |
| C | 6683 | 947 | 14.170283% |
| D | 6683 | 683 | 10.219961% |
Noise dominated data is calculated using 1-second bins in cleaned event files. If a bin has >2000 counts, and if more than 50% of those come from <1% of pixels, then it is considered to be noise-dominated and hence unusable.
| Quadrant | # 1 sec bins | Bins with >0 counts | Bins with >2000 counts | High rate bins dominated by noise | Noise dominated (total time) | Noise dominated (detector-on time) | Marked lightcurve |
|---|---|---|---|---|---|---|---|
| A | 7609 | 6685 | 42 | 42 | 0.55% | 0.63% | 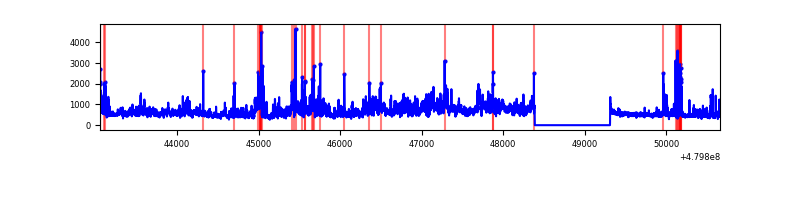 |
| B | 7608 | 6684 | 328 | 328 | 4.31% | 4.91% | 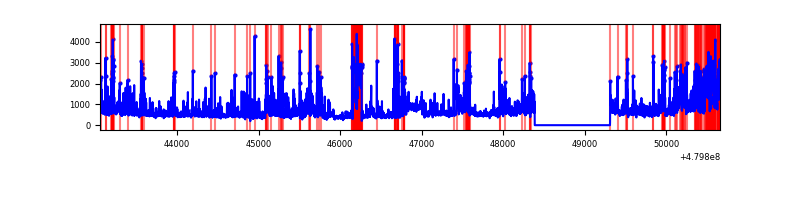 |
| C | 7608 | 6684 | 810 | 810 | 10.65% | 12.12% | 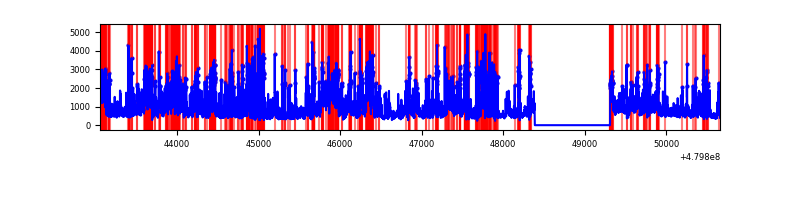 |
| D | 7608 | 6684 | 514 | 514 | 6.76% | 7.69% | 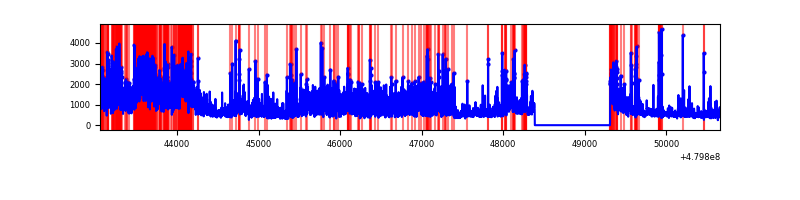 |
Top three noisy pixels from each quadrant. If the there are fewer than three noisy pixels in the level2.evt file, extra rows are filled as -1
| Pixel properties | Quadrant properties | ||||||
|---|---|---|---|---|---|---|---|
| Quadrant | DetID | PixID | Counts | Sigma | Mean | Median | Sigma |
| A | 12 | 3 | 1047268 | 6015.34 | 706 | 689 | 174.0 |
| A | 9 | 160 | 148924 | 852.0 | 706 | 689 | 174.0 |
| A | 13 | 248 | 143853 | 822.85 | 706 | 689 | 174.0 |
| B | 5 | 172 | 822575 | 5552.01 | 688 | 663 | 148.0 |
| B | 8 | 128 | 372108 | 2509.11 | 688 | 663 | 148.0 |
| B | 10 | 254 | 355221 | 2395.04 | 688 | 663 | 148.0 |
| C | 4 | 12 | 1462172 | 8133.53 | 653 | 648 | 179.7 |
| C | 15 | 253 | 1166372 | 6487.37 | 653 | 648 | 179.7 |
| C | 1 | 60 | 403985 | 2244.61 | 653 | 648 | 179.7 |
| D | 2 | 62 | 1985664 | 10596.63 | 662 | 638 | 187.3 |
| D | 15 | 94 | 703037 | 3749.6 | 662 | 638 | 187.3 |
| D | 8 | 176 | 270414 | 1440.14 | 662 | 638 | 187.3 |
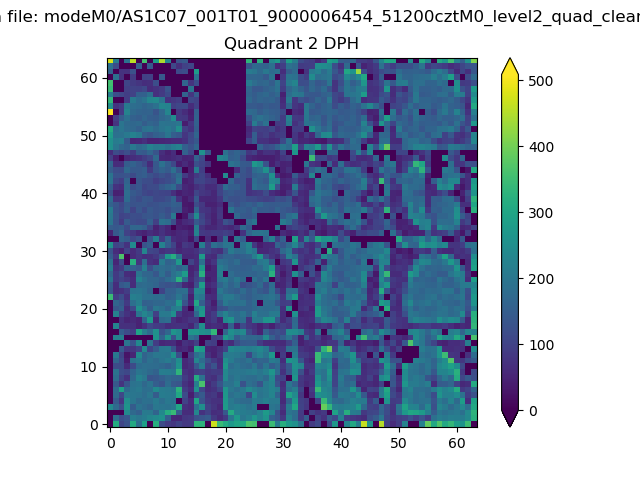
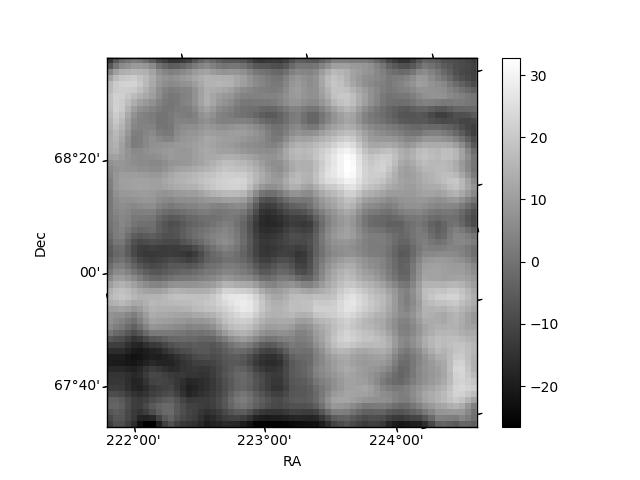
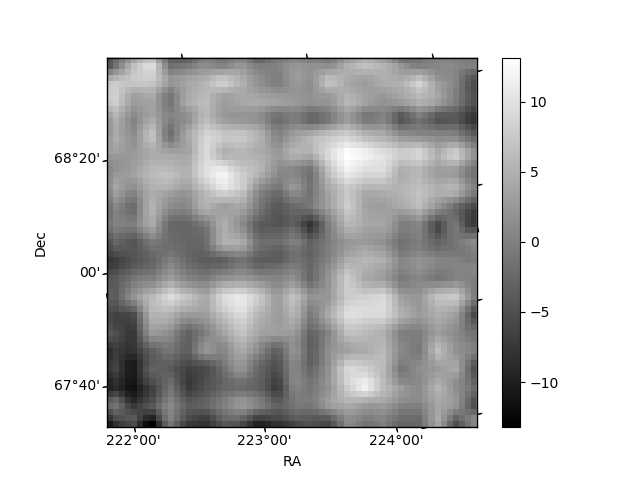
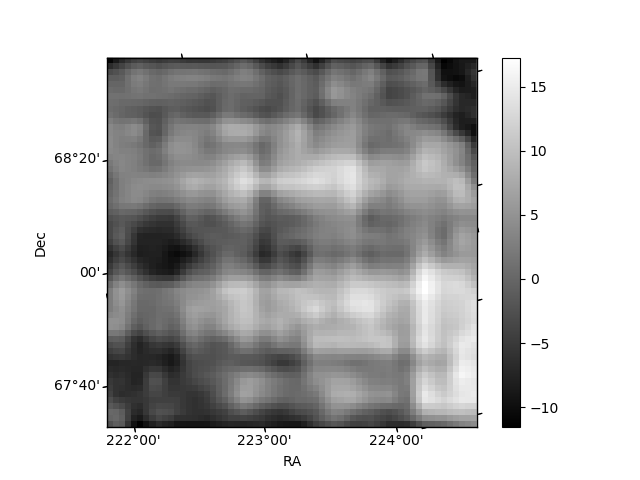
Histogram calculated using DETX and DETY for each event in the final _common_clean file
| Quadrant A | 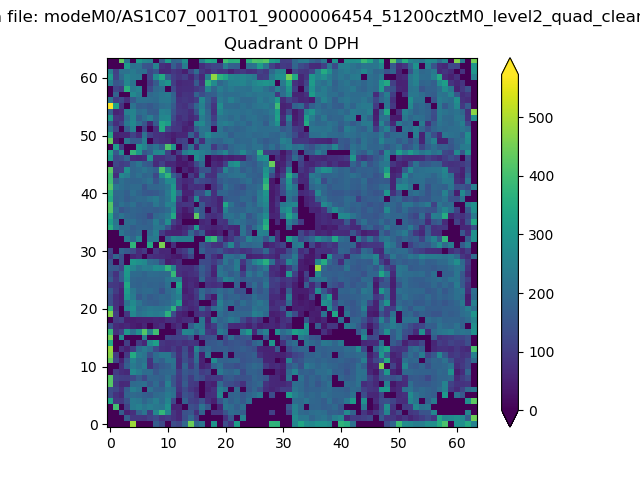 |
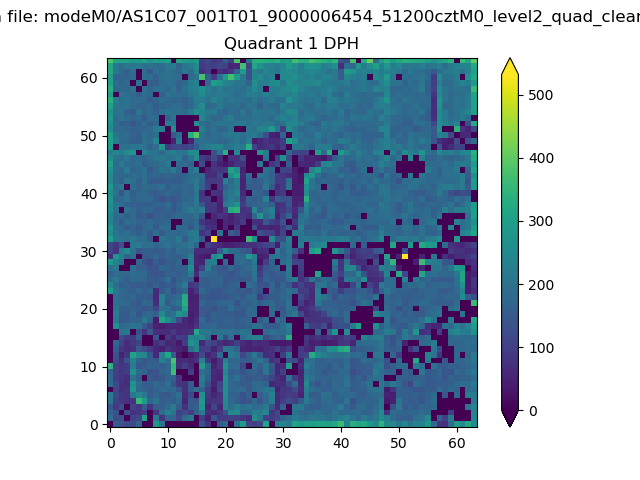 |
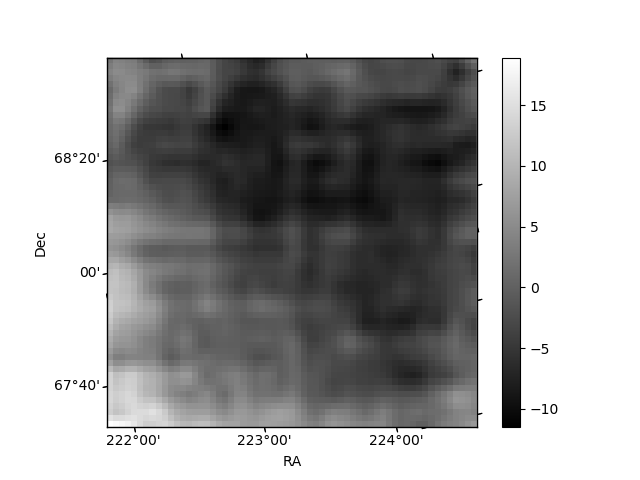
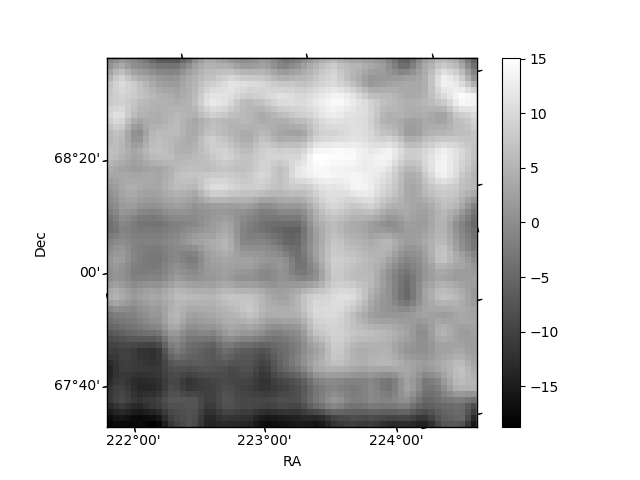
Quadrant B |
|---|---|---|---|
| Quadrant D | 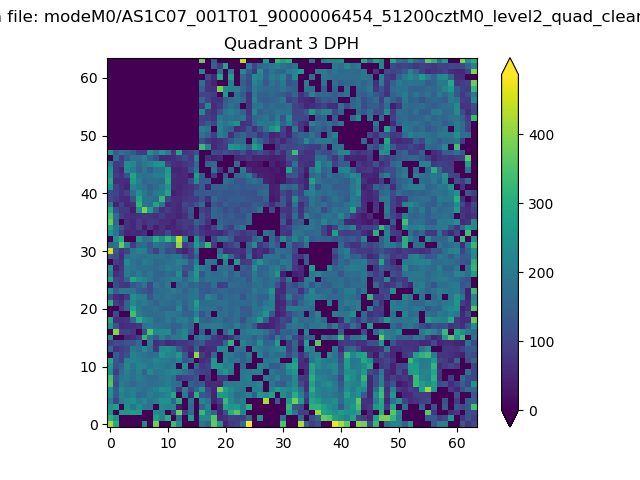 |
 |
Quadrant C |
| Plot type | Count rate plots | Images |
|---|---|---|
| Comparison with Poisson distribution Blue bars denote a histogram of data divided into 1 sec bins. Red curve is a Poisson curve with rate = median count rate of data. |
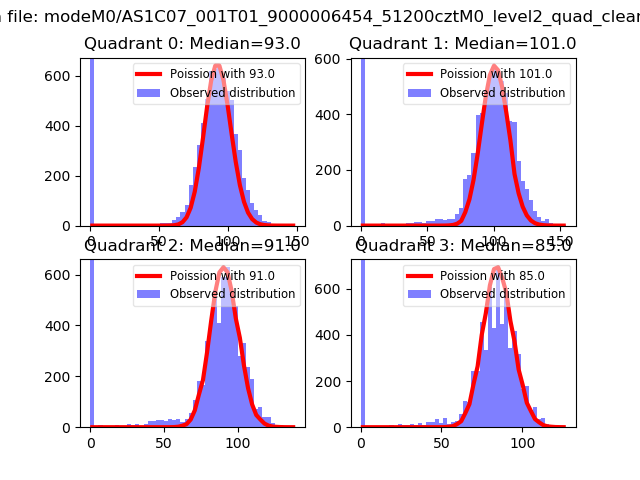 |
 |
| Quadrant-wise count rates Data is divided into 100 sec bins |
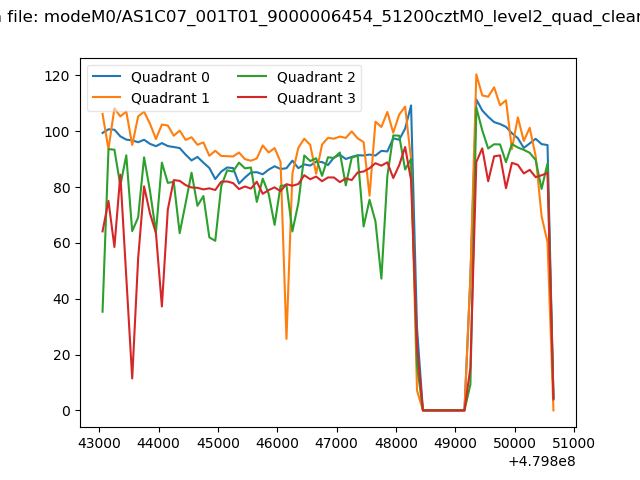 |
|
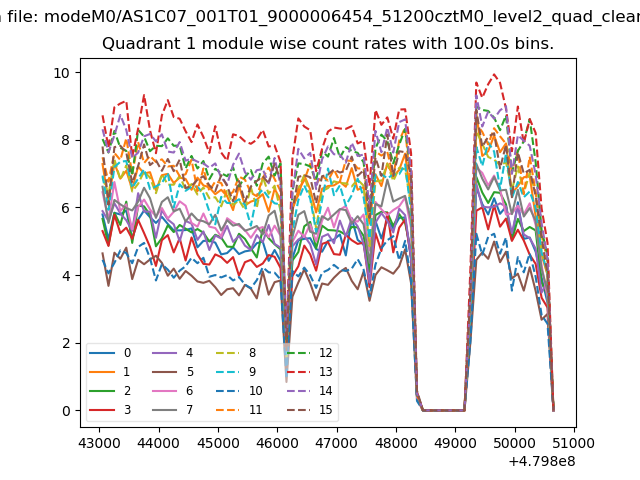
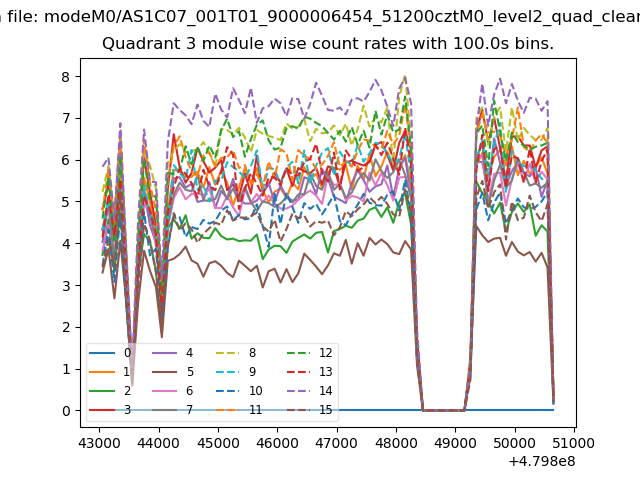
| Module-wise count rates for Quadrant A Data is divided into 100 sec bins |
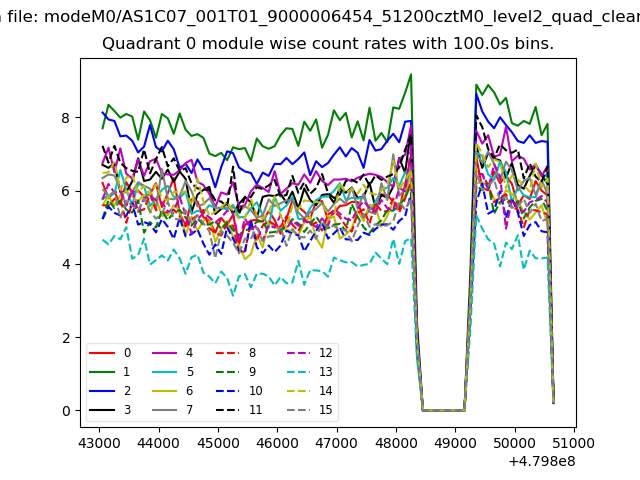 |
 |
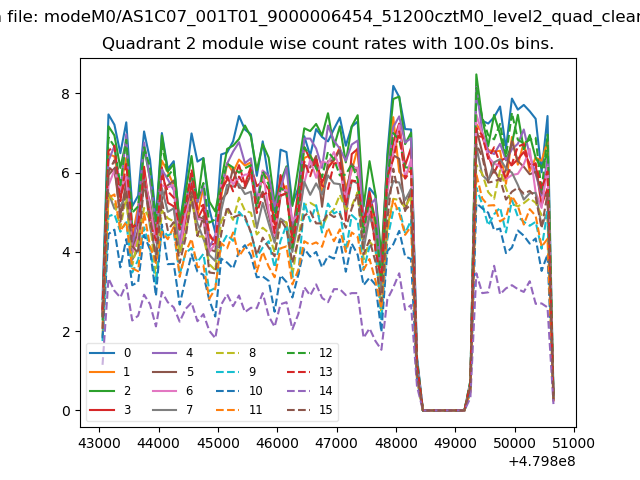
| Module-wise count rates for Quadrant B Data is divided into 100 sec bins |
 |
 |
| Module-wise count rates for Quadrant C Data is divided into 100 sec bins |
 |
 |
| Module-wise count rates for Quadrant D Data is divided into 100 sec bins |
 |
 |
| Parameter | Plot |
|---|---|
| CZT HV Monitor | 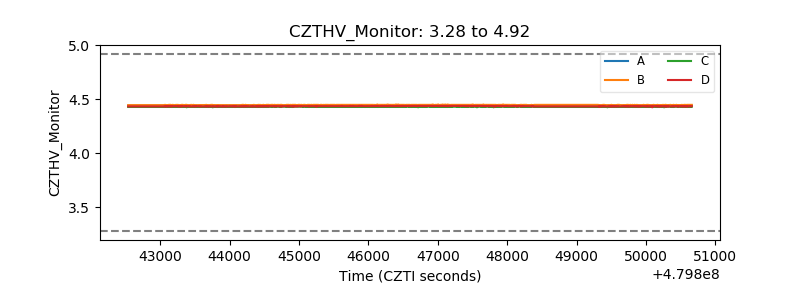 |
| D_VDD | 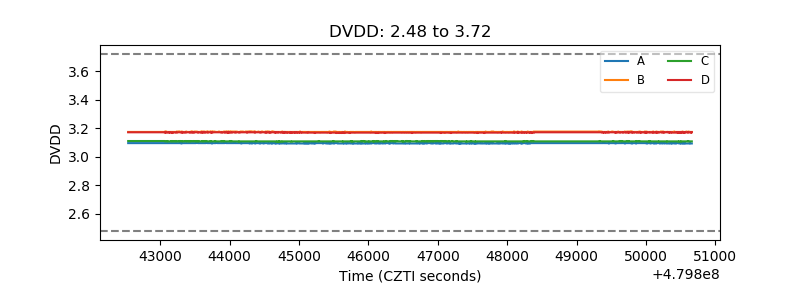 |
| Temperature 1 | 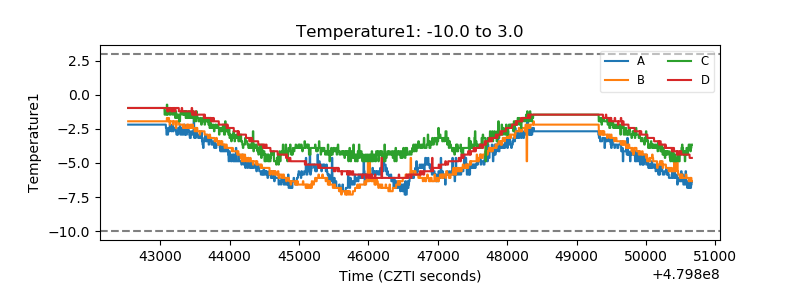 |
| Veto HV Monitor | 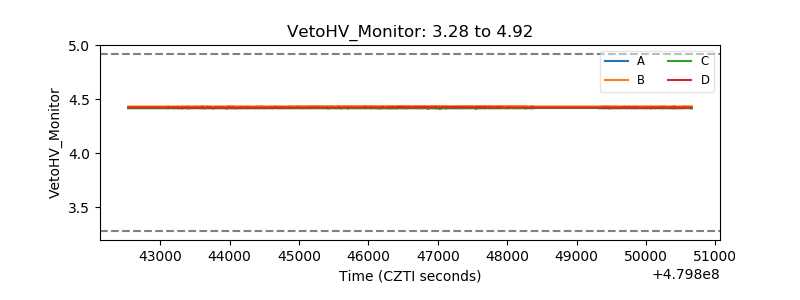 |
| Veto LLD |  |
| Alpha Counter | 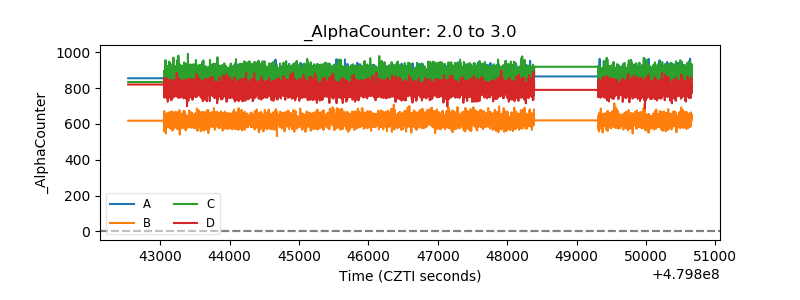 |
| _CPM_Rate | 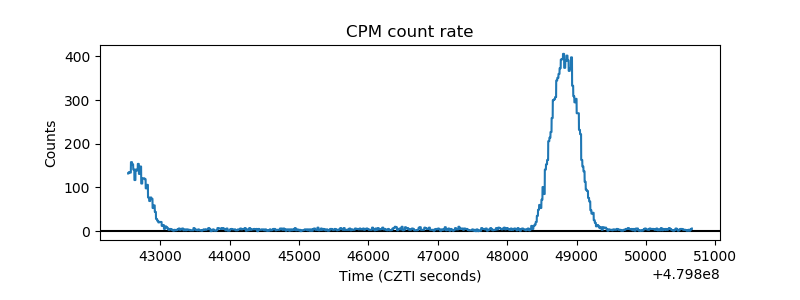 |
| CZT Counter | 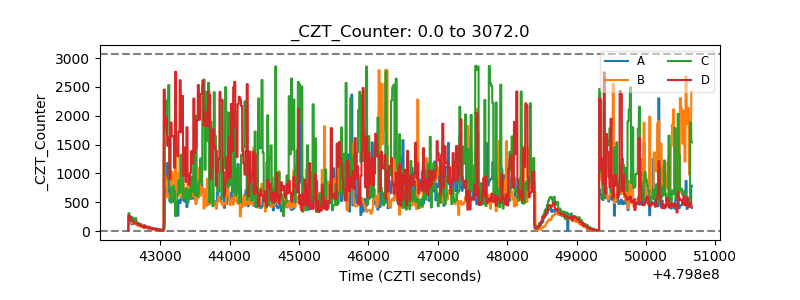 |
| +2.5 Volts monitor | 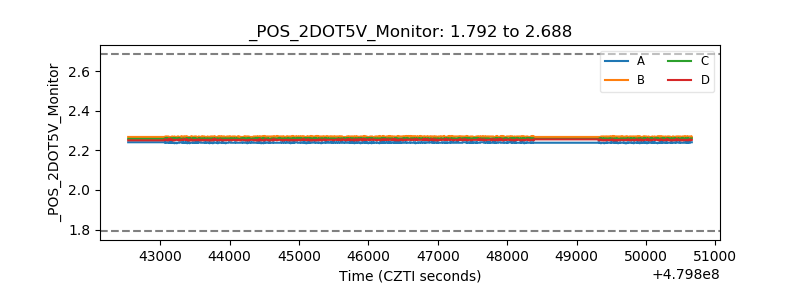 |
| +5 Volts monitor | 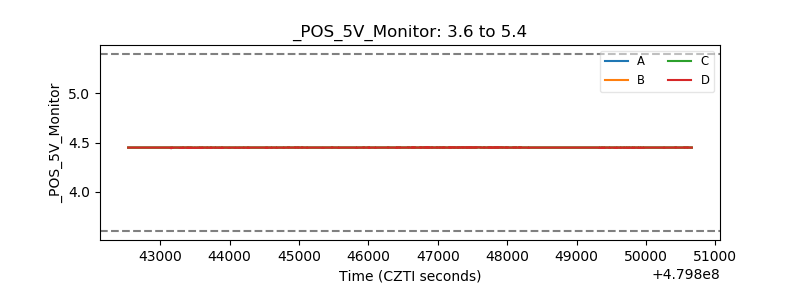 |
| _ROLL_ROT | 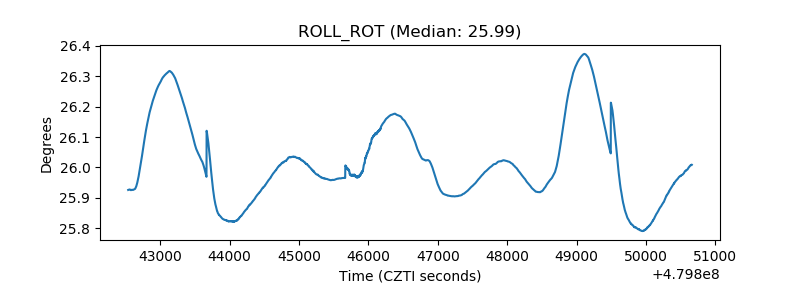 |
| _Roll_DEC | 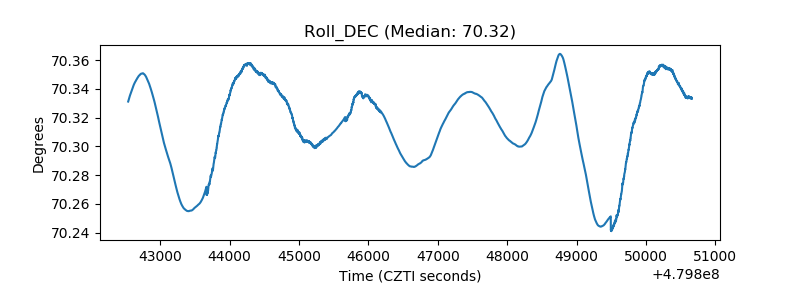 |
| _Roll_RA | 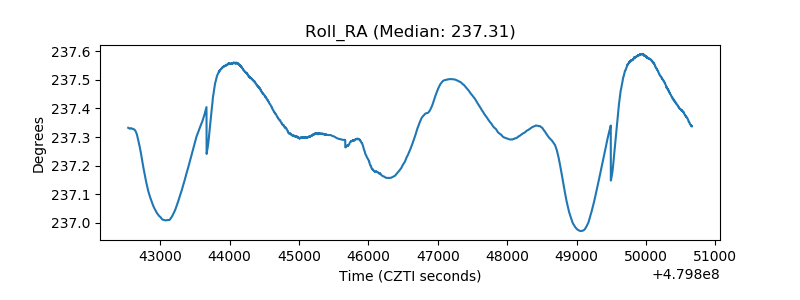 |
| Veto Counter | 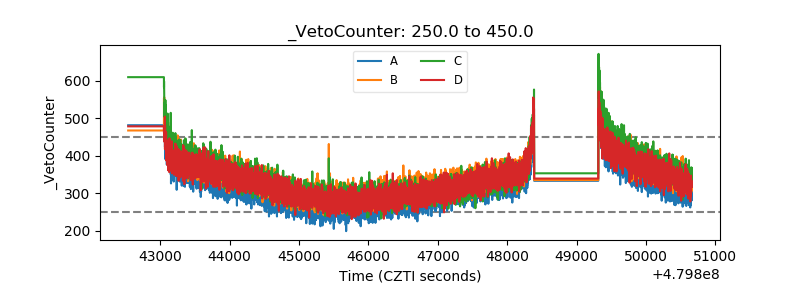 |