| Param | Original file | Final file |
|---|---|---|
| Filename | modeM0/AS1C07_001T01_9000006454_51202cztM0_level2.fits | modeM0/AS1C07_001T01_9000006454_51202cztM0_level2_quad_clean.evt |
| Size (bytes) | 681,160,320 | 91,955,520 |
| Size | 649.6 MB | 87.7 MB |
| Events in quadrant A | 4,235,109 | 630,116 |
| Events in quadrant B | 7,394,743 | 624,275 |
| Events in quadrant C | 8,471,170 | 508,896 |
| Events in quadrant D | 4,600,155 | 557,903 |
| Mode M0 | |||
|---|---|---|---|
| Quadrant | BADHDUFLAG | Total packets | Discarded packets |
| A | 0 | 17103 | 4 |
| B | 0 | 26666 | 2 |
| C | 0 | 29814 | 2 |
| D | 0 | 18335 | 2 |
| Mode SS | |||
|---|---|---|---|
| Quadrant | BADHDUFLAG | Total packets | Discarded packets |
| A | 0 | 138 | 0 |
| B | 0 | 138 | 0 |
| C | 0 | 138 | 0 |
| D | 0 | 138 | 0 |
| Mode M9 | |||
|---|---|---|---|
| Quadrant | BADHDUFLAG | Total packets | Discarded packets |
| A | 0 | 20 | 0 |
| B | 0 | 20 | 0 |
| C | 0 | 20 | 0 |
| D | 0 | 20 | 0 |
| Quadrant | Total seconds | Saturated seconds | Saturation percentage |
|---|---|---|---|
| A | 6634 | 104 | 1.567682% |
| B | 6635 | 955 | 14.393369% |
| C | 6635 | 1442 | 21.733233% |
| D | 6635 | 345 | 5.199699% |
Noise dominated data is calculated using 1-second bins in cleaned event files. If a bin has >2000 counts, and if more than 50% of those come from <1% of pixels, then it is considered to be noise-dominated and hence unusable.
| Quadrant | # 1 sec bins | Bins with >0 counts | Bins with >2000 counts | High rate bins dominated by noise | Noise dominated (total time) | Noise dominated (detector-on time) | Marked lightcurve |
|---|---|---|---|---|---|---|---|
| A | 8609 | 6636 | 65 | 65 | 0.76% | 0.98% | 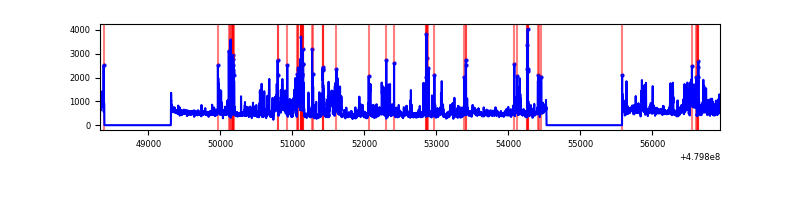 |
| B | 8610 | 6637 | 651 | 651 | 7.56% | 9.81% | 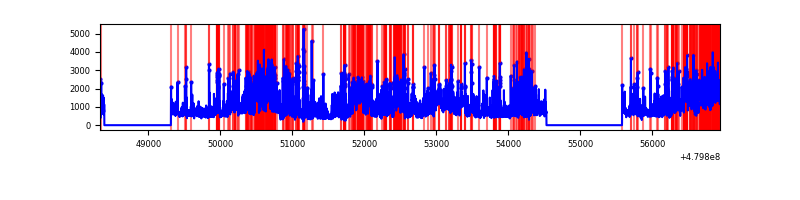 |
| C | 8610 | 6636 | 1283 | 1283 | 14.90% | 19.33% | 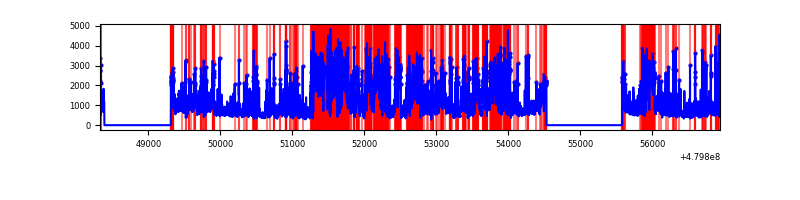 |
| D | 8610 | 6637 | 272 | 272 | 3.16% | 4.10% | 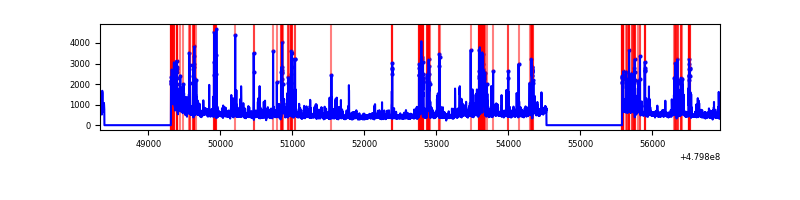 |
Top three noisy pixels from each quadrant. If the there are fewer than three noisy pixels in the level2.evt file, extra rows are filled as -1
| Pixel properties | Quadrant properties | ||||||
|---|---|---|---|---|---|---|---|
| Quadrant | DetID | PixID | Counts | Sigma | Mean | Median | Sigma |
| A | 12 | 3 | 622708 | 3569.59 | 701 | 683 | 174.3 |
| A | 13 | 248 | 198018 | 1132.44 | 701 | 683 | 174.3 |
| A | 9 | 160 | 171847 | 982.25 | 701 | 683 | 174.3 |
| B | 10 | 254 | 1927834 | 13323.53 | 679 | 656 | 144.6 |
| B | 8 | 128 | 1360721 | 9402.8 | 679 | 656 | 144.6 |
| B | 0 | 213 | 452322 | 3122.59 | 679 | 656 | 144.6 |
| C | 4 | 12 | 3419934 | 19846.69 | 634 | 631 | 172.3 |
| C | 15 | 253 | 834085 | 4837.62 | 634 | 631 | 172.3 |
| C | 10 | 171 | 544707 | 3157.98 | 634 | 631 | 172.3 |
| D | 2 | 216 | 521368 | 2708.61 | 670 | 644 | 192.2 |
| D | 2 | 62 | 382757 | 1987.61 | 670 | 644 | 192.2 |
| D | 8 | 176 | 237384 | 1231.43 | 670 | 644 | 192.2 |
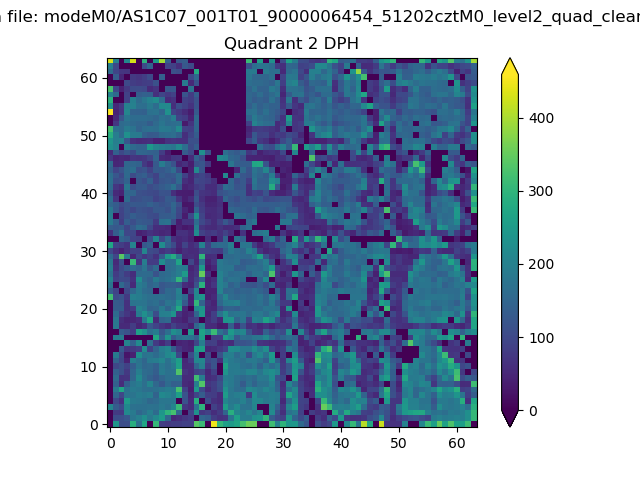
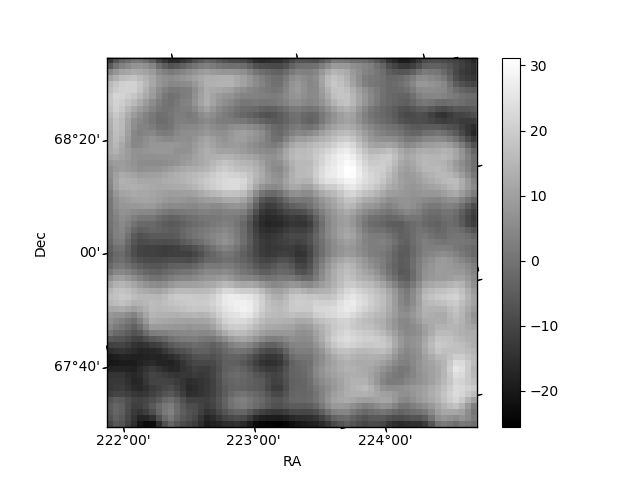
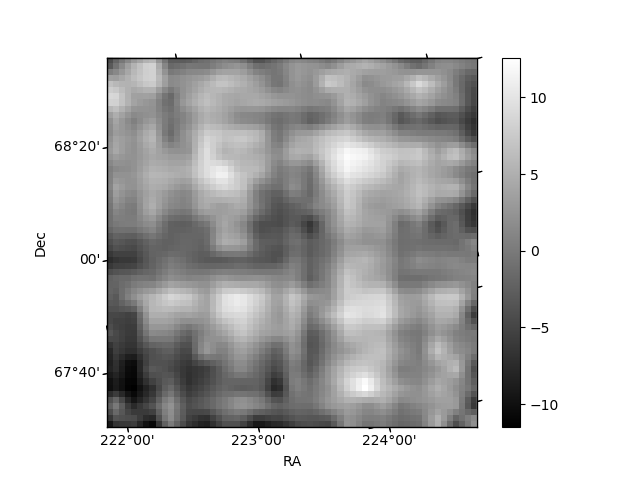
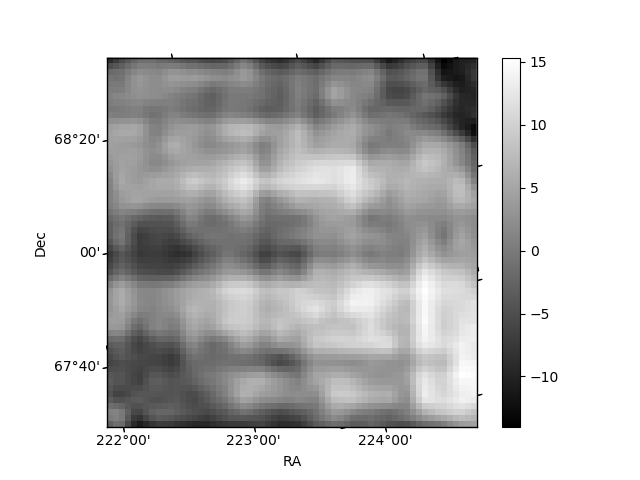
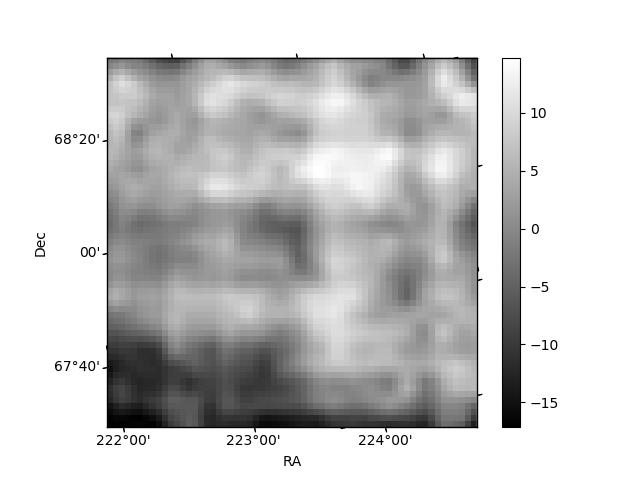
Histogram calculated using DETX and DETY for each event in the final _common_clean file
| Quadrant A | 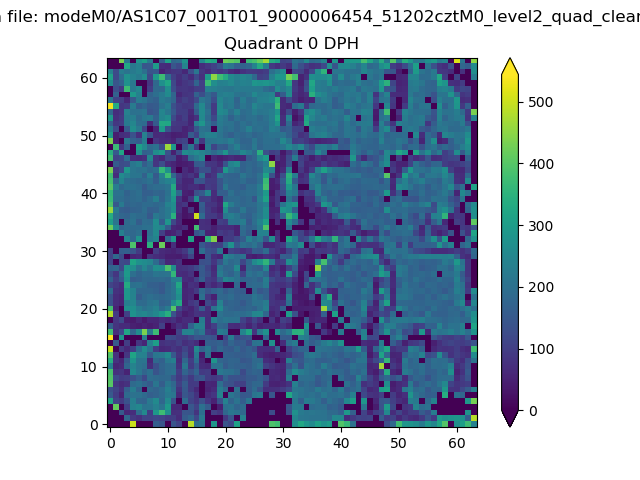 |
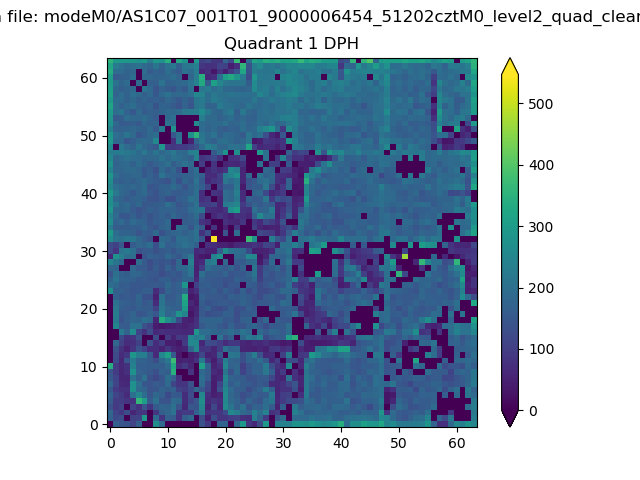 |
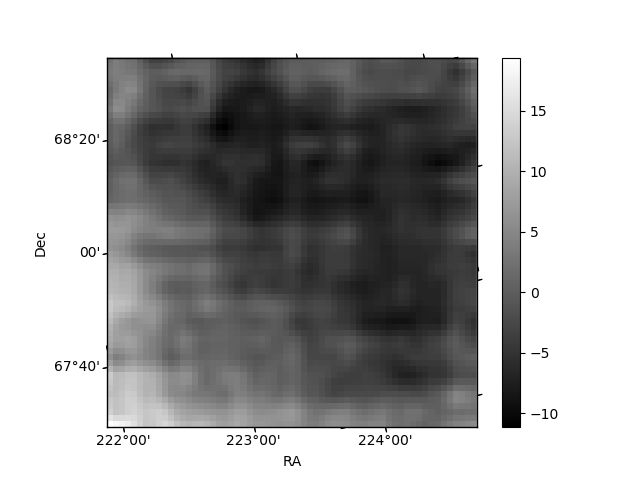
Quadrant B |
|---|---|---|---|
| Quadrant D | 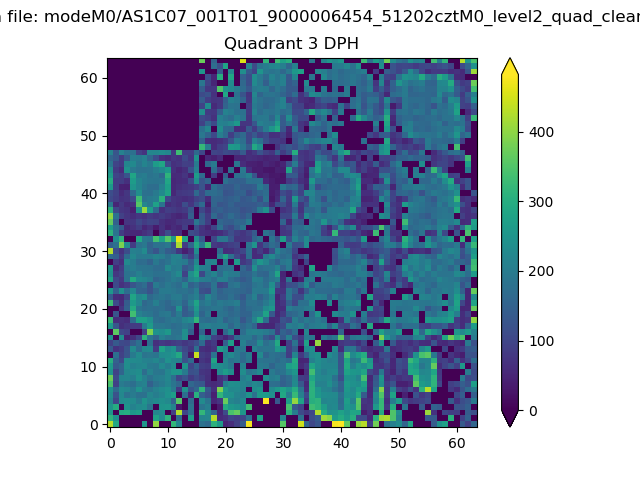 |
 |
Quadrant C |
| Plot type | Count rate plots | Images |
|---|---|---|
| Comparison with Poisson distribution Blue bars denote a histogram of data divided into 1 sec bins. Red curve is a Poisson curve with rate = median count rate of data. |
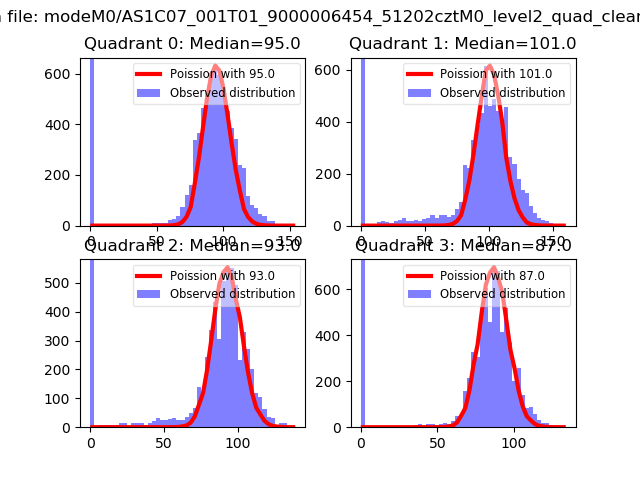 |
 |
| Quadrant-wise count rates Data is divided into 100 sec bins |
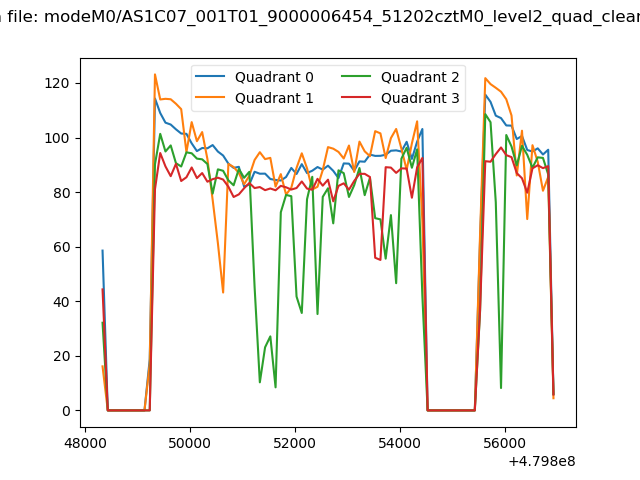 |
|
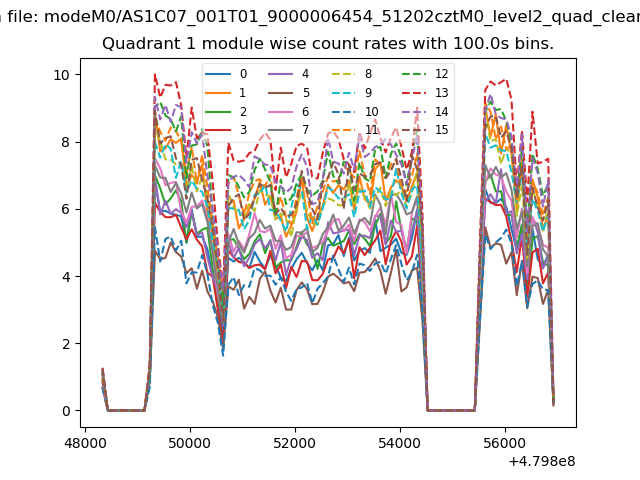
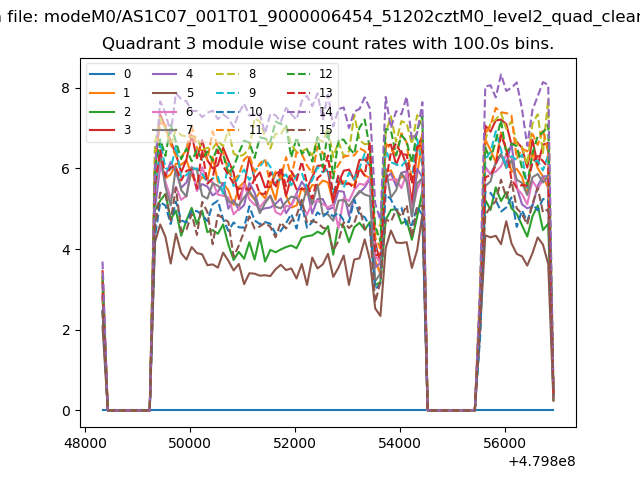
| Module-wise count rates for Quadrant A Data is divided into 100 sec bins |
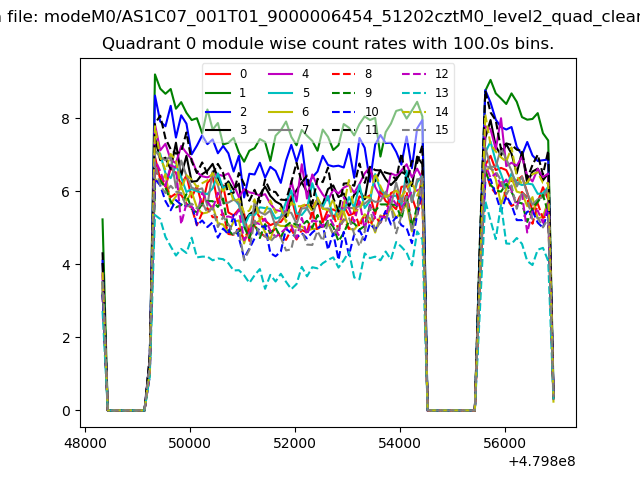 |
 |
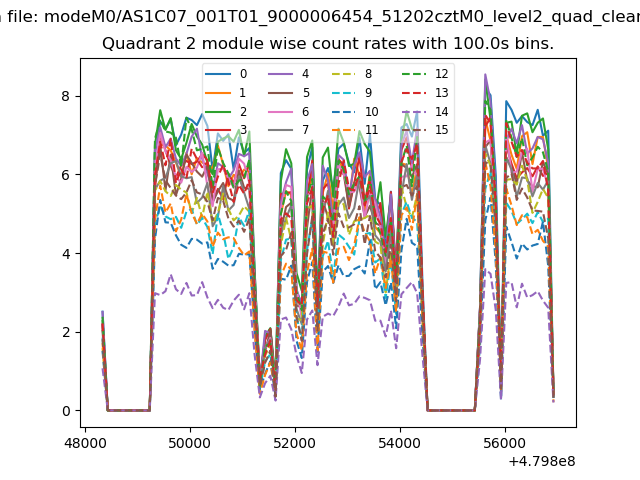
| Module-wise count rates for Quadrant B Data is divided into 100 sec bins |
 |
 |
| Module-wise count rates for Quadrant C Data is divided into 100 sec bins |
 |
 |
| Module-wise count rates for Quadrant D Data is divided into 100 sec bins |
 |
 |
| Parameter | Plot |
|---|---|
| CZT HV Monitor | 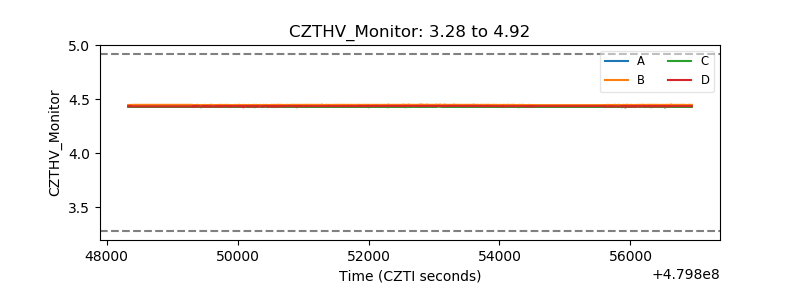 |
| D_VDD | 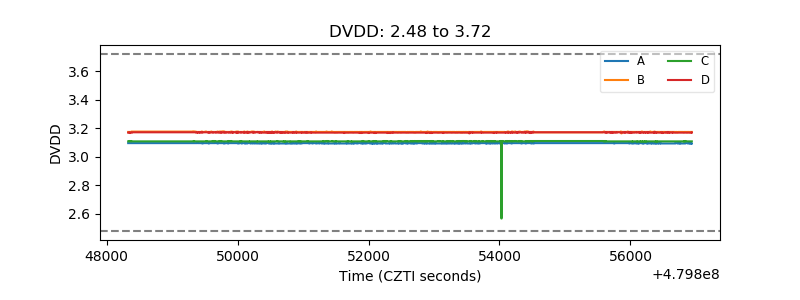 |
| Temperature 1 | 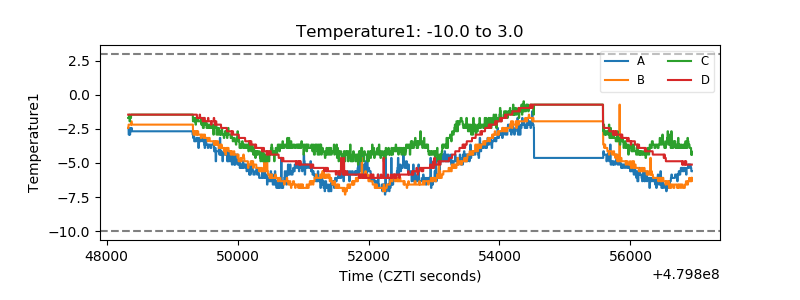 |
| Veto HV Monitor | 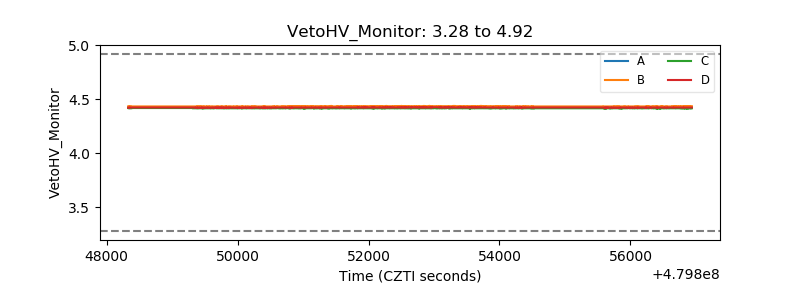 |
| Veto LLD | 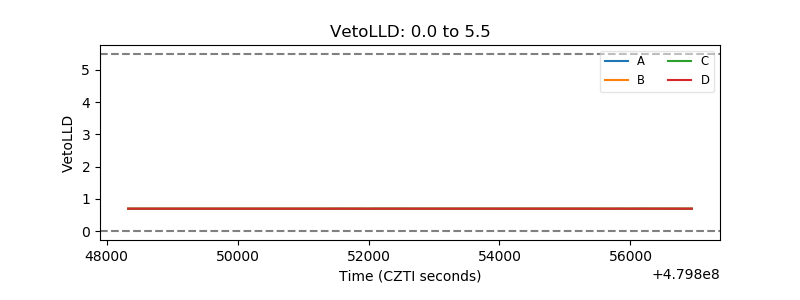 |
| Alpha Counter | 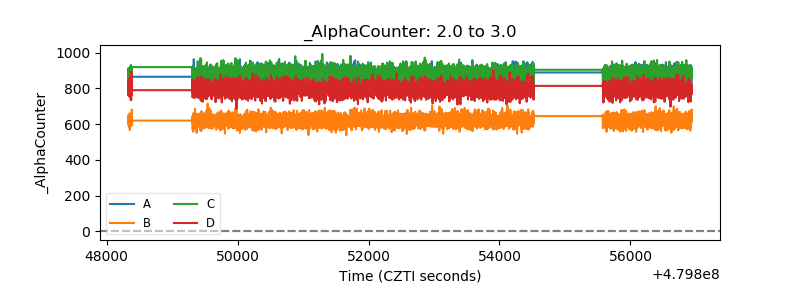 |
| _CPM_Rate | 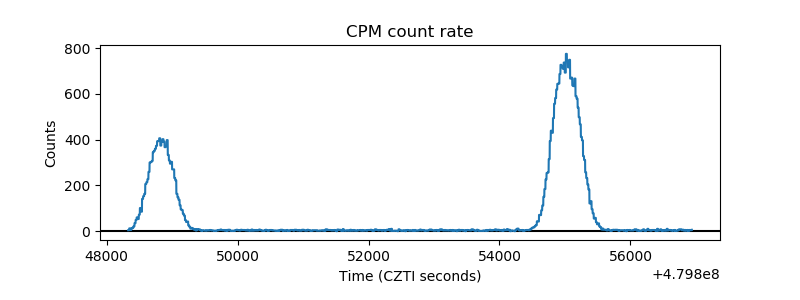 |
| CZT Counter | 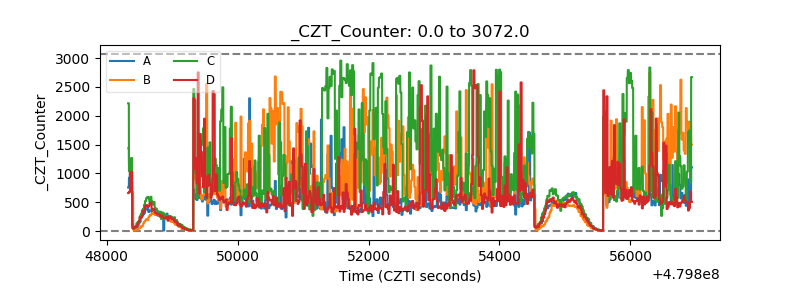 |
| +2.5 Volts monitor | 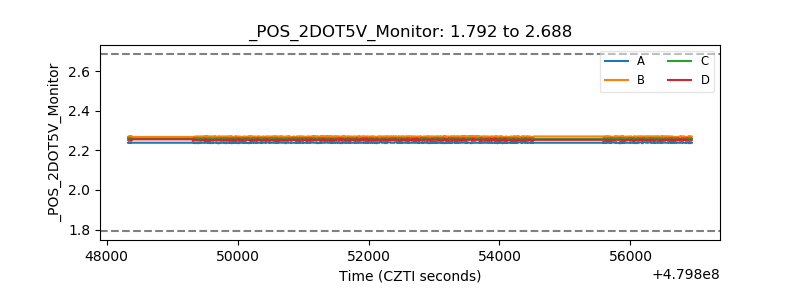 |
| +5 Volts monitor | 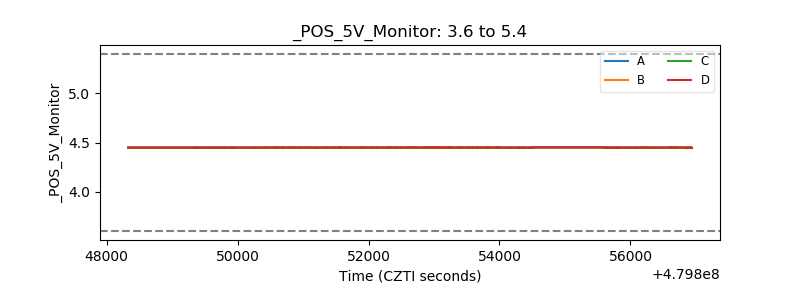 |
| _ROLL_ROT | 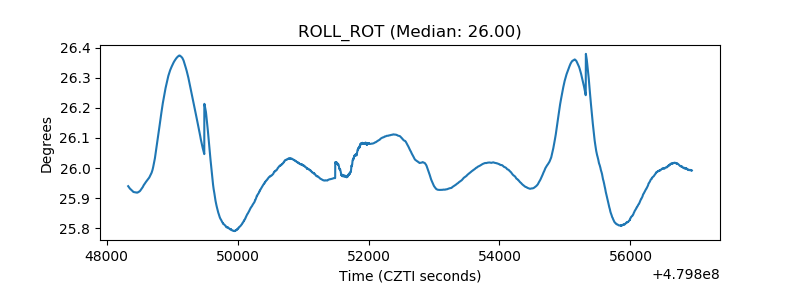 |
| _Roll_DEC | 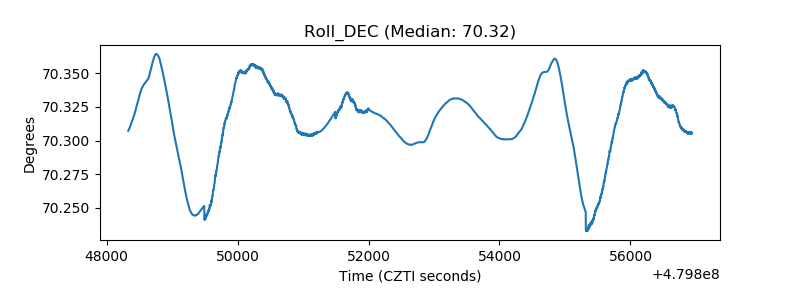 |
| _Roll_RA | 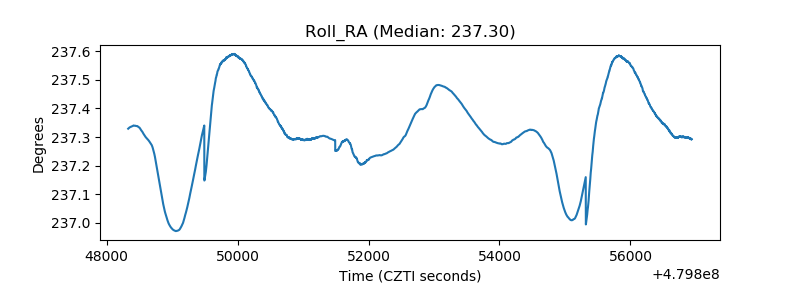 |
| Veto Counter | 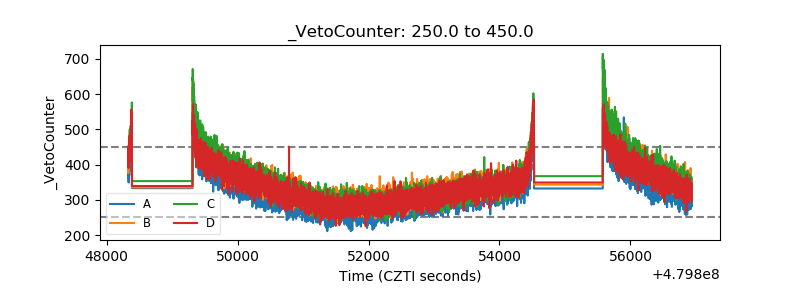 |