| Param | Original file | Final file |
|---|---|---|
| Filename | modeM0/AS1C07_001T01_9000006454_51203cztM0_level2.fits | modeM0/AS1C07_001T01_9000006454_51203cztM0_level2_quad_clean.evt |
| Size (bytes) | 655,122,240 | 90,224,640 |
| Size | 624.8 MB | 86.0 MB |
| Events in quadrant A | 4,722,368 | 609,438 |
| Events in quadrant B | 6,870,471 | 615,266 |
| Events in quadrant C | 7,999,360 | 508,474 |
| Events in quadrant D | 4,166,453 | 554,602 |
| Mode M0 | |||
|---|---|---|---|
| Quadrant | BADHDUFLAG | Total packets | Discarded packets |
| A | 0 | 18493 | 2 |
| B | 0 | 24855 | 2 |
| C | 0 | 28231 | 4 |
| D | 0 | 17057 | 2 |
| Mode SS | |||
|---|---|---|---|
| Quadrant | BADHDUFLAG | Total packets | Discarded packets |
| A | 0 | 130 | 0 |
| B | 0 | 130 | 0 |
| C | 0 | 130 | 0 |
| D | 0 | 130 | 0 |
| Mode M9 | |||
|---|---|---|---|
| Quadrant | BADHDUFLAG | Total packets | Discarded packets |
| A | 0 | 11 | 0 |
| B | 0 | 11 | 0 |
| C | 0 | 11 | 0 |
| D | 0 | 11 | 0 |
| Quadrant | Total seconds | Saturated seconds | Saturation percentage |
|---|---|---|---|
| A | 6359 | 129 | 2.028621% |
| B | 6360 | 880 | 13.836478% |
| C | 6359 | 1319 | 20.742255% |
| D | 6359 | 220 | 3.459663% |
Noise dominated data is calculated using 1-second bins in cleaned event files. If a bin has >2000 counts, and if more than 50% of those come from <1% of pixels, then it is considered to be noise-dominated and hence unusable.
| Quadrant | # 1 sec bins | Bins with >0 counts | Bins with >2000 counts | High rate bins dominated by noise | Noise dominated (total time) | Noise dominated (detector-on time) | Marked lightcurve |
|---|---|---|---|---|---|---|---|
| A | 7504 | 6360 | 70 | 70 | 0.93% | 1.10% | 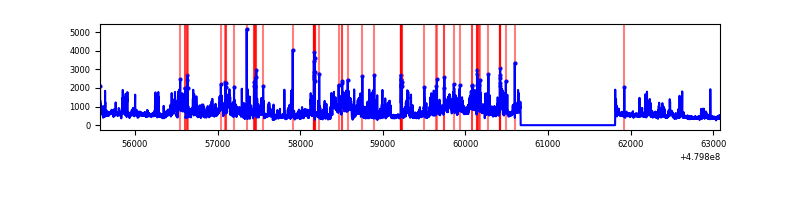 |
| B | 7505 | 6361 | 721 | 721 | 9.61% | 11.33% | 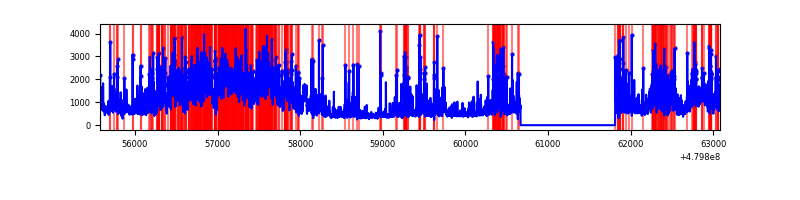 |
| C | 7503 | 6359 | 1189 | 1189 | 15.85% | 18.70% | 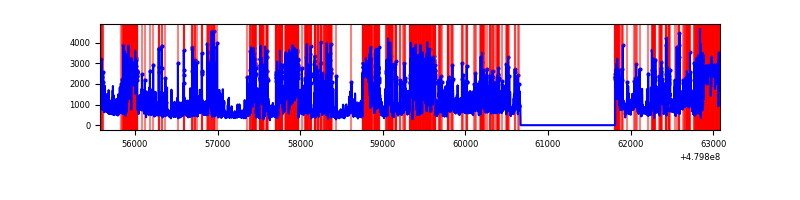 |
| D | 7504 | 6360 | 151 | 151 | 2.01% | 2.37% | 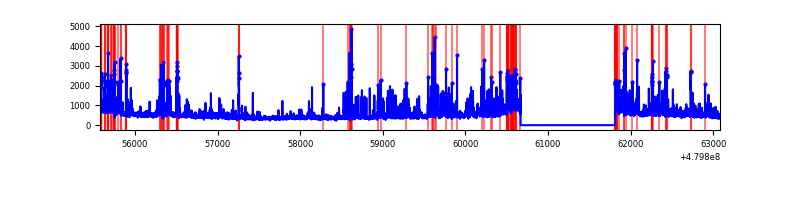 |
Top three noisy pixels from each quadrant. If the there are fewer than three noisy pixels in the level2.evt file, extra rows are filled as -1
| Pixel properties | Quadrant properties | ||||||
|---|---|---|---|---|---|---|---|
| Quadrant | DetID | PixID | Counts | Sigma | Mean | Median | Sigma |
| A | 12 | 3 | 1106616 | 6651.91 | 666 | 648 | 166.3 |
| A | 9 | 160 | 170699 | 1022.78 | 666 | 648 | 166.3 |
| A | 12 | 194 | 128432 | 768.56 | 666 | 648 | 166.3 |
| B | 10 | 254 | 1869132 | 13638.04 | 649 | 628 | 137.0 |
| B | 8 | 128 | 757004 | 5520.72 | 649 | 628 | 137.0 |
| B | 0 | 213 | 547755 | 3993.43 | 649 | 628 | 137.0 |
| C | 4 | 12 | 2871824 | 16983.93 | 607 | 599 | 169.1 |
| C | 10 | 171 | 890686 | 5265.06 | 607 | 599 | 169.1 |
| C | 1 | 60 | 515237 | 3044.2 | 607 | 599 | 169.1 |
| D | 3 | 12 | 464191 | 2527.58 | 641 | 617 | 183.4 |
| D | 10 | 172 | 250771 | 1363.93 | 641 | 617 | 183.4 |
| D | 2 | 62 | 211394 | 1149.23 | 641 | 617 | 183.4 |
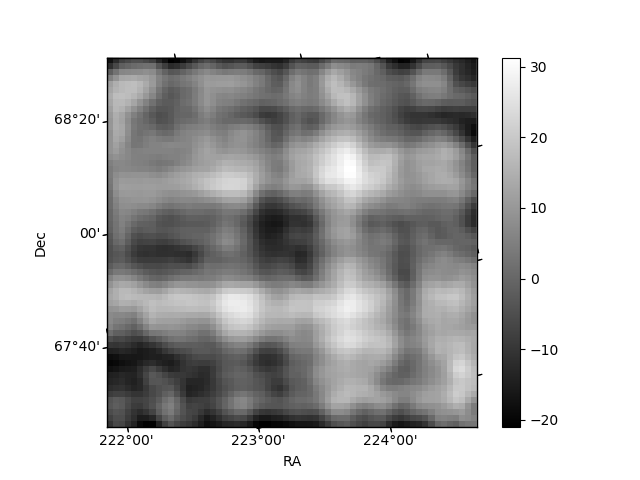
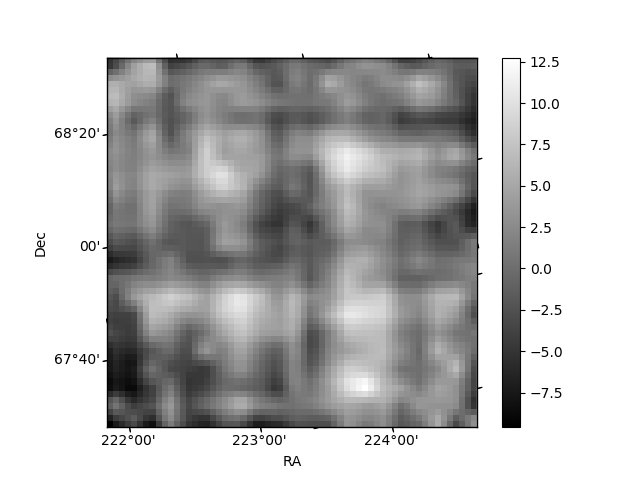
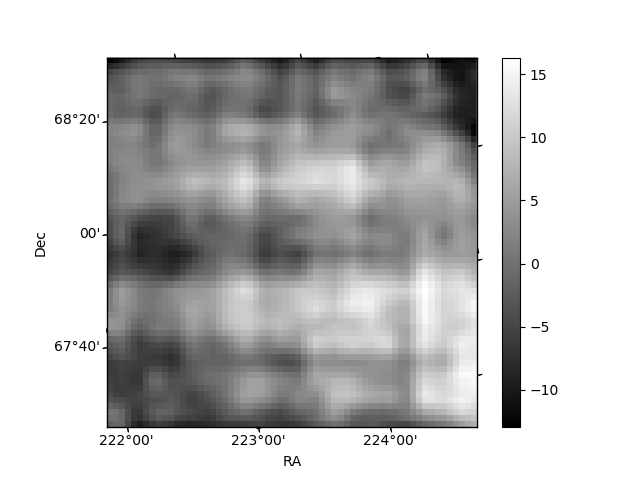
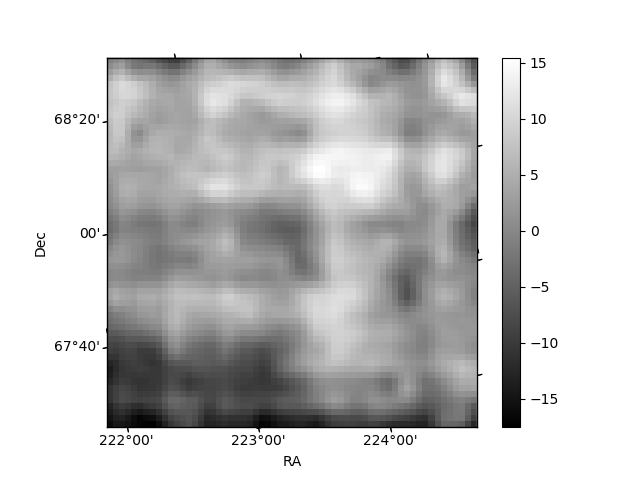
Histogram calculated using DETX and DETY for each event in the final _common_clean file
| Quadrant A | 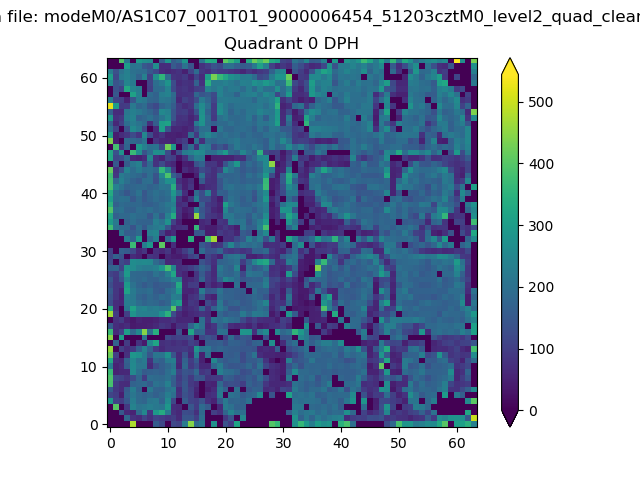 |
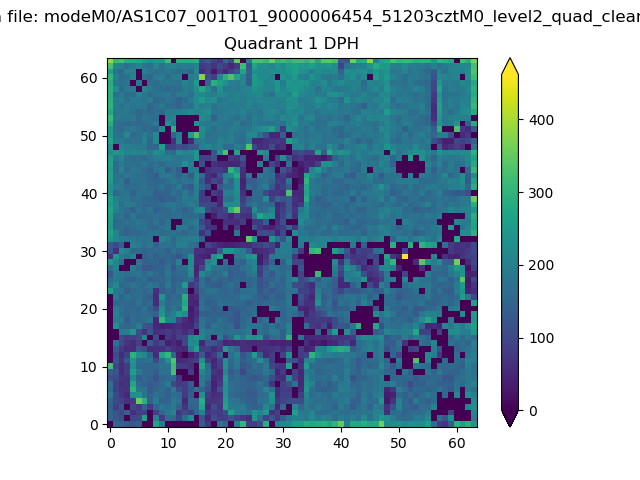 |
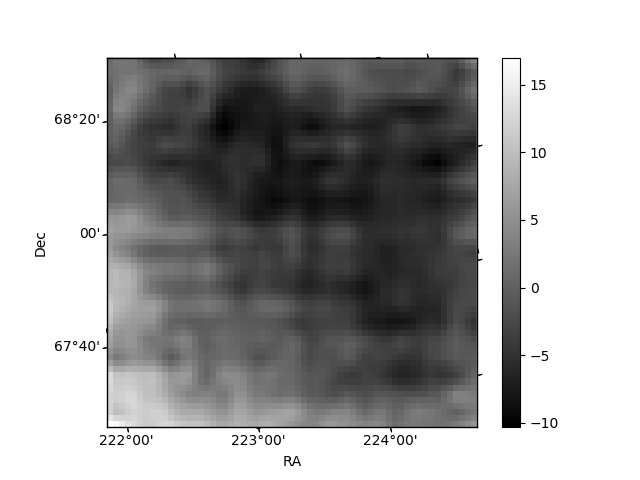
Quadrant B |
|---|---|---|---|
| Quadrant D | 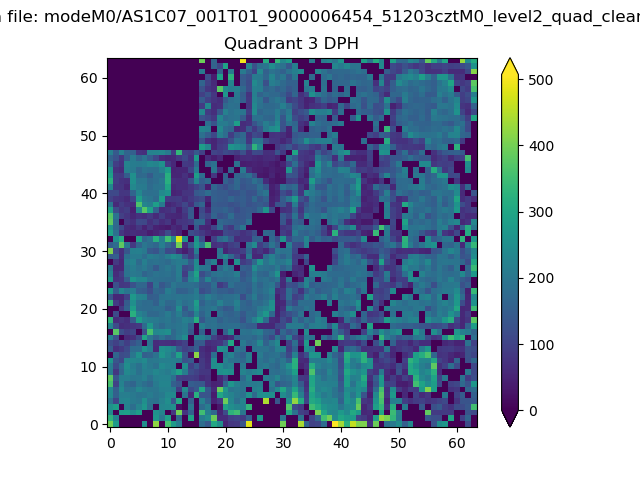 |
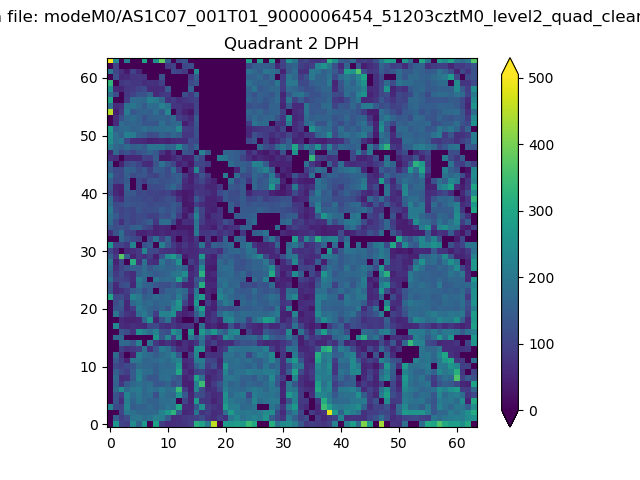 |
Quadrant C |
| Plot type | Count rate plots | Images |
|---|---|---|
| Comparison with Poisson distribution Blue bars denote a histogram of data divided into 1 sec bins. Red curve is a Poisson curve with rate = median count rate of data. |
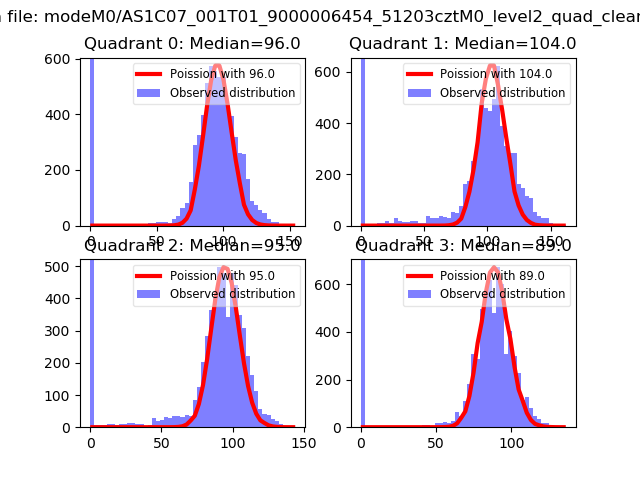 |
 |
| Quadrant-wise count rates Data is divided into 100 sec bins |
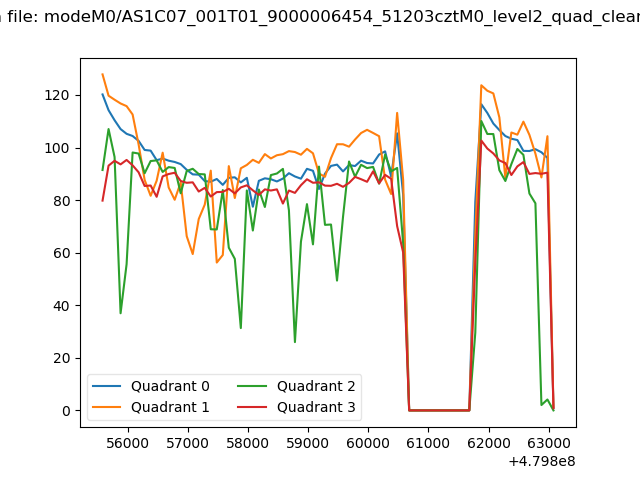 |
|
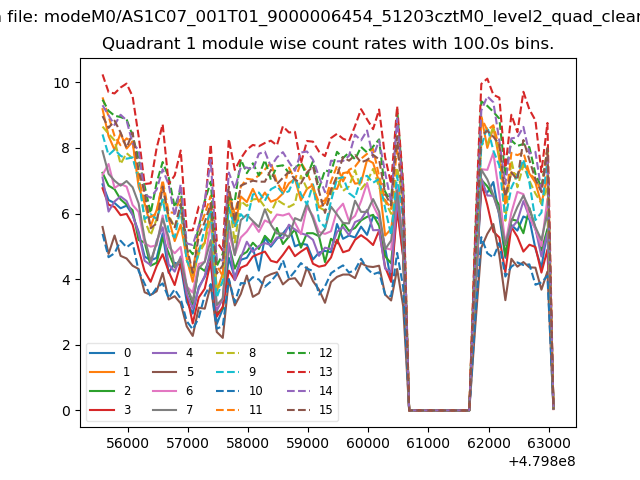
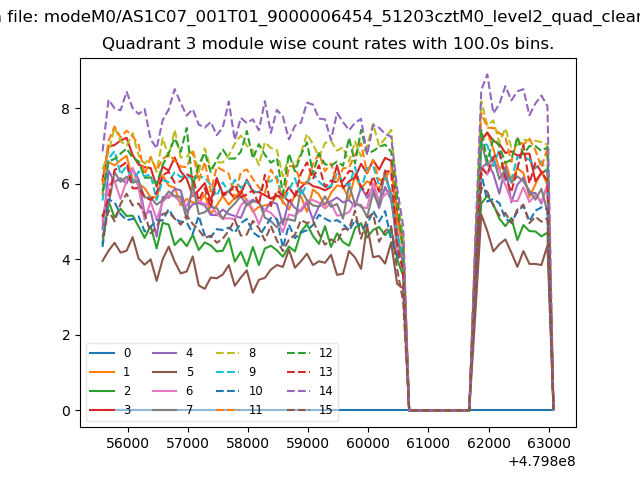
| Module-wise count rates for Quadrant A Data is divided into 100 sec bins |
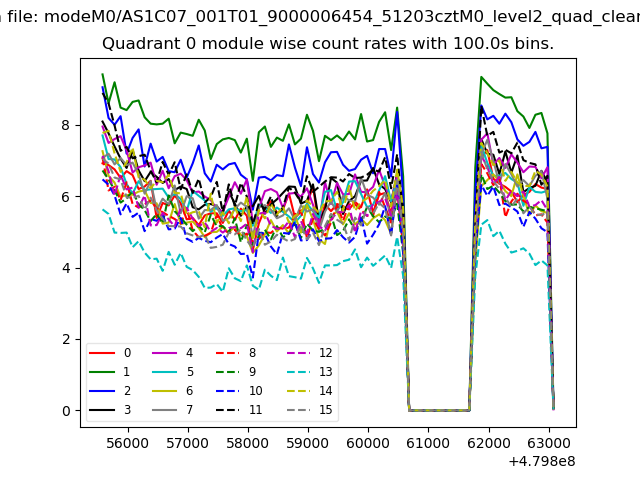 |
 |
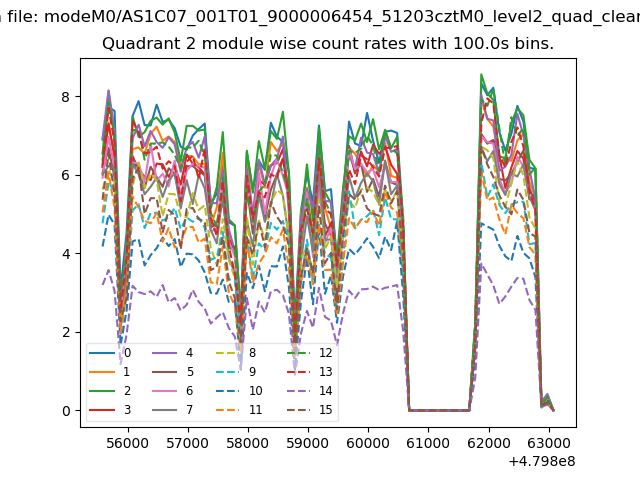
| Module-wise count rates for Quadrant B Data is divided into 100 sec bins |
 |
 |
| Module-wise count rates for Quadrant C Data is divided into 100 sec bins |
 |
 |
| Module-wise count rates for Quadrant D Data is divided into 100 sec bins |
 |
 |
| Parameter | Plot |
|---|---|
| CZT HV Monitor | 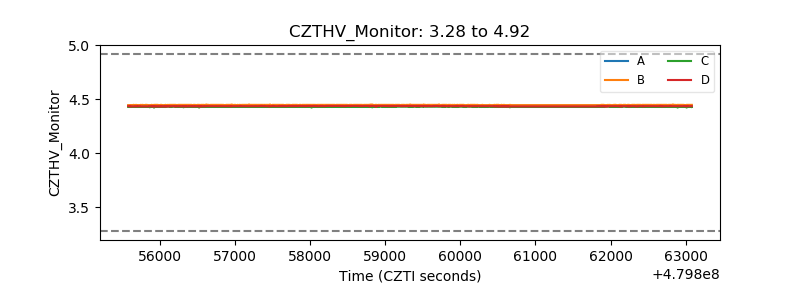 |
| D_VDD | 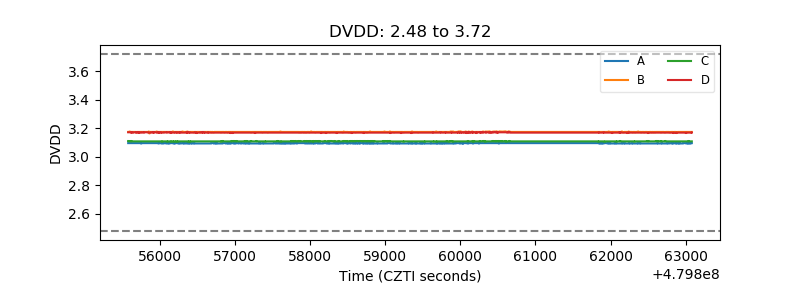 |
| Temperature 1 | 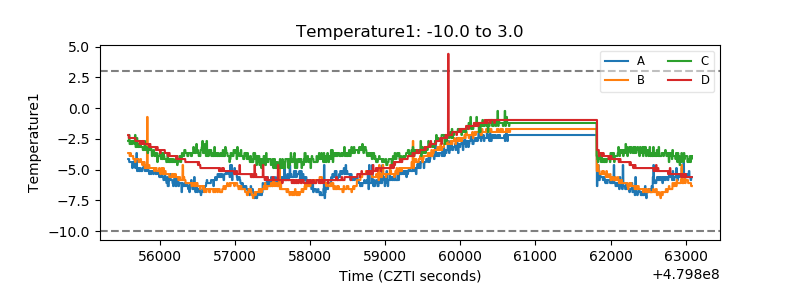 |
| Veto HV Monitor | 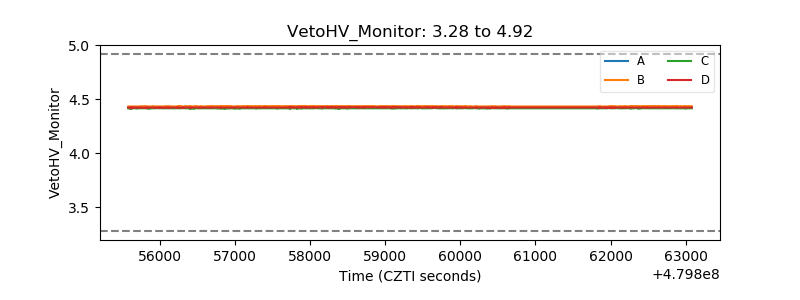 |
| Veto LLD | 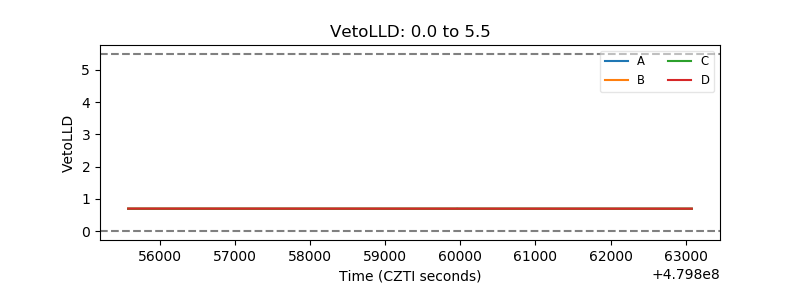 |
| Alpha Counter | 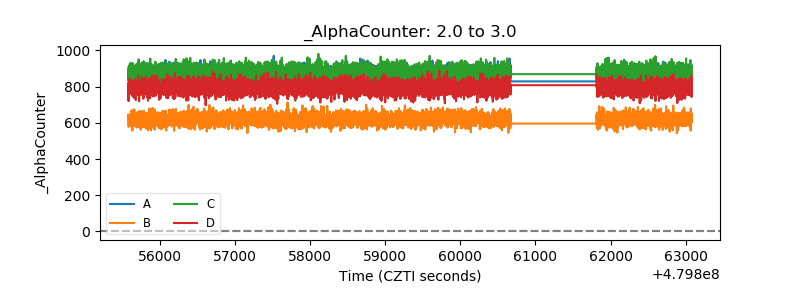 |
| _CPM_Rate | 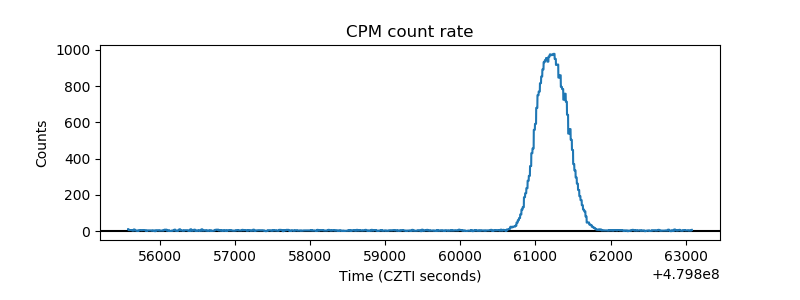 |
| CZT Counter | 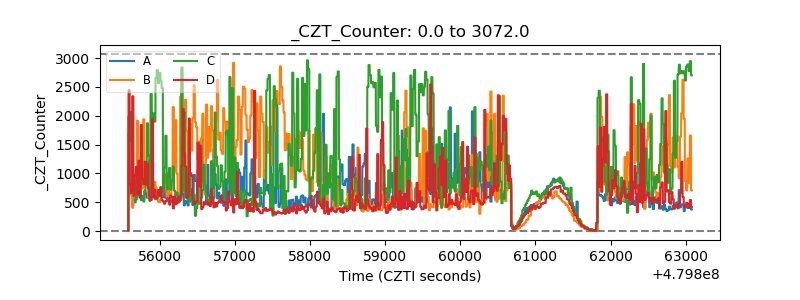 |
| +2.5 Volts monitor | 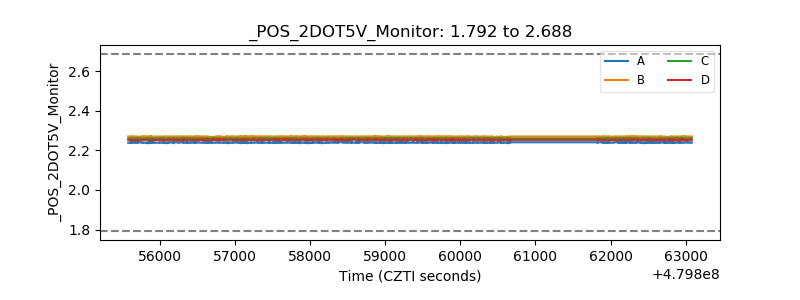 |
| +5 Volts monitor | 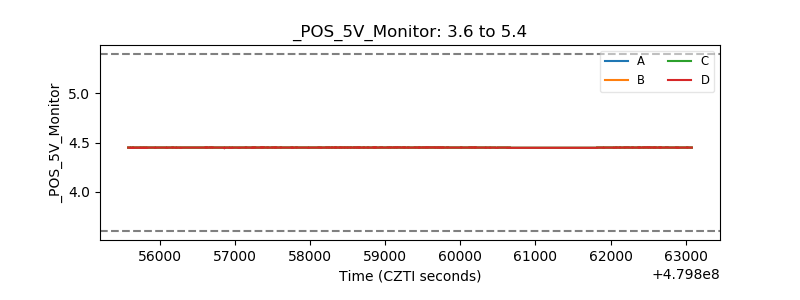 |
| _ROLL_ROT | 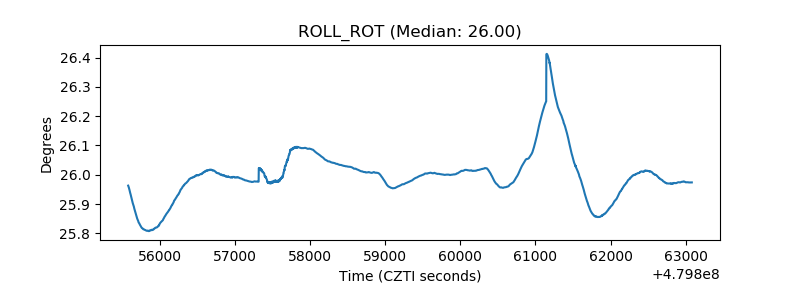 |
| _Roll_DEC | 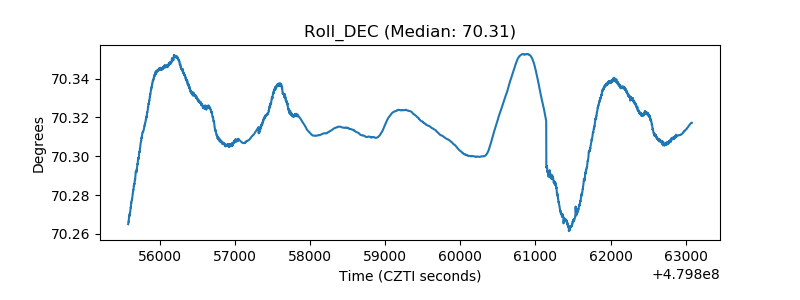 |
| _Roll_RA | 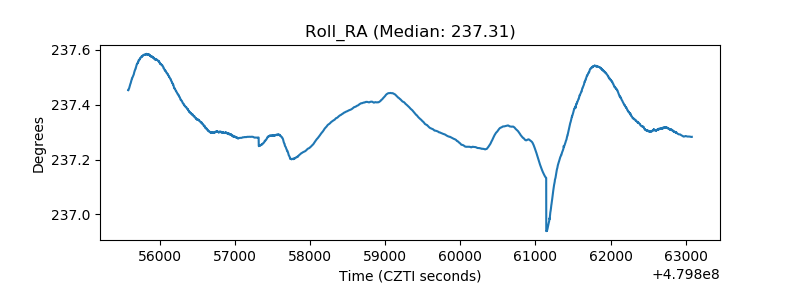 |
| Veto Counter | 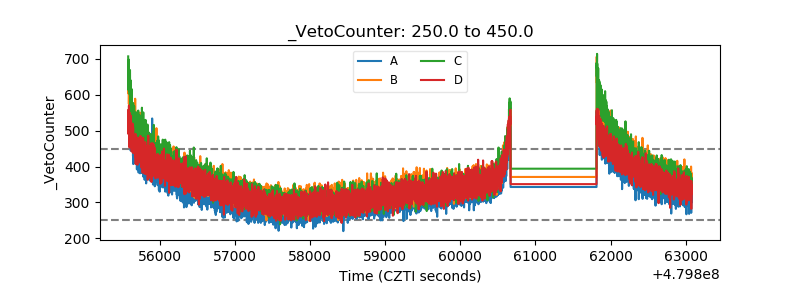 |