| Param | Original file | Final file |
|---|---|---|
| Filename | modeM0/AS1C07_001T01_9000006454_51204cztM0_level2.fits | modeM0/AS1C07_001T01_9000006454_51204cztM0_level2_quad_clean.evt |
| Size (bytes) | 653,572,800 | 94,919,040 |
| Size | 623.3 MB | 90.5 MB |
| Events in quadrant A | 4,231,732 | 641,115 |
| Events in quadrant B | 5,637,528 | 683,278 |
| Events in quadrant C | 8,614,583 | 516,158 |
| Events in quadrant D | 5,192,979 | 567,838 |
| Mode M0 | |||
|---|---|---|---|
| Quadrant | BADHDUFLAG | Total packets | Discarded packets |
| A | 0 | 17321 | 2 |
| B | 0 | 21435 | 2 |
| C | 0 | 30164 | 2 |
| D | 0 | 20284 | 3 |
| Mode SS | |||
|---|---|---|---|
| Quadrant | BADHDUFLAG | Total packets | Discarded packets |
| A | 0 | 138 | 0 |
| B | 0 | 138 | 0 |
| C | 0 | 138 | 0 |
| D | 0 | 138 | 0 |
| Mode M9 | |||
|---|---|---|---|
| Quadrant | BADHDUFLAG | Total packets | Discarded packets |
| A | 0 | 14 | 0 |
| B | 0 | 15 | 0 |
| C | 0 | 15 | 0 |
| D | 0 | 15 | 0 |
| Quadrant | Total seconds | Saturated seconds | Saturation percentage |
|---|---|---|---|
| A | 6670 | 165 | 2.473763% |
| B | 6670 | 507 | 7.601199% |
| C | 6670 | 1595 | 23.913043% |
| D | 6669 | 428 | 6.417754% |
Noise dominated data is calculated using 1-second bins in cleaned event files. If a bin has >2000 counts, and if more than 50% of those come from <1% of pixels, then it is considered to be noise-dominated and hence unusable.
| Quadrant | # 1 sec bins | Bins with >0 counts | Bins with >2000 counts | High rate bins dominated by noise | Noise dominated (total time) | Noise dominated (detector-on time) | Marked lightcurve |
|---|---|---|---|---|---|---|---|
| A | 7835 | 6671 | 113 | 113 | 1.44% | 1.69% | 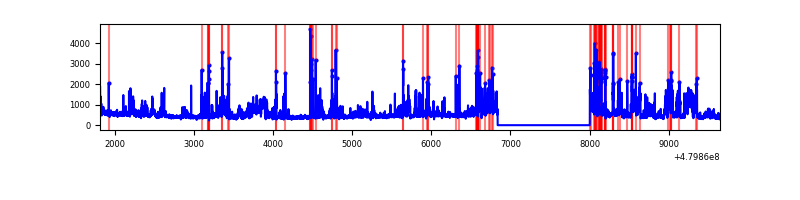 |
| B | 7835 | 6671 | 324 | 324 | 4.14% | 4.86% | 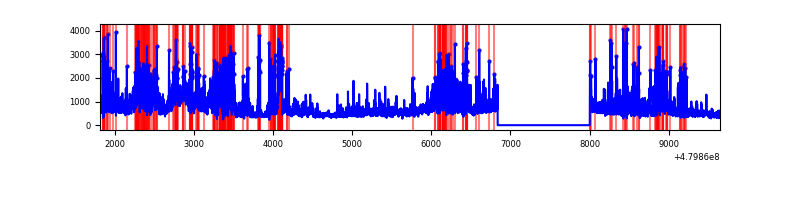 |
| C | 7835 | 6670 | 1512 | 1512 | 19.30% | 22.67% | 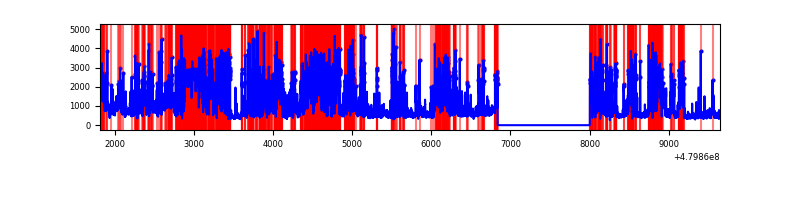 |
| D | 7834 | 6670 | 326 | 326 | 4.16% | 4.89% | 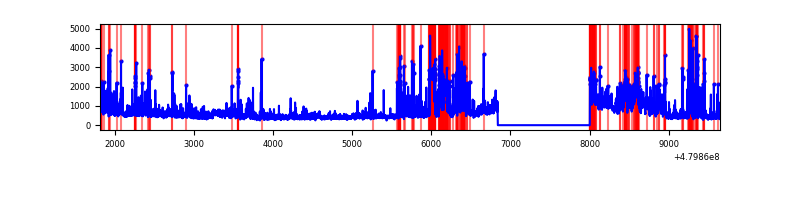 |
Top three noisy pixels from each quadrant. If the there are fewer than three noisy pixels in the level2.evt file, extra rows are filled as -1
| Pixel properties | Quadrant properties | ||||||
|---|---|---|---|---|---|---|---|
| Quadrant | DetID | PixID | Counts | Sigma | Mean | Median | Sigma |
| A | 12 | 3 | 611509 | 3524.33 | 693 | 675 | 173.3 |
| A | 13 | 248 | 164579 | 945.68 | 693 | 675 | 173.3 |
| A | 3 | 114 | 124737 | 715.8 | 693 | 675 | 173.3 |
| B | 8 | 128 | 1320866 | 9062.66 | 687 | 665 | 145.7 |
| B | 10 | 254 | 465519 | 3191.04 | 687 | 665 | 145.7 |
| B | 5 | 172 | 180153 | 1232.11 | 687 | 665 | 145.7 |
| C | 4 | 12 | 3815437 | 22340.56 | 619 | 614 | 170.8 |
| C | 10 | 171 | 974800 | 5705.08 | 619 | 614 | 170.8 |
| C | 15 | 224 | 283225 | 1655.04 | 619 | 614 | 170.8 |
| D | 2 | 62 | 1127235 | 6010.97 | 656 | 632 | 187.4 |
| D | 8 | 176 | 463274 | 2468.42 | 656 | 632 | 187.4 |
| D | 3 | 12 | 341554 | 1818.98 | 656 | 632 | 187.4 |
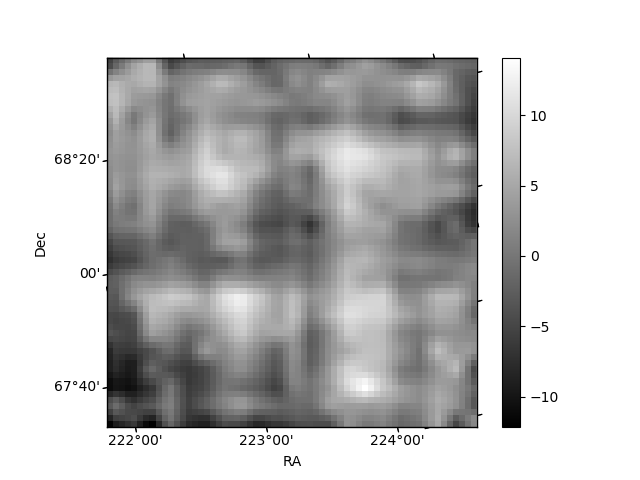
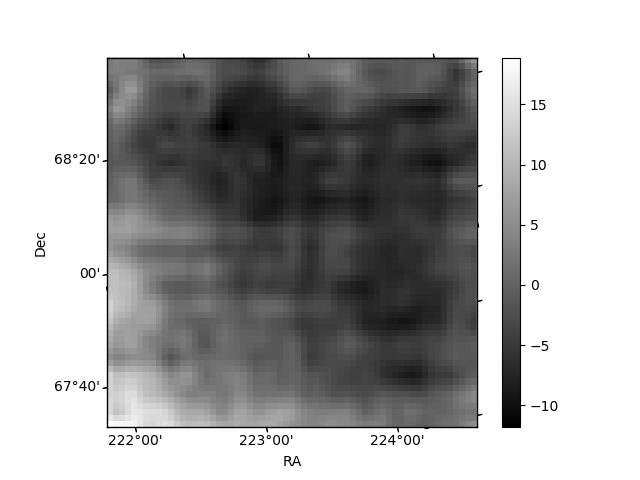
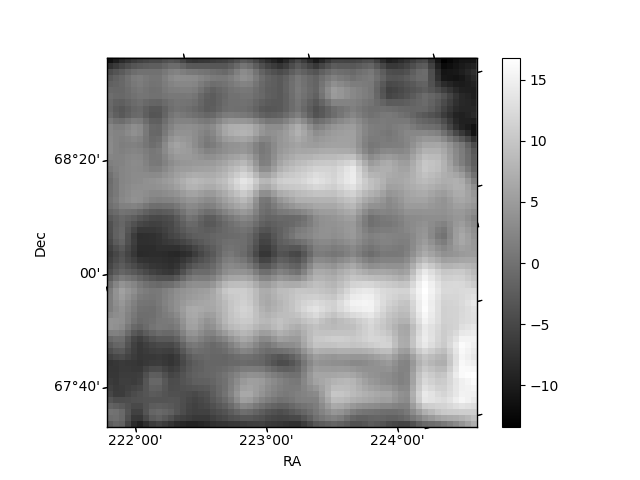
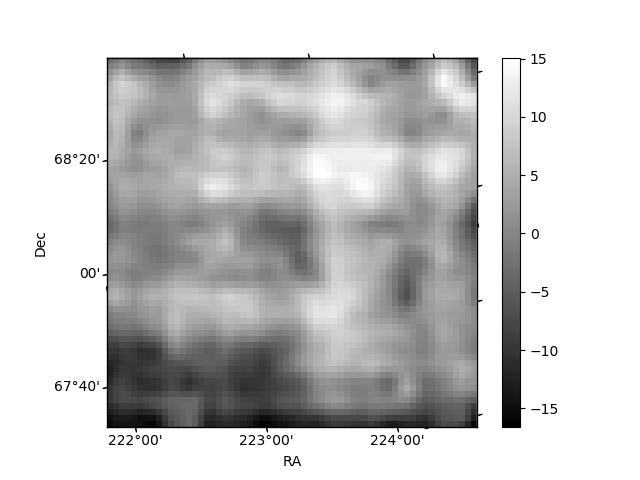
Histogram calculated using DETX and DETY for each event in the final _common_clean file
| Quadrant A | 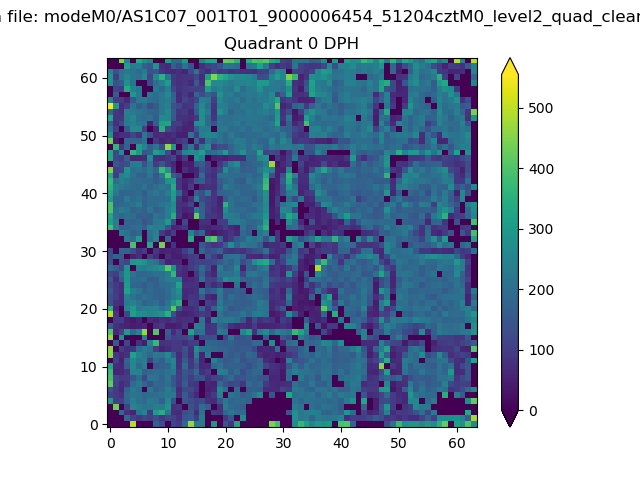 |
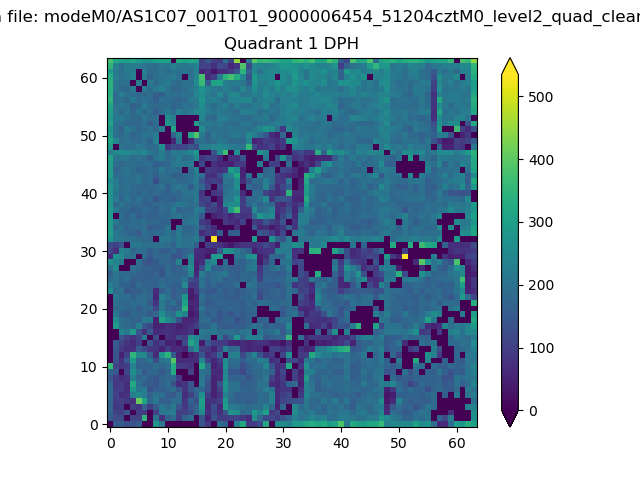 |
Quadrant B |
|---|---|---|---|
| Quadrant D | 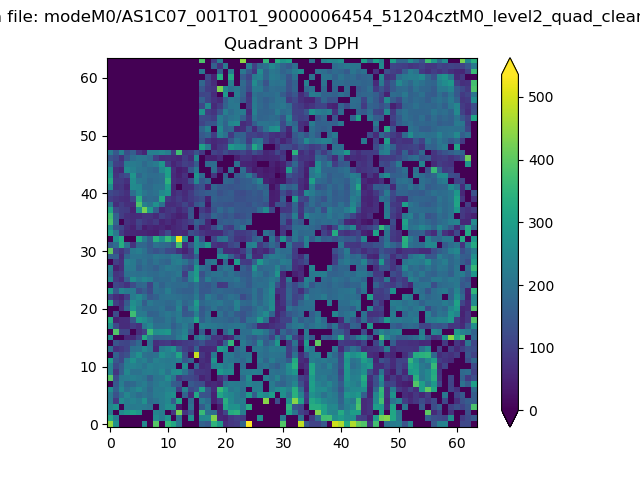 |
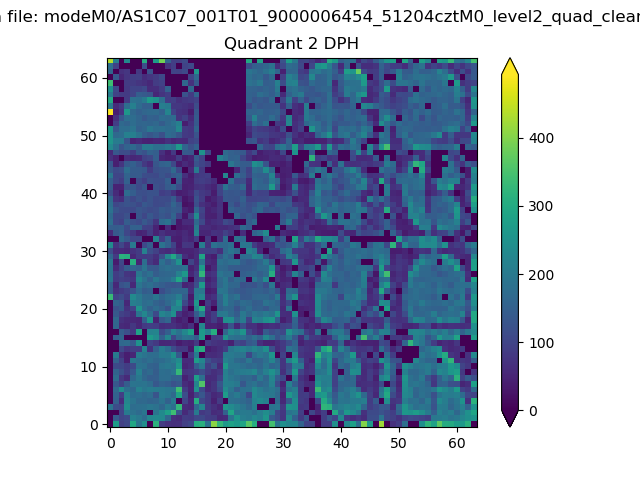 |
Quadrant C |
| Plot type | Count rate plots | Images |
|---|---|---|
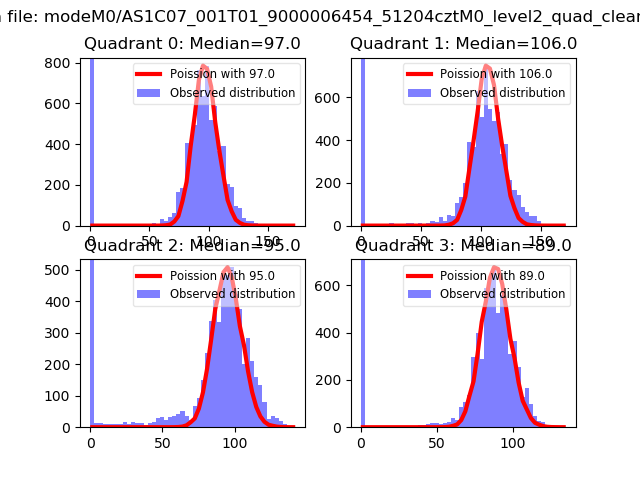
| Comparison with Poisson distribution Blue bars denote a histogram of data divided into 1 sec bins. Red curve is a Poisson curve with rate = median count rate of data. |
 |
 |
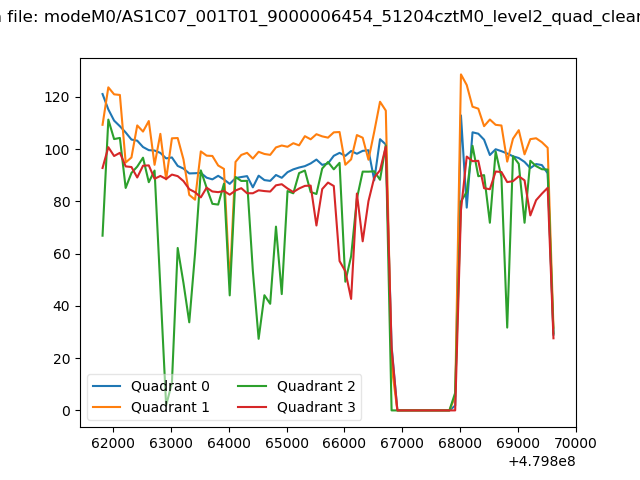
| Quadrant-wise count rates Data is divided into 100 sec bins |
 |
|
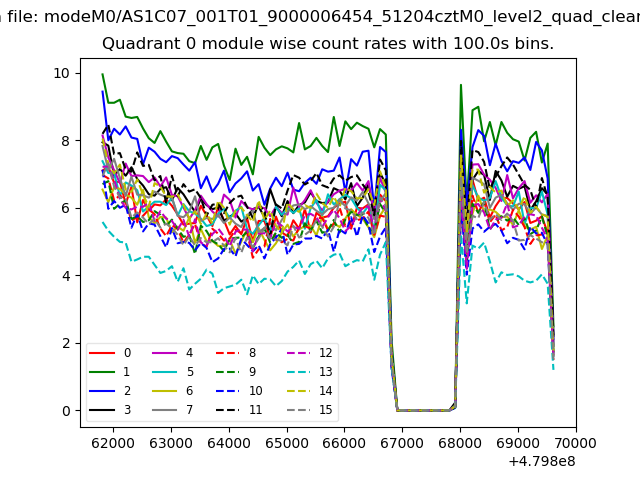
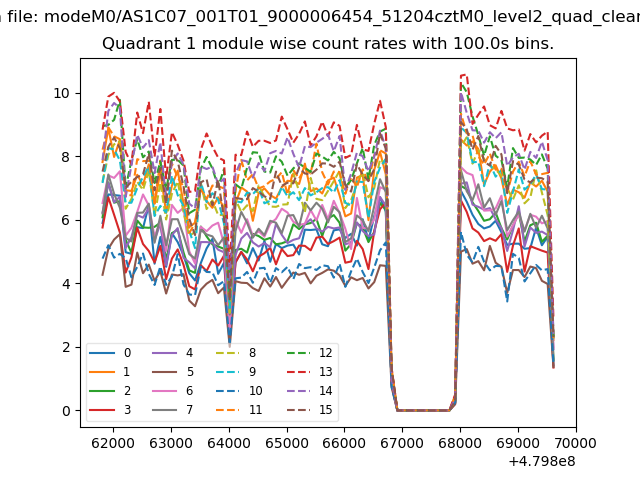
| Module-wise count rates for Quadrant A Data is divided into 100 sec bins |
 |
 |
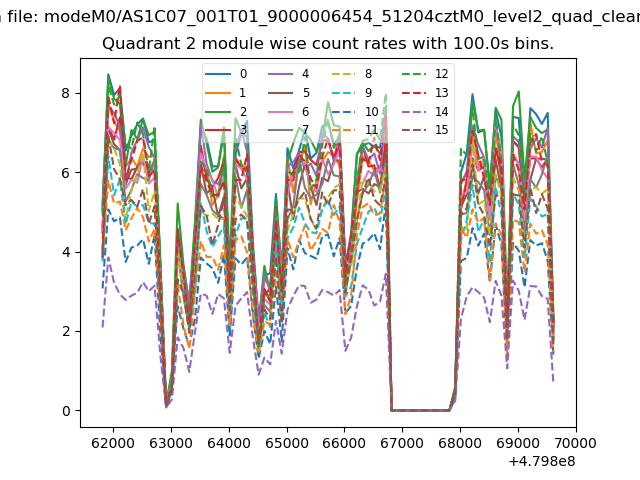
| Module-wise count rates for Quadrant B Data is divided into 100 sec bins |
 |
 |
| Module-wise count rates for Quadrant C Data is divided into 100 sec bins |
 |
 |
| Module-wise count rates for Quadrant D Data is divided into 100 sec bins |
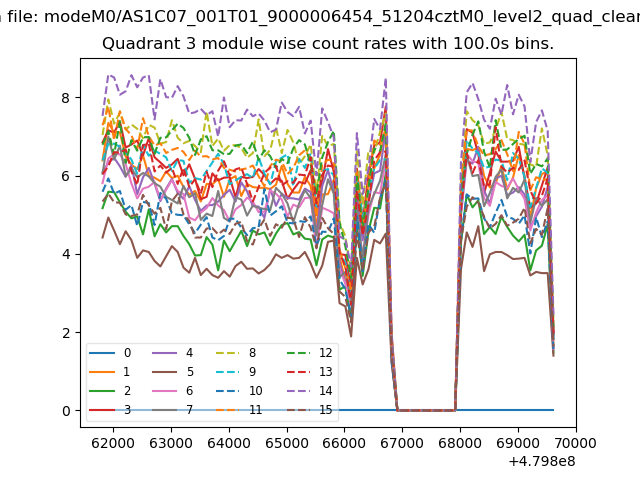 |
 |
| Parameter | Plot |
|---|---|
| CZT HV Monitor | 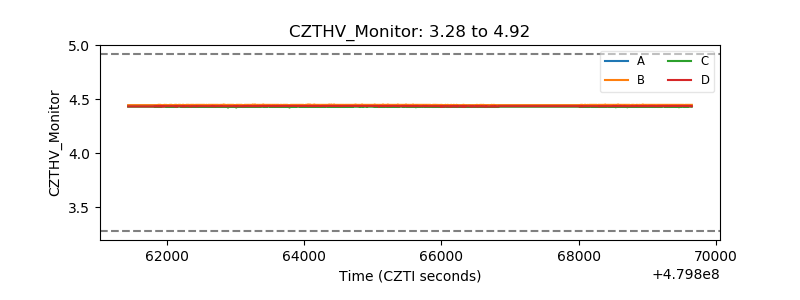 |
| D_VDD | 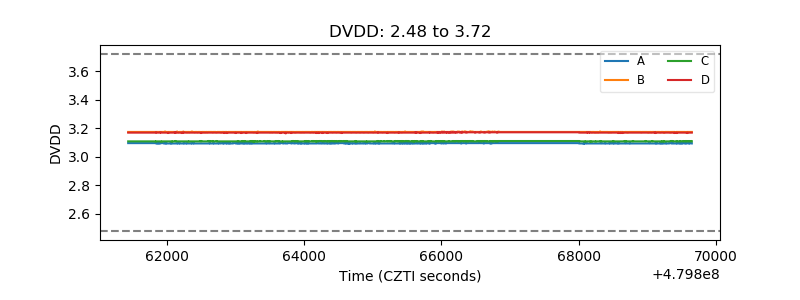 |
| Temperature 1 | 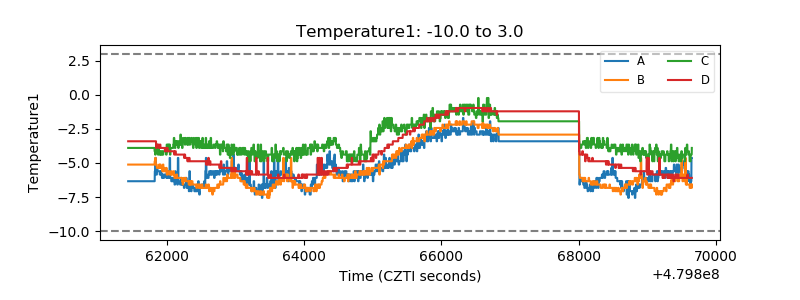 |
| Veto HV Monitor | 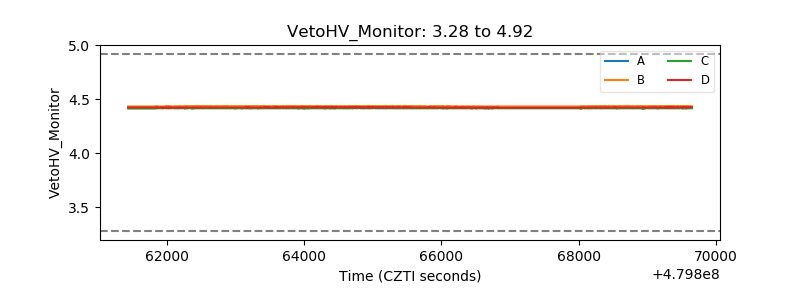 |
| Veto LLD | 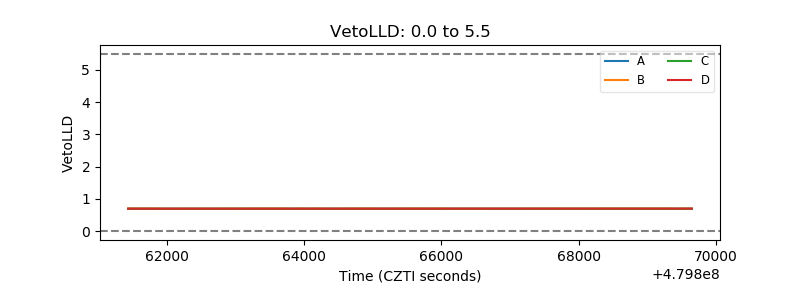 |
| Alpha Counter | 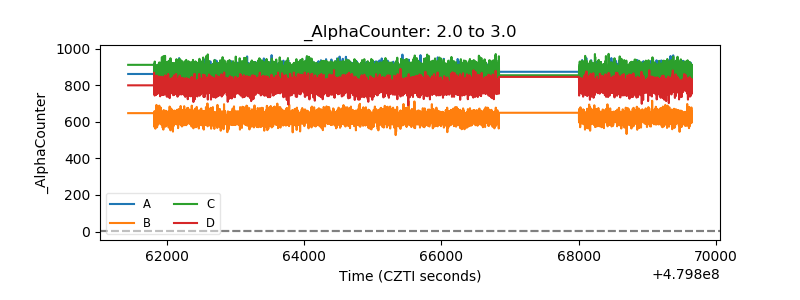 |
| _CPM_Rate | 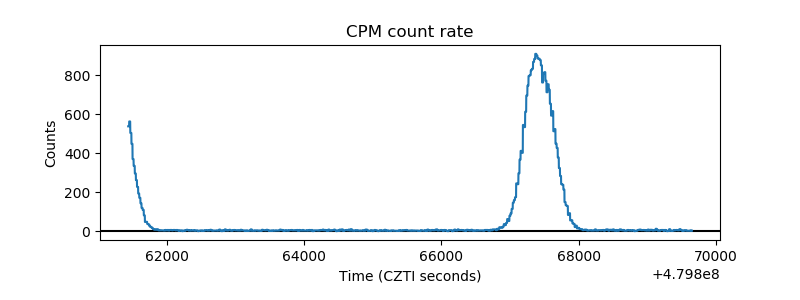 |
| CZT Counter | 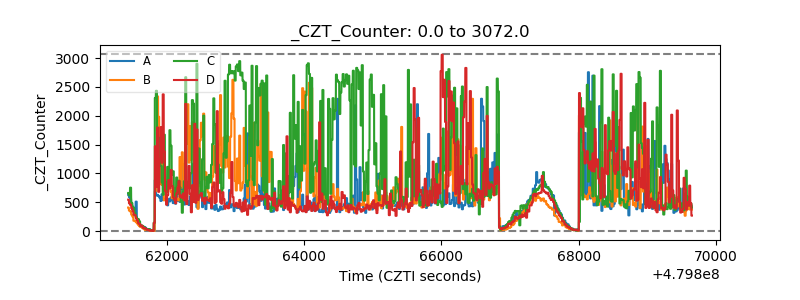 |
| +2.5 Volts monitor | 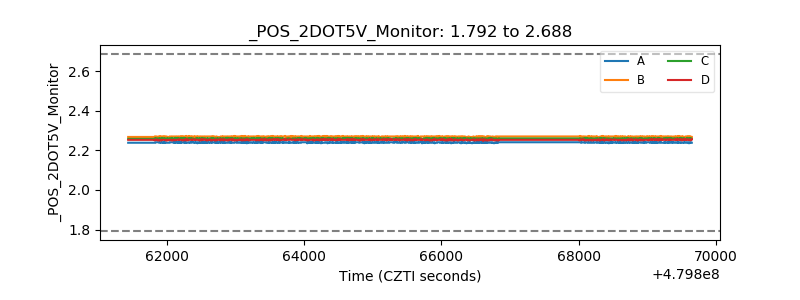 |
| +5 Volts monitor | 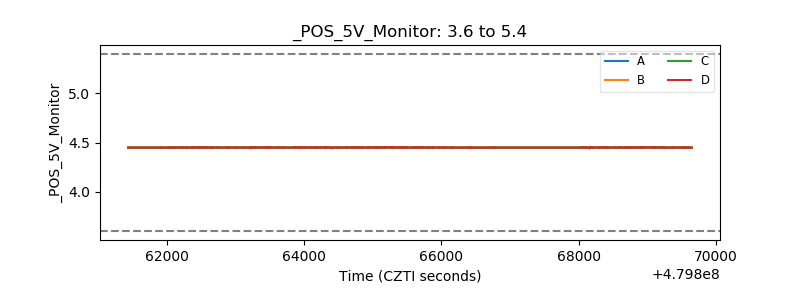 |
| _ROLL_ROT | 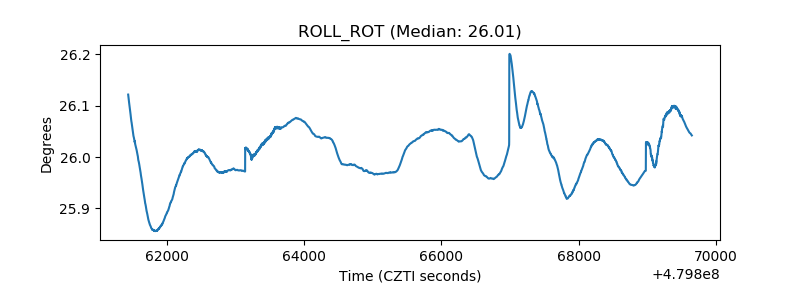 |
| _Roll_DEC | 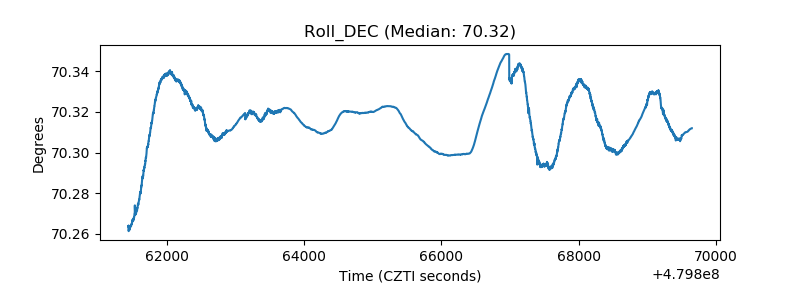 |
| _Roll_RA | 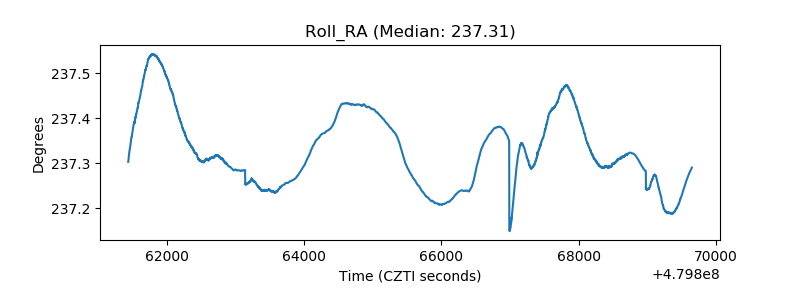 |
| Veto Counter | 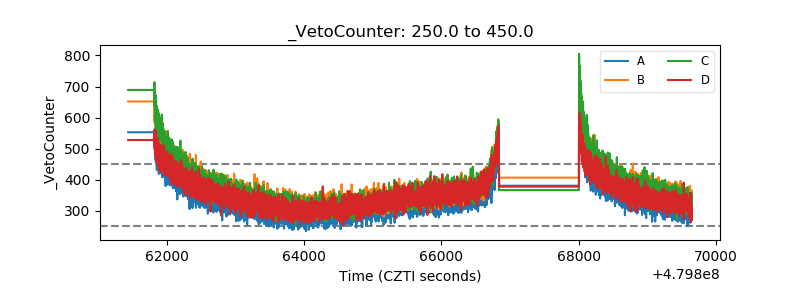 |