| Param | Original file | Final file |
|---|---|---|
| Filename | modeM0/AS1C07_001T01_9000006454_51205cztM0_level2.fits | modeM0/AS1C07_001T01_9000006454_51205cztM0_level2_quad_clean.evt |
| Size (bytes) | 595,356,480 | 97,007,040 |
| Size | 567.8 MB | 92.5 MB |
| Events in quadrant A | 4,811,457 | 628,223 |
| Events in quadrant B | 5,154,871 | 689,461 |
| Events in quadrant C | 6,517,512 | 573,484 |
| Events in quadrant D | 5,032,543 | 576,338 |
| Mode M0 | |||
|---|---|---|---|
| Quadrant | BADHDUFLAG | Total packets | Discarded packets |
| A | 0 | 19122 | 2 |
| B | 0 | 19949 | 2 |
| C | 0 | 23997 | 2 |
| D | 0 | 19943 | 2 |
| Mode SS | |||
|---|---|---|---|
| Quadrant | BADHDUFLAG | Total packets | Discarded packets |
| A | 0 | 138 | 0 |
| B | 0 | 138 | 0 |
| C | 0 | 138 | 0 |
| D | 0 | 138 | 0 |
| Mode M9 | |||
|---|---|---|---|
| Quadrant | BADHDUFLAG | Total packets | Discarded packets |
| A | 0 | 16 | 0 |
| B | 0 | 17 | 0 |
| C | 0 | 17 | 0 |
| D | 0 | 17 | 0 |
| Quadrant | Total seconds | Saturated seconds | Saturation percentage |
|---|---|---|---|
| A | 6735 | 279 | 4.142539% |
| B | 6735 | 396 | 5.879733% |
| C | 6735 | 886 | 13.155160% |
| D | 6735 | 319 | 4.736451% |
Noise dominated data is calculated using 1-second bins in cleaned event files. If a bin has >2000 counts, and if more than 50% of those come from <1% of pixels, then it is considered to be noise-dominated and hence unusable.
| Quadrant | # 1 sec bins | Bins with >0 counts | Bins with >2000 counts | High rate bins dominated by noise | Noise dominated (total time) | Noise dominated (detector-on time) | Marked lightcurve |
|---|---|---|---|---|---|---|---|
| A | 7870 | 6736 | 195 | 195 | 2.48% | 2.89% | 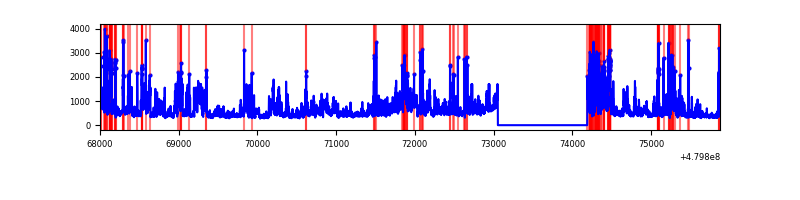 |
| B | 7870 | 6736 | 276 | 276 | 3.51% | 4.10% | 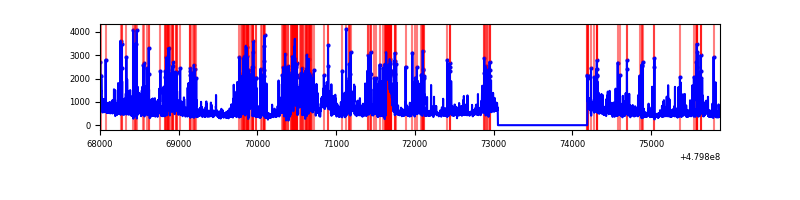 |
| C | 7870 | 6736 | 843 | 843 | 10.71% | 12.51% | 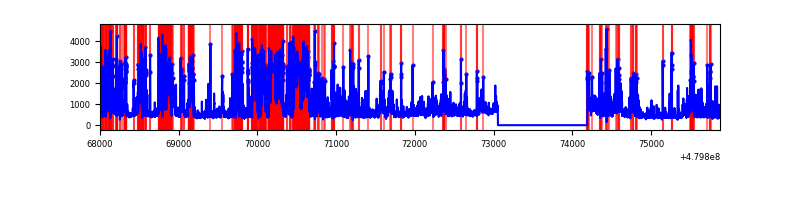 |
| D | 7870 | 6735 | 265 | 265 | 3.37% | 3.93% | 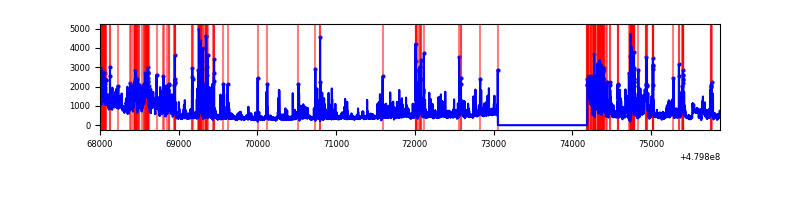 |
Top three noisy pixels from each quadrant. If the there are fewer than three noisy pixels in the level2.evt file, extra rows are filled as -1
| Pixel properties | Quadrant properties | ||||||
|---|---|---|---|---|---|---|---|
| Quadrant | DetID | PixID | Counts | Sigma | Mean | Median | Sigma |
| A | 12 | 3 | 874403 | 5062.61 | 691 | 675 | 172.6 |
| A | 13 | 248 | 264871 | 1530.82 | 691 | 675 | 172.6 |
| A | 7 | 206 | 261393 | 1510.67 | 691 | 675 | 172.6 |
| B | 8 | 128 | 765197 | 5221.89 | 692 | 669 | 146.4 |
| B | 10 | 254 | 524722 | 3579.39 | 692 | 669 | 146.4 |
| B | 4 | 171 | 244104 | 1662.71 | 692 | 669 | 146.4 |
| C | 4 | 12 | 2474362 | 13570.67 | 656 | 650 | 182.3 |
| C | 15 | 224 | 493843 | 2705.63 | 656 | 650 | 182.3 |
| C | 12 | 247 | 131797 | 719.47 | 656 | 650 | 182.3 |
| D | 2 | 62 | 939252 | 4979.22 | 661 | 637 | 188.5 |
| D | 3 | 12 | 606406 | 3213.52 | 661 | 637 | 188.5 |
| D | 8 | 176 | 247733 | 1310.81 | 661 | 637 | 188.5 |
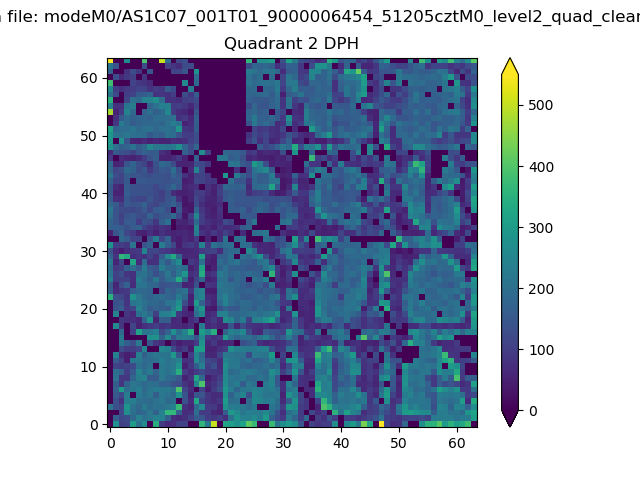
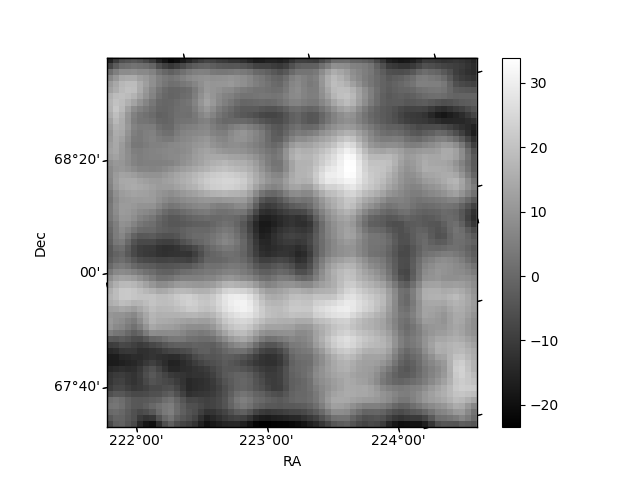
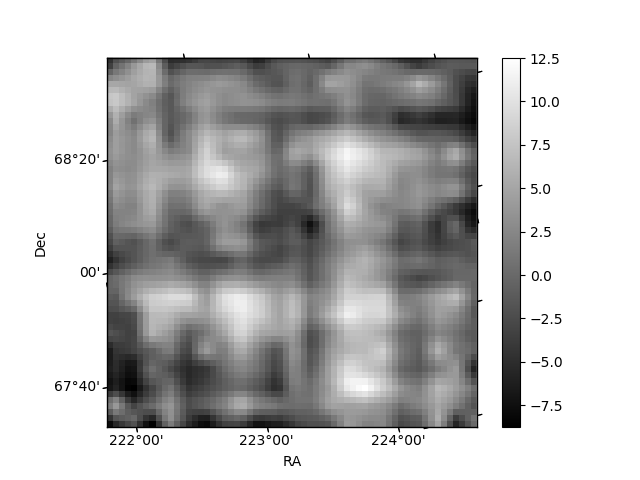
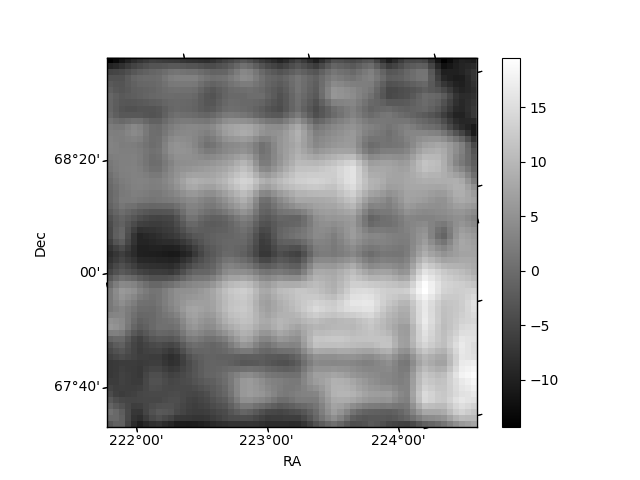
Histogram calculated using DETX and DETY for each event in the final _common_clean file
| Quadrant A | 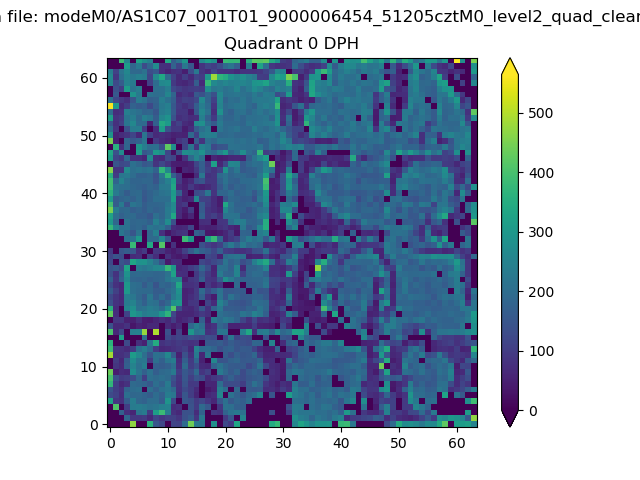 |
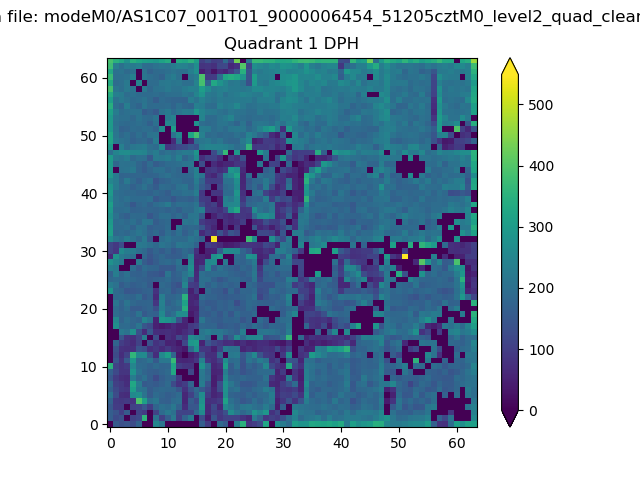 |
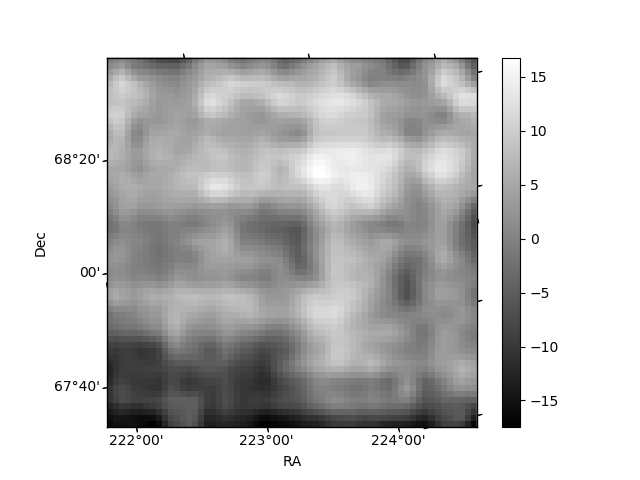
Quadrant B |
|---|---|---|---|
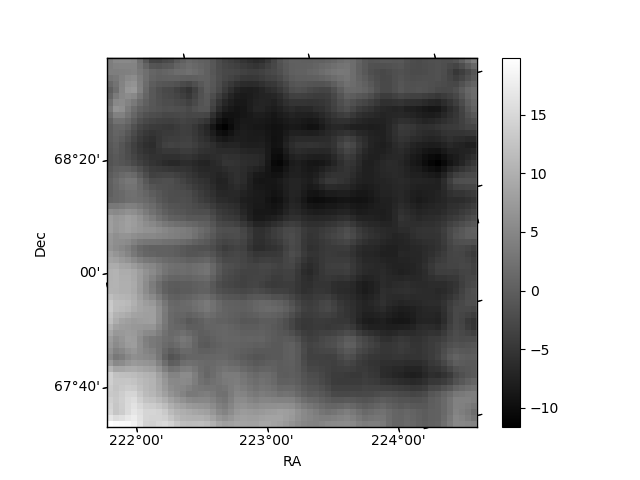
| Quadrant D | 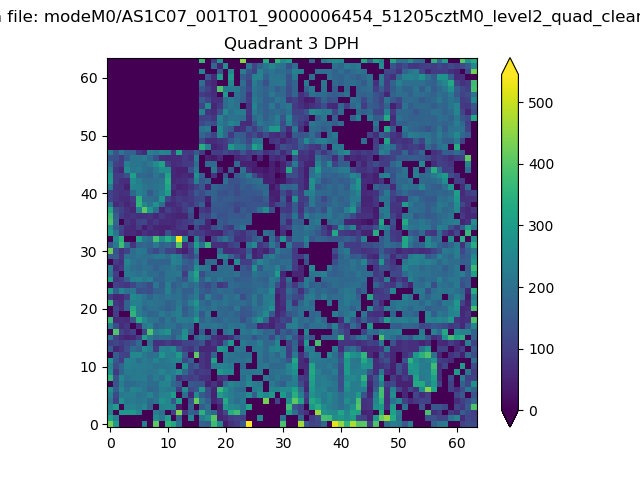 |
 |
Quadrant C |
| Plot type | Count rate plots | Images |
|---|---|---|
| Comparison with Poisson distribution Blue bars denote a histogram of data divided into 1 sec bins. Red curve is a Poisson curve with rate = median count rate of data. |
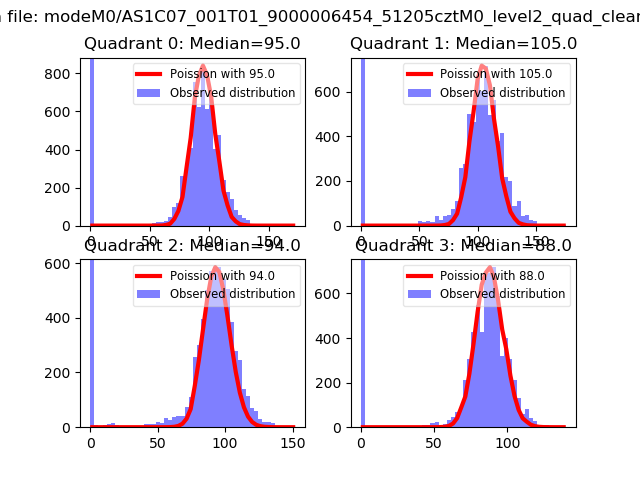 |
 |
| Quadrant-wise count rates Data is divided into 100 sec bins |
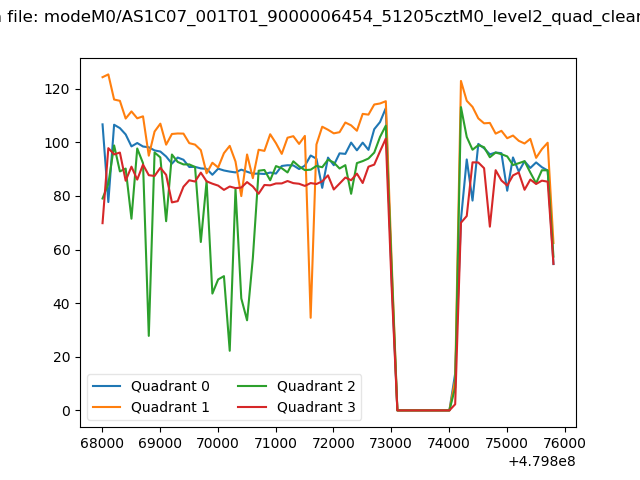 |
|
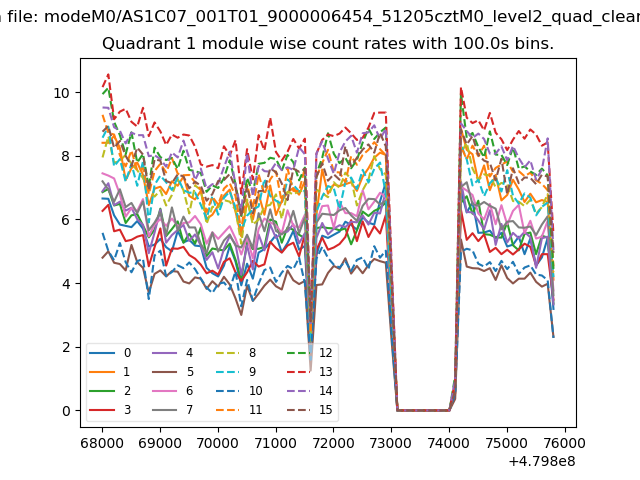
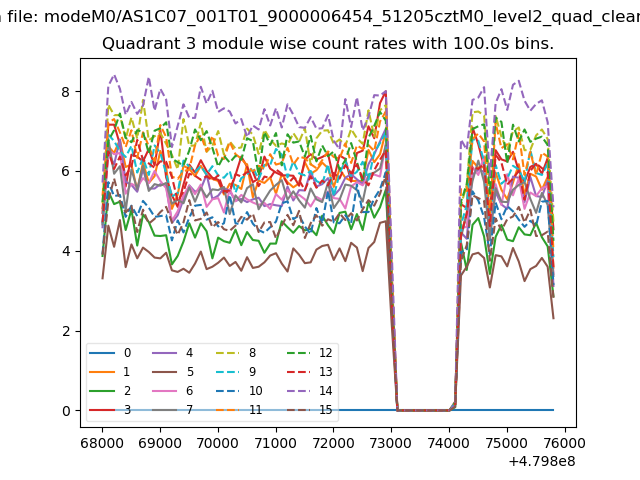
| Module-wise count rates for Quadrant A Data is divided into 100 sec bins |
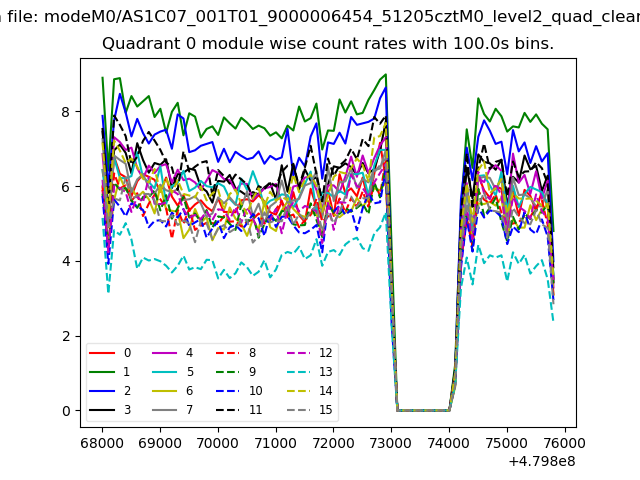 |
 |
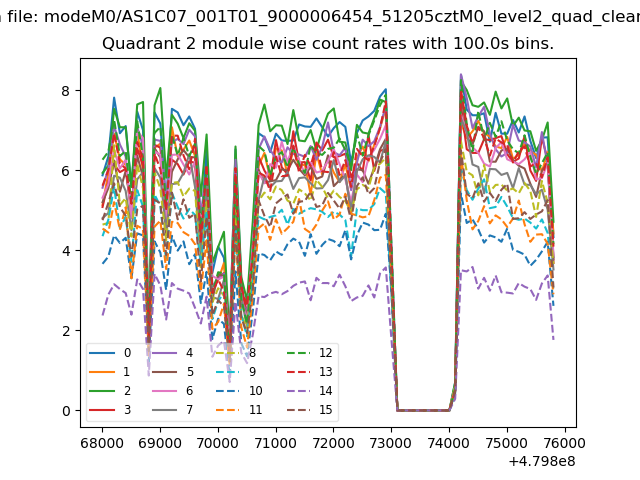
| Module-wise count rates for Quadrant B Data is divided into 100 sec bins |
 |
 |
| Module-wise count rates for Quadrant C Data is divided into 100 sec bins |
 |
 |
| Module-wise count rates for Quadrant D Data is divided into 100 sec bins |
 |
 |
| Parameter | Plot |
|---|---|
| CZT HV Monitor | 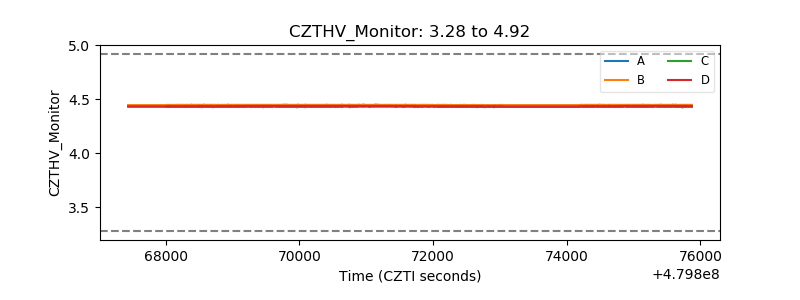 |
| D_VDD | 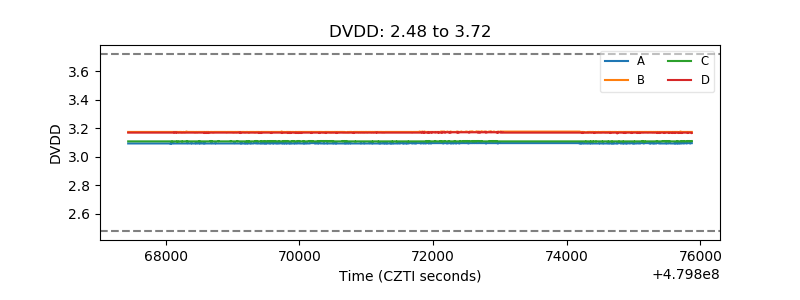 |
| Temperature 1 | 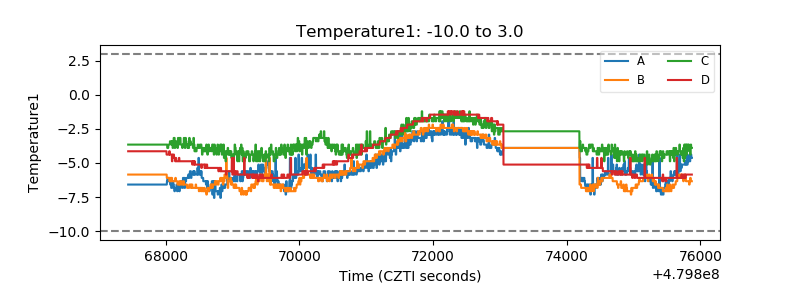 |
| Veto HV Monitor | 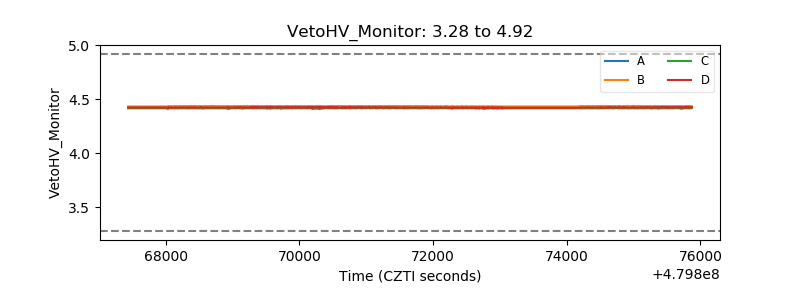 |
| Veto LLD | 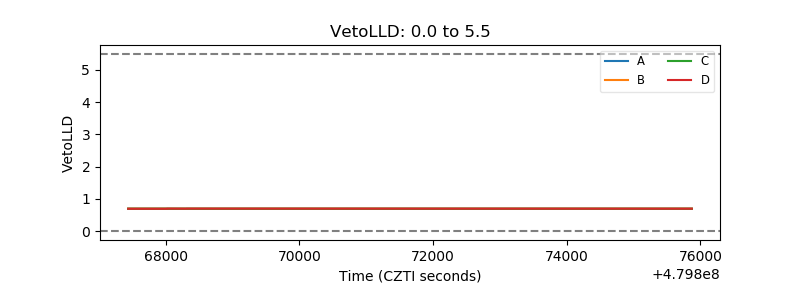 |
| Alpha Counter | 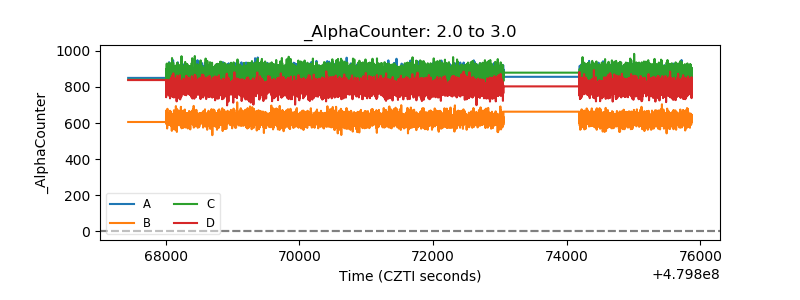 |
| _CPM_Rate | 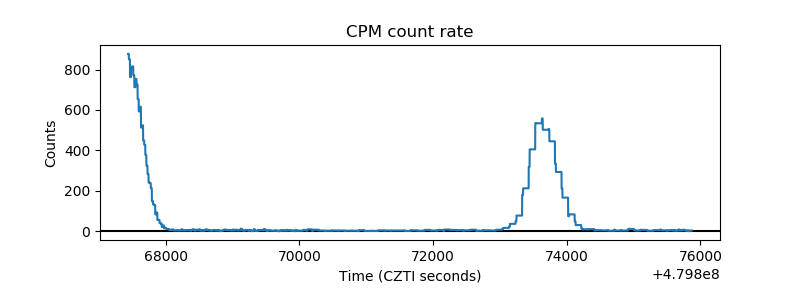 |
| CZT Counter | 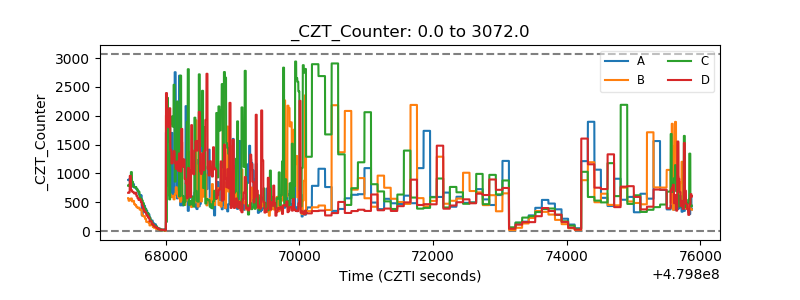 |
| +2.5 Volts monitor | 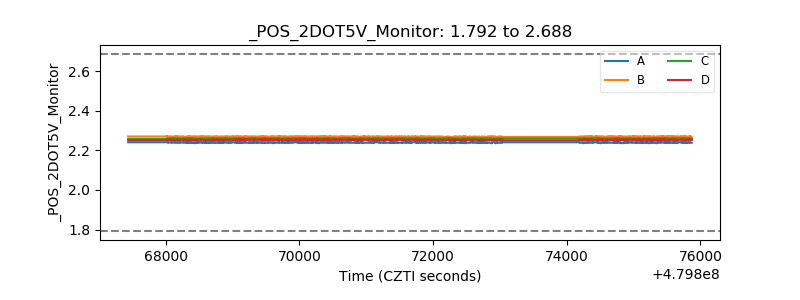 |
| +5 Volts monitor | 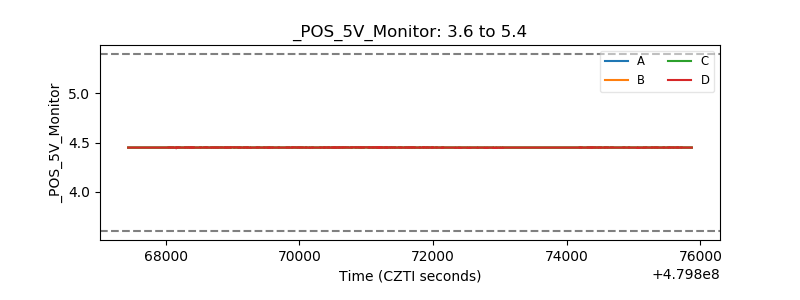 |
| _ROLL_ROT | 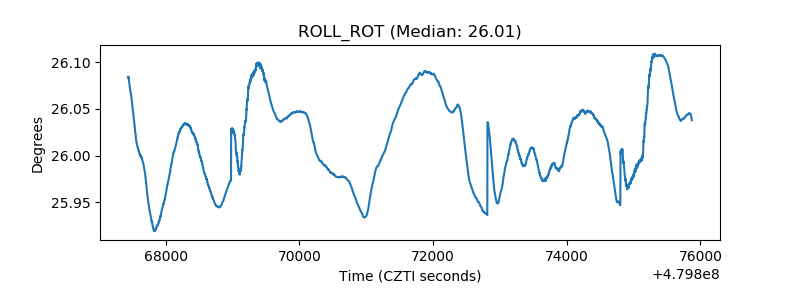 |
| _Roll_DEC | 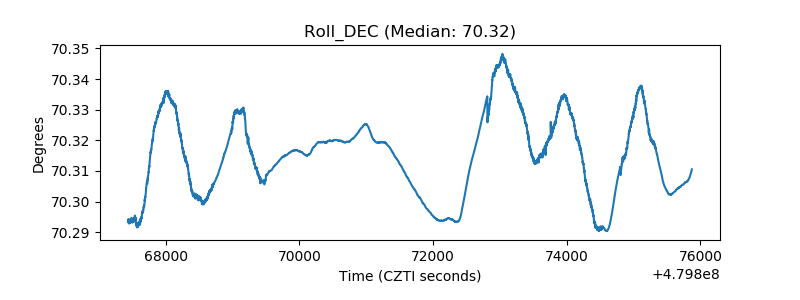 |
| _Roll_RA | 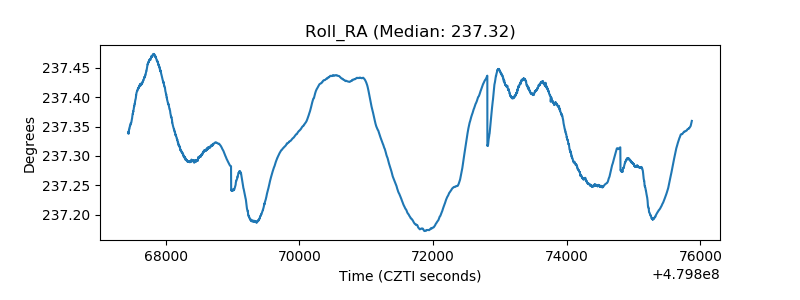 |
| Veto Counter | 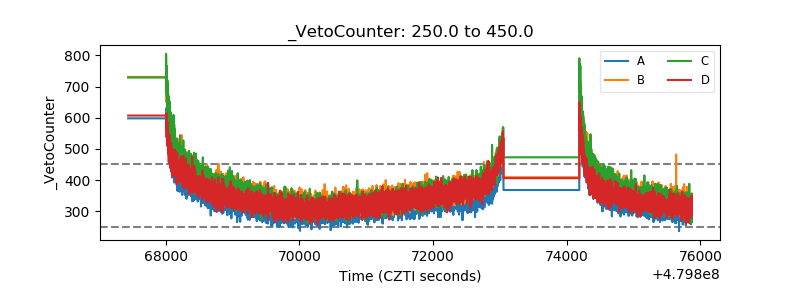 |