| Param | Original file | Final file |
|---|---|---|
| Filename | modeM0/AS1C07_001T01_9000006454_51206cztM0_level2.fits | modeM0/AS1C07_001T01_9000006454_51206cztM0_level2_quad_clean.evt |
| Size (bytes) | 651,312,000 | 94,029,120 |
| Size | 621.1 MB | 89.7 MB |
| Events in quadrant A | 4,441,945 | 614,312 |
| Events in quadrant B | 4,717,176 | 693,279 |
| Events in quadrant C | 6,533,018 | 579,420 |
| Events in quadrant D | 7,888,276 | 484,180 |
| Mode M0 | |||
|---|---|---|---|
| Quadrant | BADHDUFLAG | Total packets | Discarded packets |
| A | 0 | 18260 | 2 |
| B | 0 | 18722 | 2 |
| C | 0 | 24220 | 2 |
| D | 0 | 28232 | 2 |
| Mode SS | |||
|---|---|---|---|
| Quadrant | BADHDUFLAG | Total packets | Discarded packets |
| A | 0 | 138 | 0 |
| B | 0 | 138 | 0 |
| C | 0 | 138 | 0 |
| D | 0 | 138 | 0 |
| Mode M9 | |||
|---|---|---|---|
| Quadrant | BADHDUFLAG | Total packets | Discarded packets |
| A | 0 | 15 | 0 |
| B | 0 | 16 | 0 |
| C | 0 | 16 | 0 |
| D | 0 | 16 | 0 |
| Quadrant | Total seconds | Saturated seconds | Saturation percentage |
|---|---|---|---|
| A | 6830 | 437 | 6.398243% |
| B | 6830 | 272 | 3.982430% |
| C | 6830 | 839 | 12.284041% |
| D | 6830 | 1305 | 19.106881% |
Noise dominated data is calculated using 1-second bins in cleaned event files. If a bin has >2000 counts, and if more than 50% of those come from <1% of pixels, then it is considered to be noise-dominated and hence unusable.
| Quadrant | # 1 sec bins | Bins with >0 counts | Bins with >2000 counts | High rate bins dominated by noise | Noise dominated (total time) | Noise dominated (detector-on time) | Marked lightcurve |
|---|---|---|---|---|---|---|---|
| A | 7830 | 6832 | 189 | 189 | 2.41% | 2.77% | 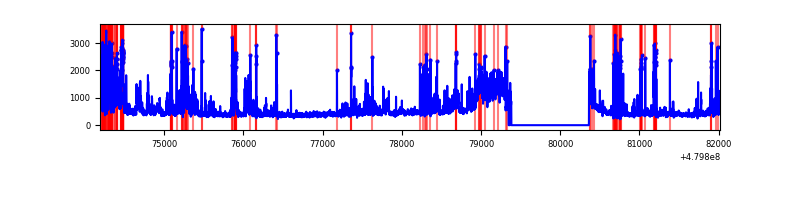 |
| B | 7830 | 6832 | 143 | 143 | 1.83% | 2.09% | 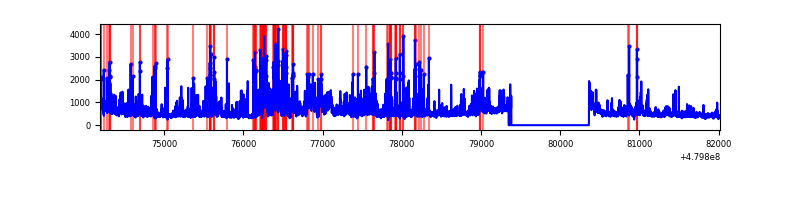 |
| C | 7830 | 6832 | 734 | 734 | 9.37% | 10.74% | 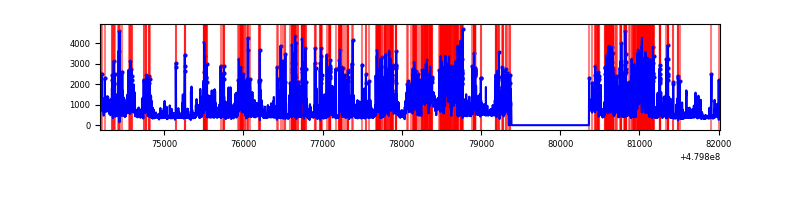 |
| D | 7830 | 6831 | 1221 | 1221 | 15.59% | 17.87% | 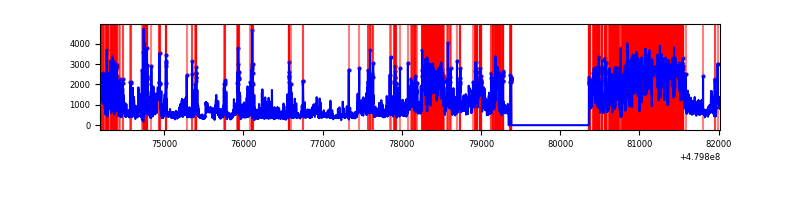 |
Top three noisy pixels from each quadrant. If the there are fewer than three noisy pixels in the level2.evt file, extra rows are filled as -1
| Pixel properties | Quadrant properties | ||||||
|---|---|---|---|---|---|---|---|
| Quadrant | DetID | PixID | Counts | Sigma | Mean | Median | Sigma |
| A | 12 | 250 | 358763 | 2081.97 | 695 | 677 | 172.0 |
| A | 7 | 206 | 260383 | 1509.97 | 695 | 677 | 172.0 |
| A | 13 | 248 | 219306 | 1271.14 | 695 | 677 | 172.0 |
| B | 8 | 128 | 430316 | 2878.91 | 706 | 683 | 149.2 |
| B | 10 | 254 | 380377 | 2544.28 | 706 | 683 | 149.2 |
| B | 5 | 185 | 241523 | 1613.84 | 706 | 683 | 149.2 |
| C | 4 | 12 | 1241981 | 6775.06 | 667 | 663 | 183.2 |
| C | 15 | 224 | 1040248 | 5674.01 | 667 | 663 | 183.2 |
| C | 12 | 250 | 488923 | 2664.9 | 667 | 663 | 183.2 |
| D | 6 | 42 | 2615655 | 14812.87 | 625 | 603 | 176.5 |
| D | 2 | 62 | 1126857 | 6379.63 | 625 | 603 | 176.5 |
| D | 3 | 12 | 500187 | 2829.88 | 625 | 603 | 176.5 |
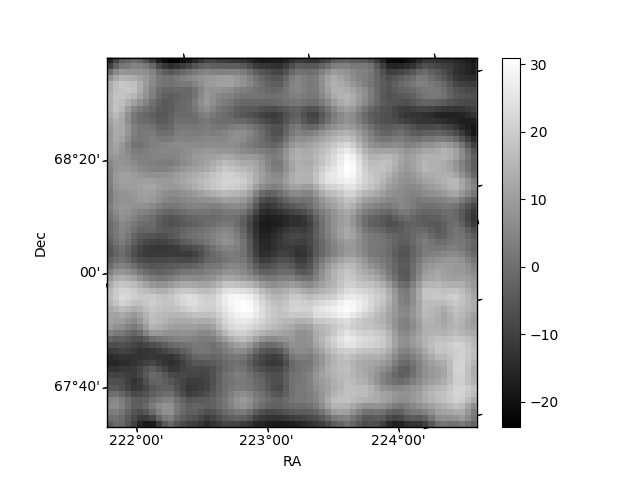
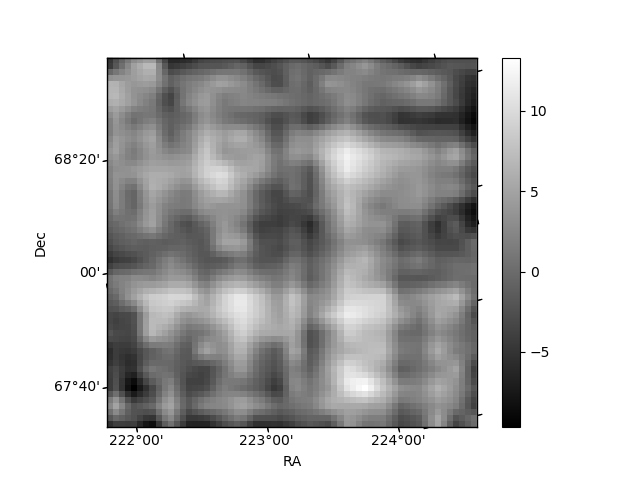
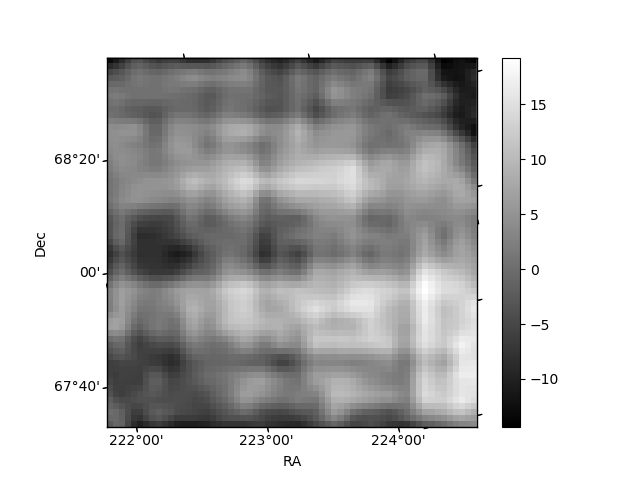
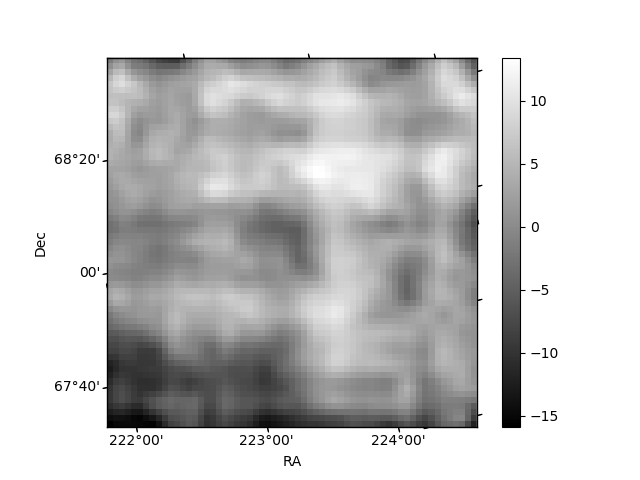
Histogram calculated using DETX and DETY for each event in the final _common_clean file
| Quadrant A | 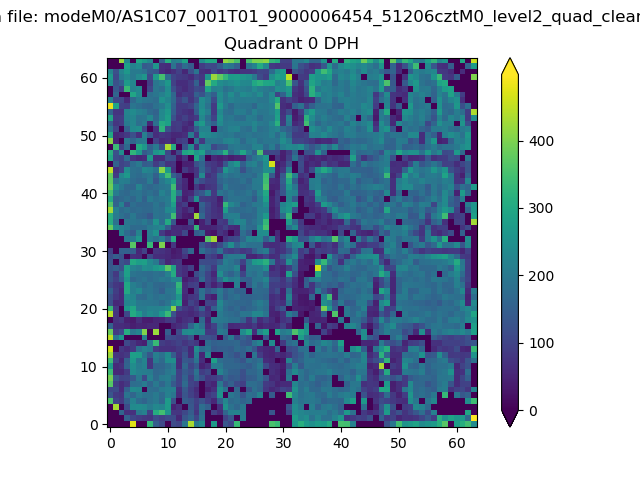 |
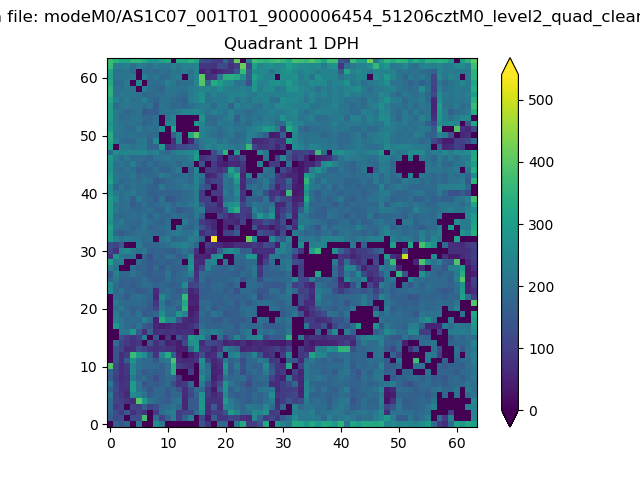 |
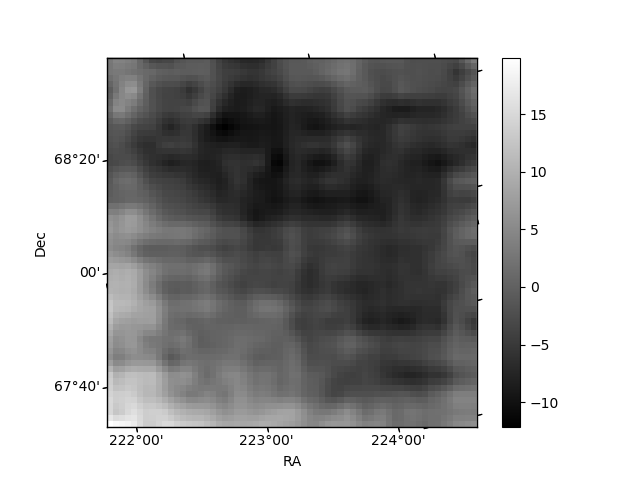
Quadrant B |
|---|---|---|---|
| Quadrant D | 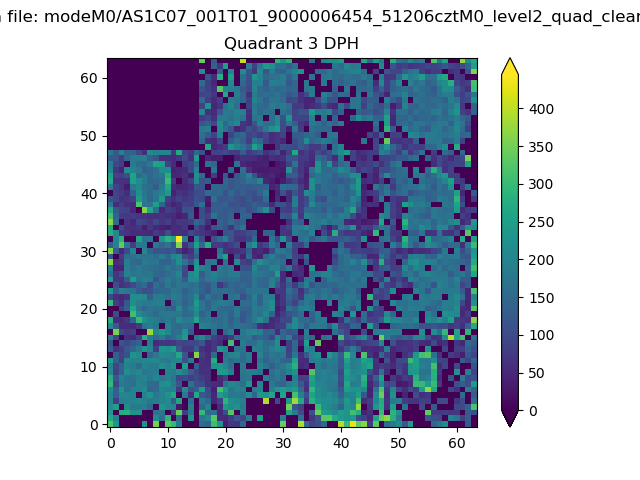 |
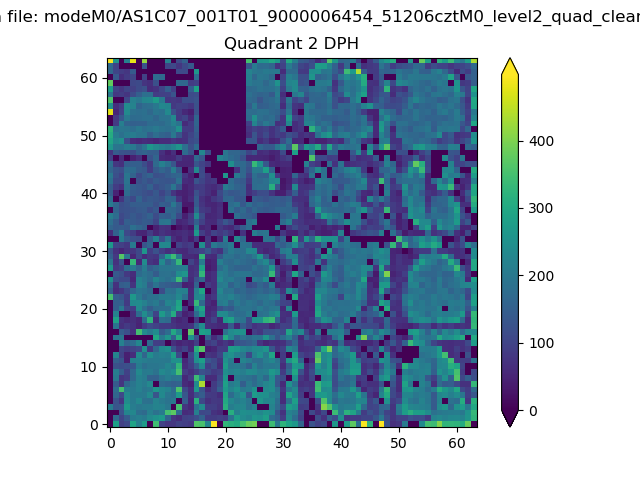 |
Quadrant C |
| Plot type | Count rate plots | Images |
|---|---|---|
| Comparison with Poisson distribution Blue bars denote a histogram of data divided into 1 sec bins. Red curve is a Poisson curve with rate = median count rate of data. |
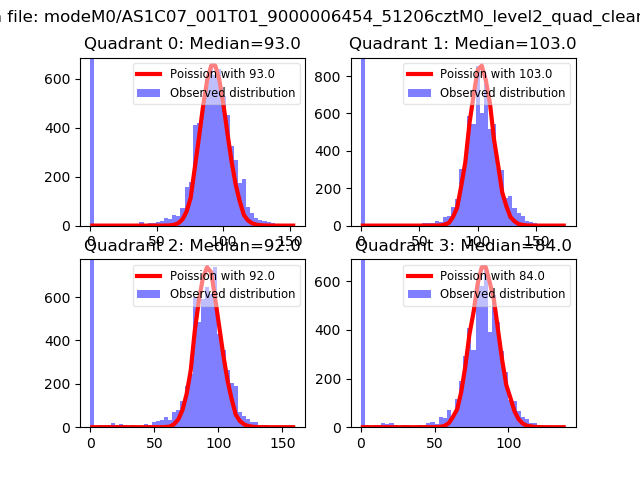 |
 |
| Quadrant-wise count rates Data is divided into 100 sec bins |
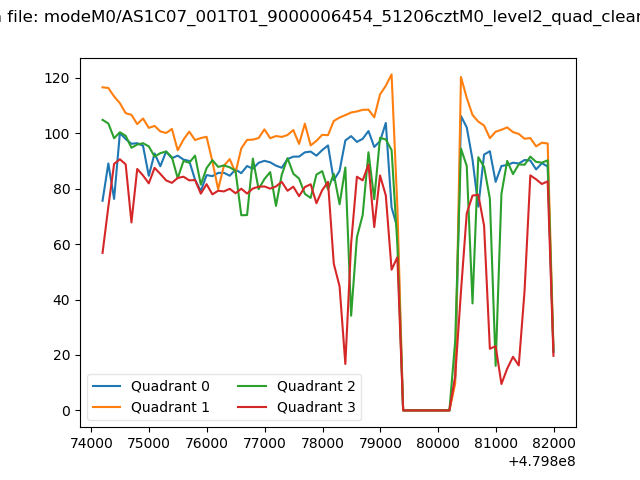 |
|
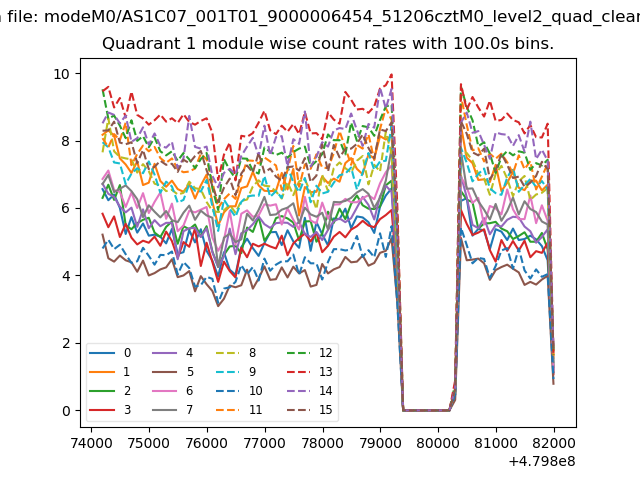
| Module-wise count rates for Quadrant A Data is divided into 100 sec bins |
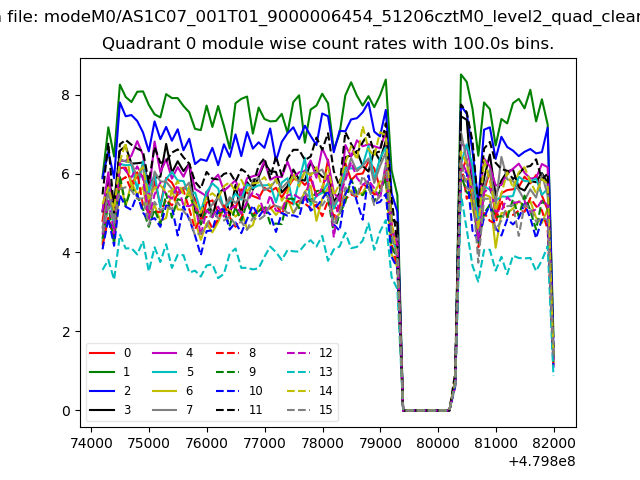 |
 |
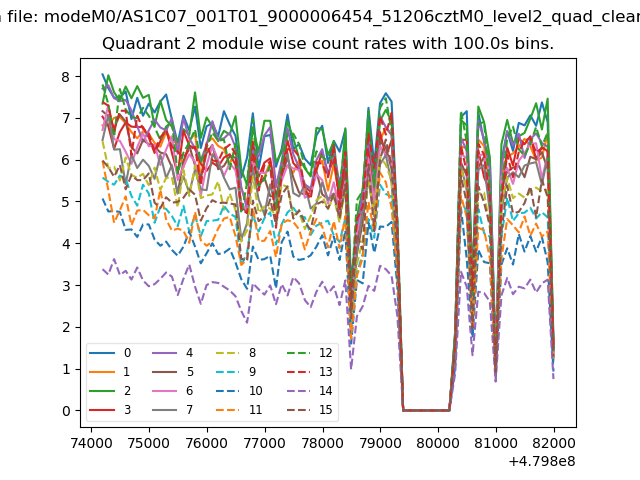
| Module-wise count rates for Quadrant B Data is divided into 100 sec bins |
 |
 |
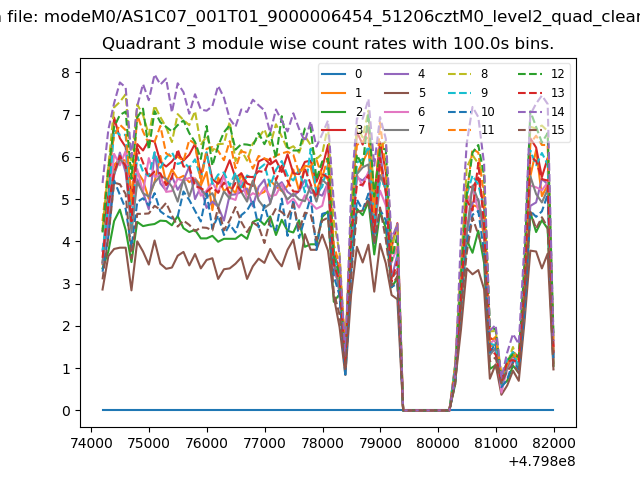
| Module-wise count rates for Quadrant C Data is divided into 100 sec bins |
 |
 |
| Module-wise count rates for Quadrant D Data is divided into 100 sec bins |
 |
 |
| Parameter | Plot |
|---|---|
| CZT HV Monitor | 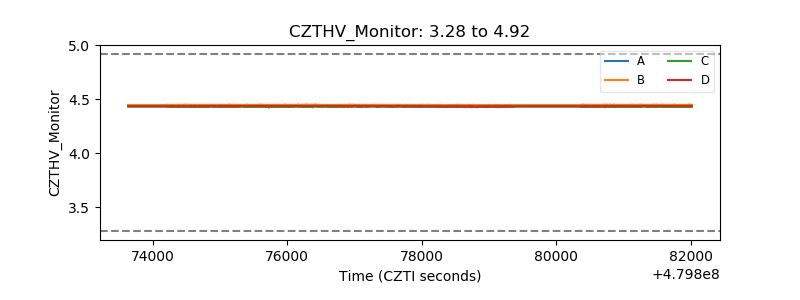 |
| D_VDD | 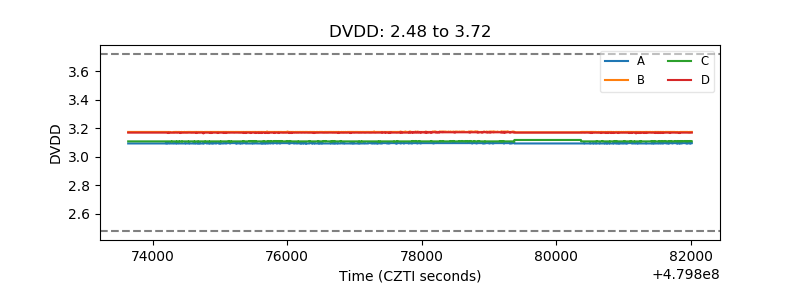 |
| Temperature 1 | 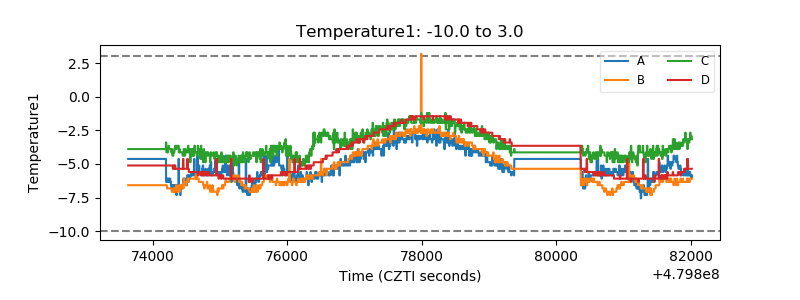 |
| Veto HV Monitor | 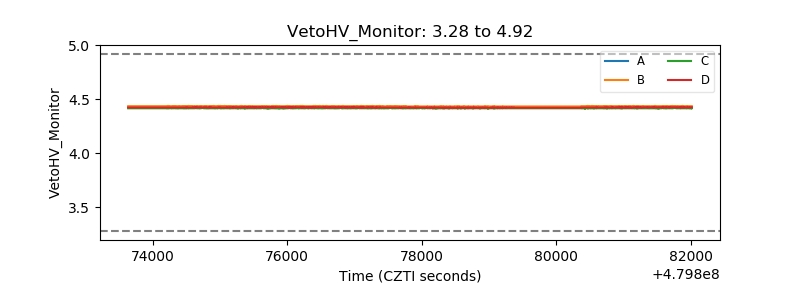 |
| Veto LLD | 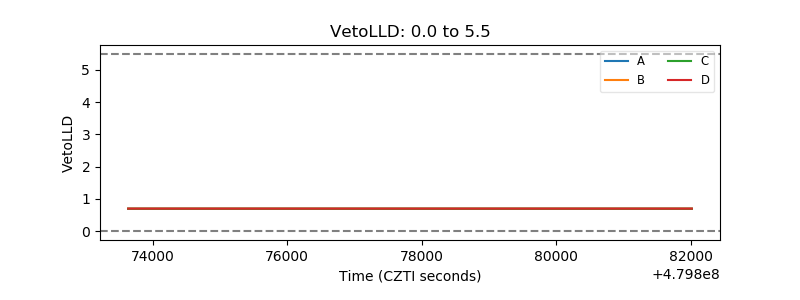 |
| Alpha Counter | 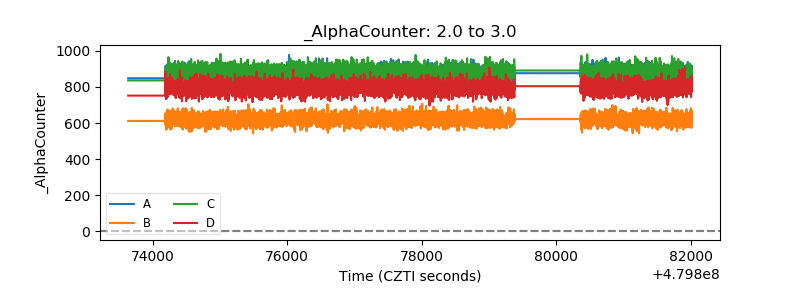 |
| _CPM_Rate | 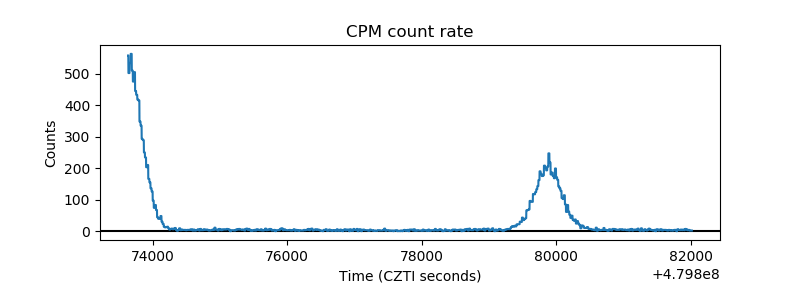 |
| CZT Counter | 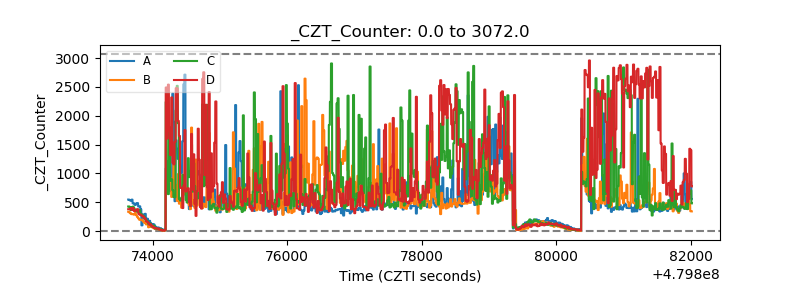 |
| +2.5 Volts monitor | 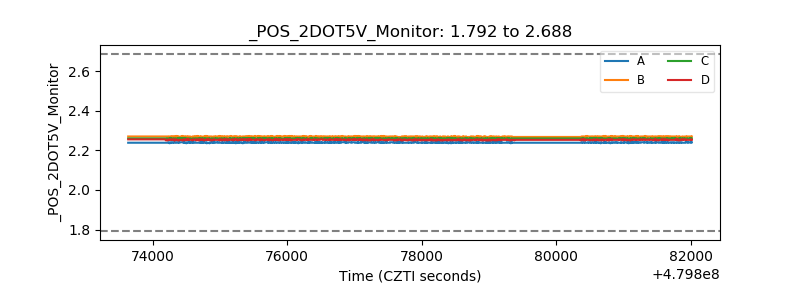 |
| +5 Volts monitor | 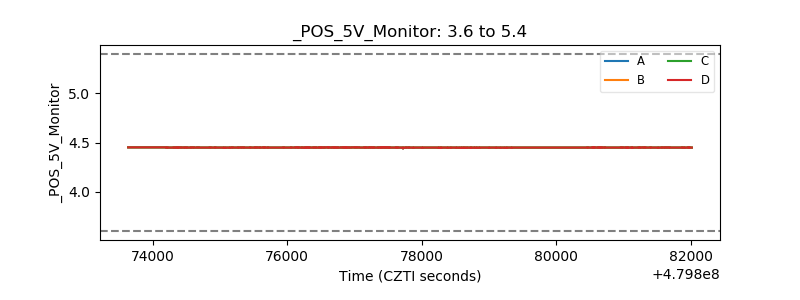 |
| _ROLL_ROT | 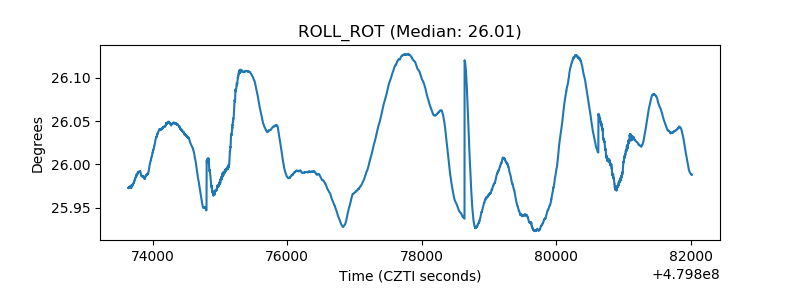 |
| _Roll_DEC | 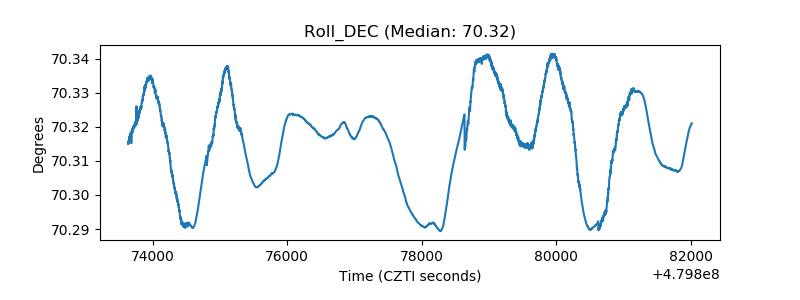 |
| _Roll_RA | 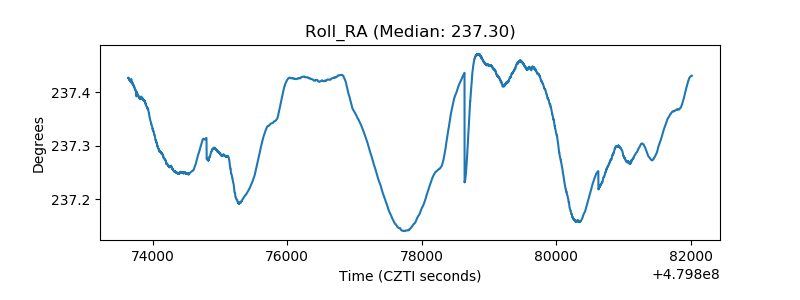 |
| Veto Counter | 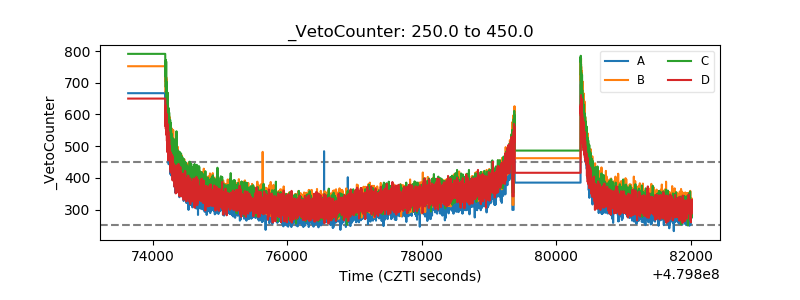 |